Value-Stream Mapping for Manufacturing
Value Stream Mapping is a Lean Manufacturing tool that use a flow diagram to document in great detail every step of a manufacturing process. Many organizations use value stream mapping as a key portion of their lean efforts. This graphical representation of a process is a powerful tool that helps in the diagnosis of process efficiency and allows companies to develop improved processes. Many lean practitioners use Value Stream Mapping as a fundamental tool to identify waste, cut process cycle times, and implement process improvement.

Pic.1 Value stream map (VSM).
This sample VSM flowchart shows the value stream in a manufacturing, production control and shipping processes.
See also Samples:
TEN RELATED HOW TO's:
Project timeline is a type of chart which allows visually represent the chronology of works for the project, placing the key points of the project (milestones) on a timescale.
You need to make professional looking project timeline? Create it with ConceptDraw DIAGRAM! ConceptDraw DIAGRAM extended with Timeline Diagrams Solution from the Management Area is the best timeline diagrams software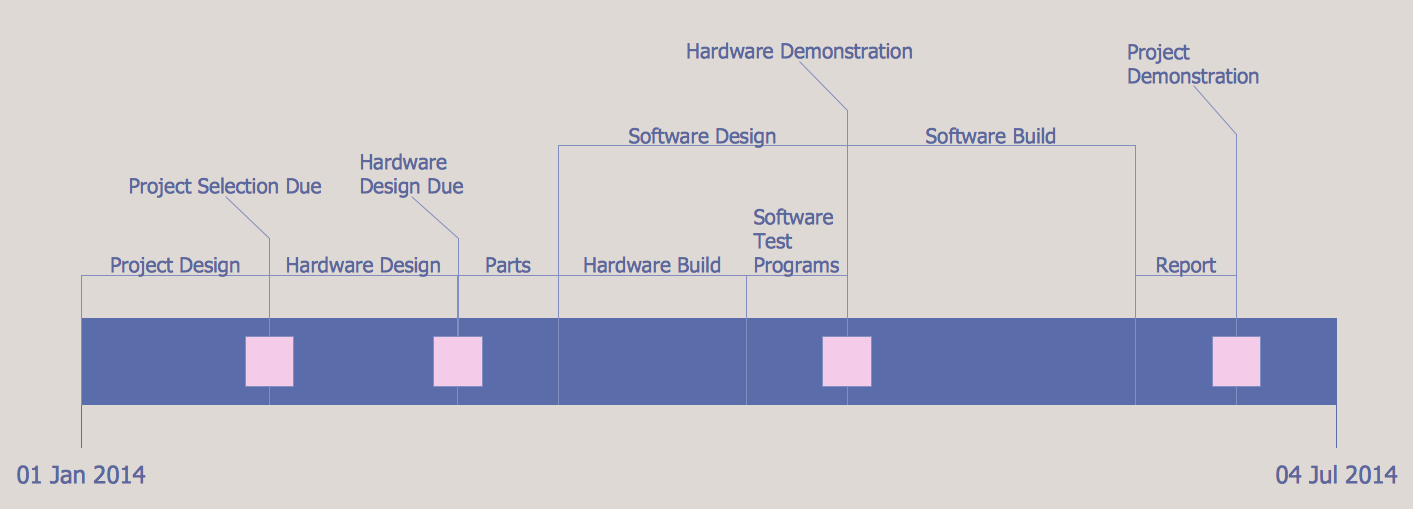
Picture: Project Timeline
Related Solution:
The Total Quality Management Diagram solution helps your organization visualize business and industrial processes. Create Total Quality Management diagrams for business process with ConceptDraw software.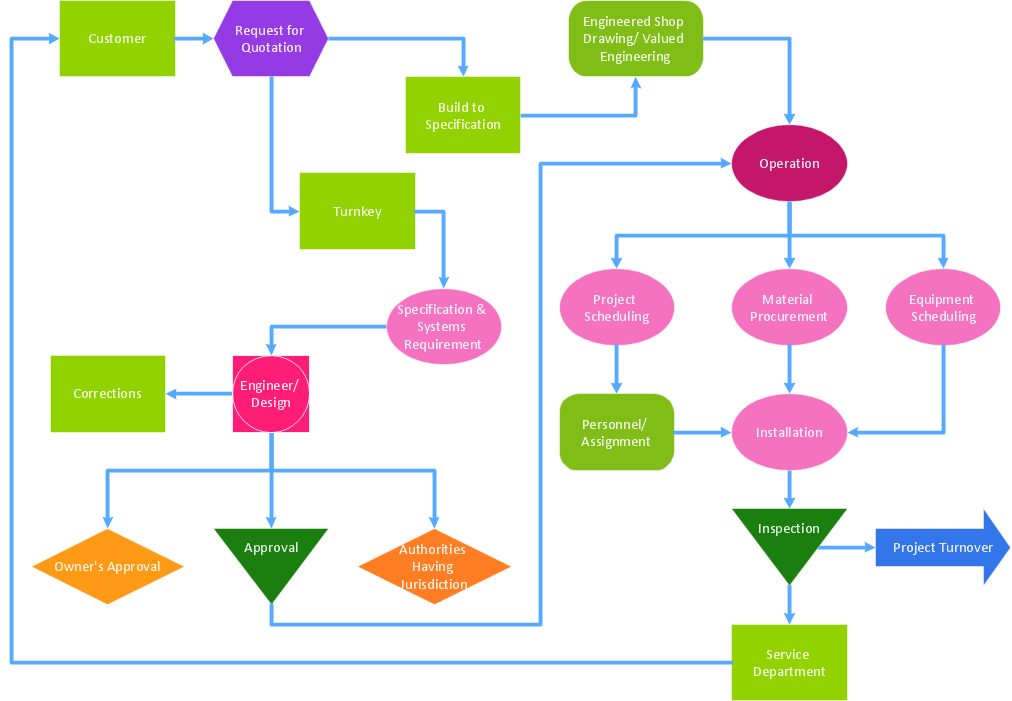
Picture: Identifying Quality Management System
Related Solution:
Risk Diagram (PDPC) - ConceptDraw OFFICE suite is a software for Risks Diagram making. This diagram identifies possible risks in accomplishing corrective actions. With the Risks Diagram, one analyzes each action separately in a tree of all actions and develops a preventive action in response of each potential obstacles or circumstances which may be a risk.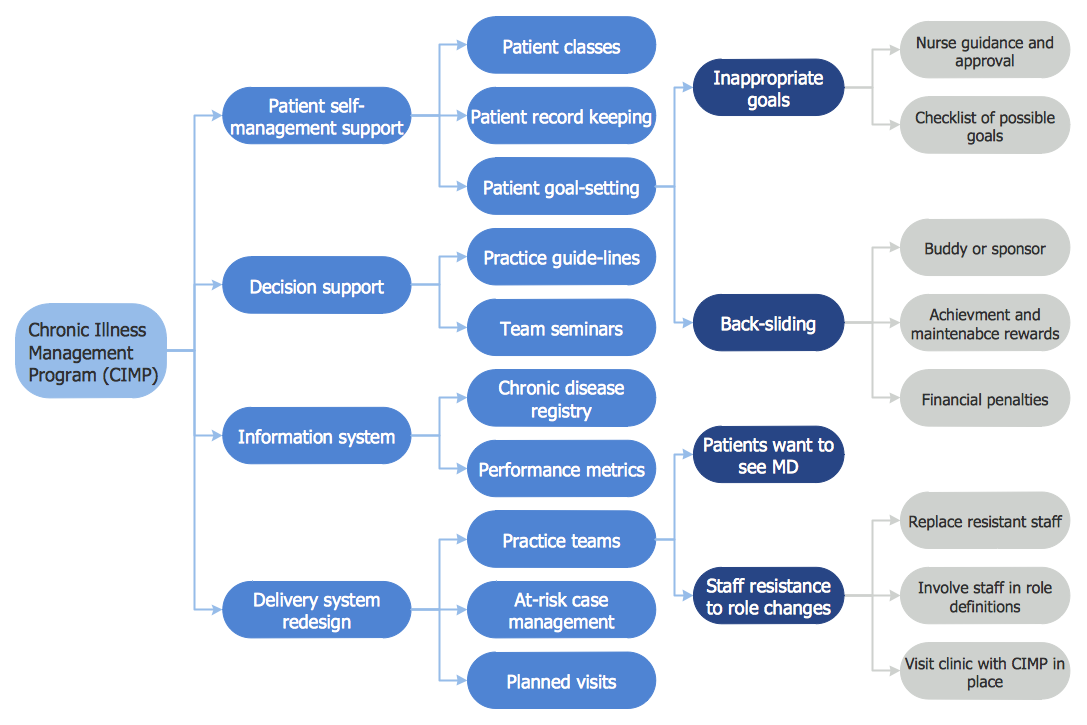
Picture: CORRECTIVE ACTIONS PLANNING. Risk Diagram (PDPC)
A competent delegation of responsibilities between workers guarantees business success in most cases. At first sight, it might seem that workflow diagram symbols are quite similar to a regular flowchart. But workflow diagram is a more accurate way to present working processes.
Workflow diagrams are helpful for a working process analyzation, to depict a pathway of process issues, personalize responsibilities and identify resources that will help to optimize a workflow. Generally, Workflow diagram deploys flowchart symbols for displaying work process steps and relationships. But, often it require some additions and improvements to become more professional and illustrative. The Workflow solution for ConceptDraw DIAGRAM provides the user with a big library of symbols that are designed especially for workflow diagrams.
Picture: Workflow Diagram Symbols
Related Solution:
Use ConceptDraw DIAGRAM diagramming and vector drawing software enhanced with Computer and networks solution to draw different types of network diagrams: physical layout and topology, LAN and WAN, Cisco, Apple, Wi-Fi wireless and Ethernet wired networks, etc.
Special libraries of highly detailed, accurate shapes and computer graphics, servers, hubs, switches, printers, mainframes, face plates, routers etc.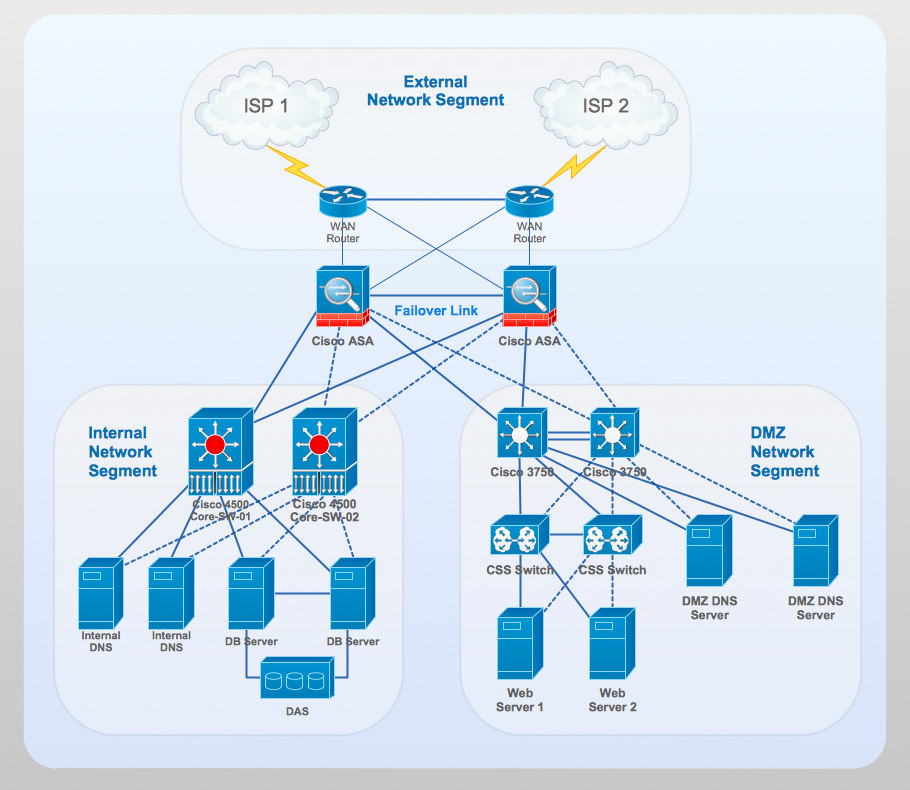
Picture: Network Gateway Router
Related Solution:
Connecting objects manually in ConceptDraw DIAGRAM is a snap:
- points;
- Connecting groups of objects;
- Auto-routing;
- Connectors text;
- Snap to Guides ;
- Quick.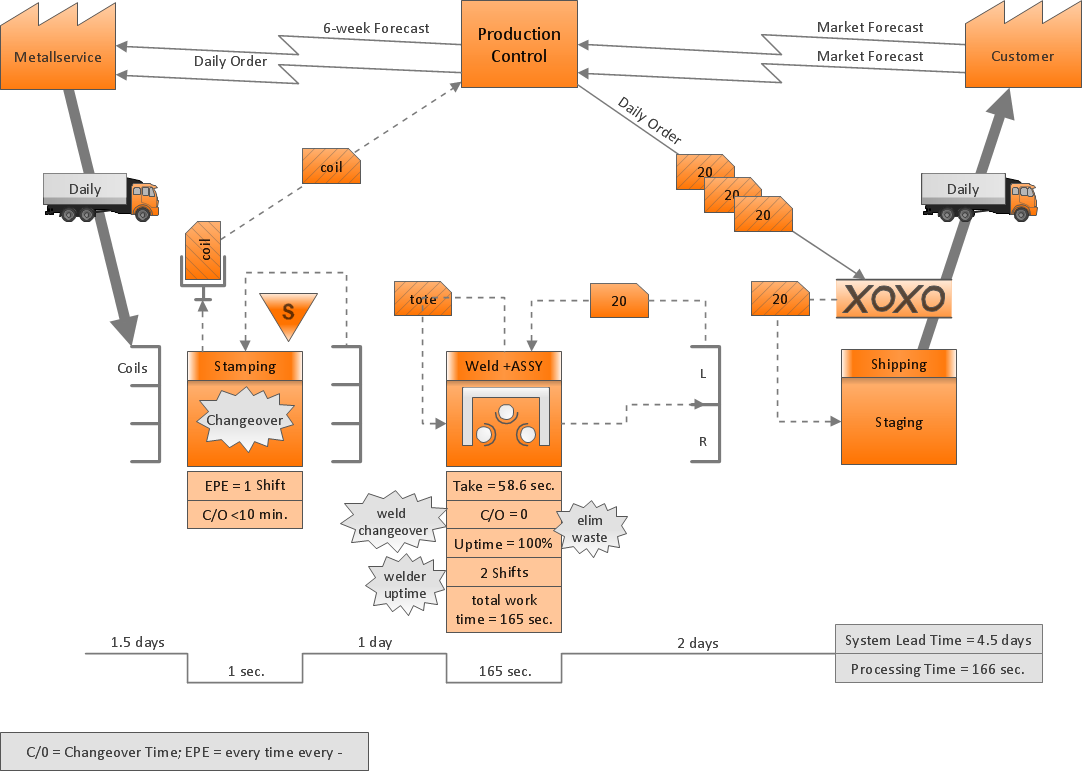
Picture: ConceptDraw Arrows10 Technology
Data Exchange - Tools to exchnage data files of major mindmapping software for team collaboration.
The Mind Map Exchange solution allows you to share mind maps with others who have 3rd party mind map applications.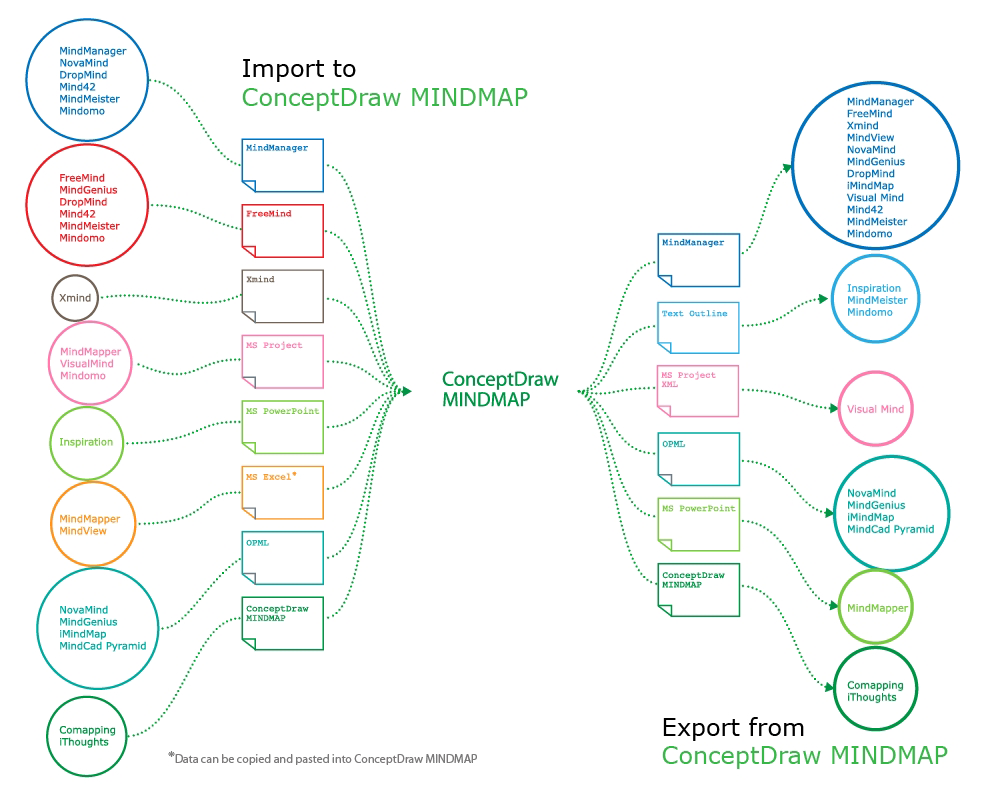
Picture: How to exchange data files of major mind mapping software?
Related Solution:
Users new to ConceptDraw PROJECT will find the Basic lessons an essential platform for familiarizing themselves with the program′s functions. This video lesson will teach you how to set up task trees and dependencies.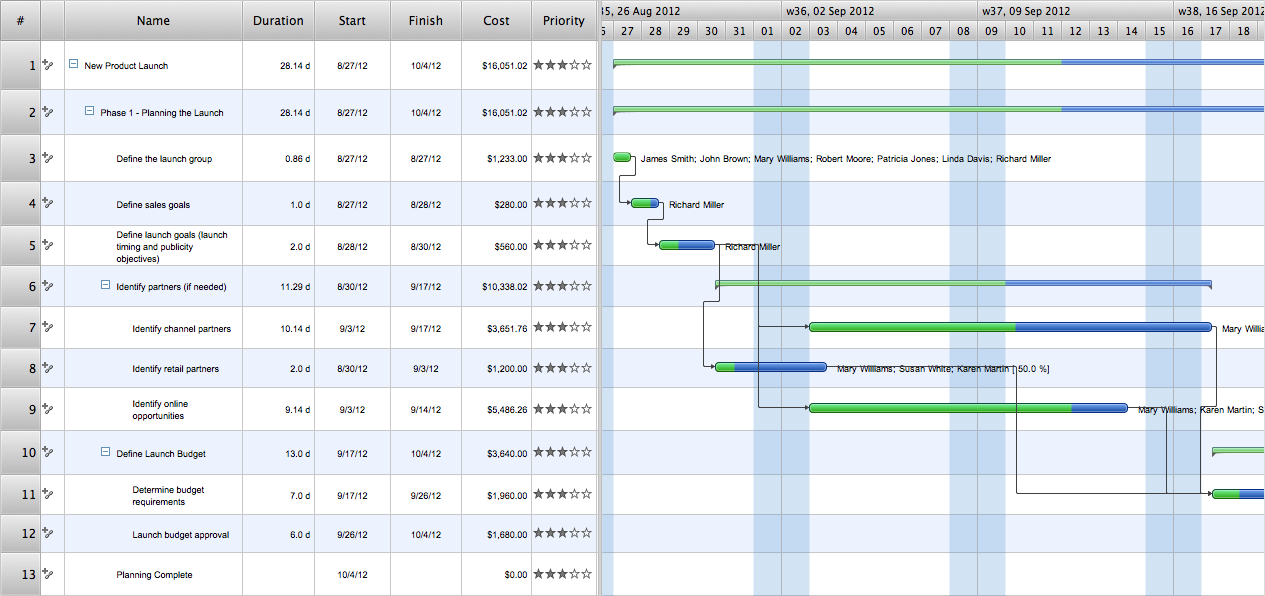
Picture: Project —Task Trees and Dependencies
UML Timing Diagram as special form of a sequence diagram are used to explore the behaviors of objects throughout a given period of time.
ConceptDraw has 393 vector stencils in the 13 libraries that helps you to start using software for designing your own UML Diagrams. You can use the appropriate stencils of UML notation from UML Timing library.
Picture: UML Timing Diagram, Design Elements
Related Solution:
This will let you create professional diagrams and charts using its simple RapidDraw option just in clicks. Take a look on a diagram you are looking for and create it fast and quickly.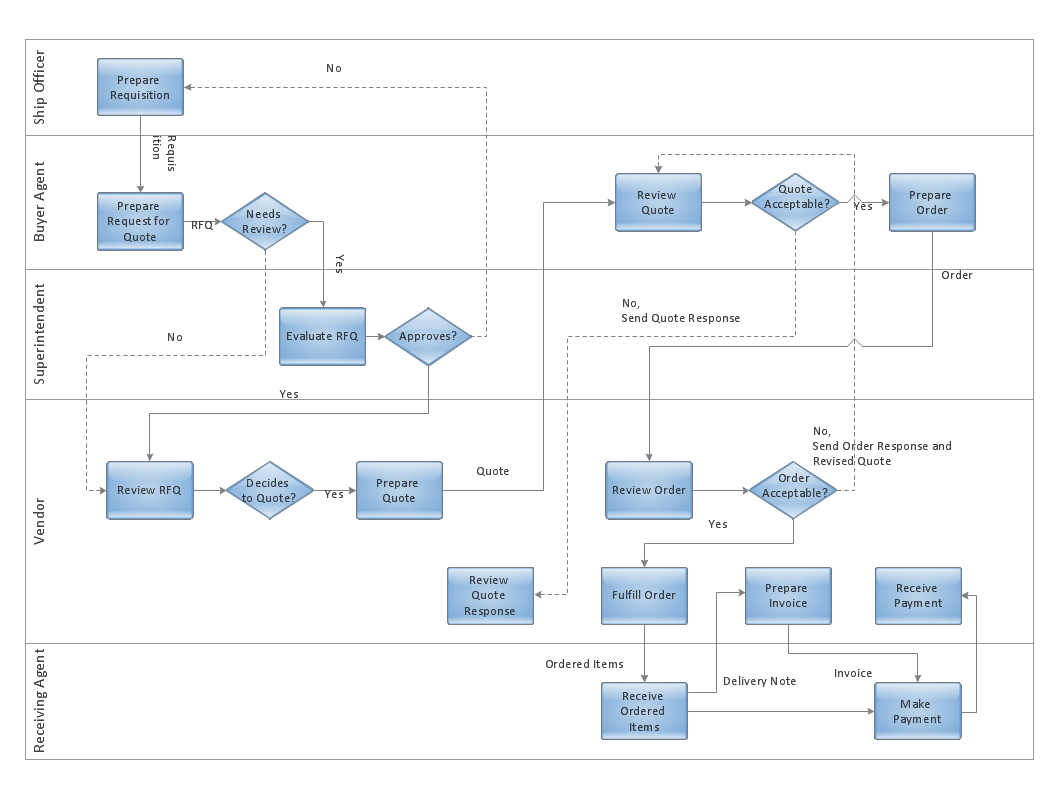
Picture: Powerful Drawing Feature for Creating Professional Diagrams
ConceptDraw
MINDMAP 16