Value Stream Mapping Symbols
Value Stream Mapping is a graphical technique that provides possibilities to improve analysis of a manufacturing process, at the stage of the transferring information or materials that required to deliver a product or service to the customer.
VSM symbols are the best for a production process designing.
Value Stream Mapping ensures a core analysis' items in a comprehensive graphical approach:
- The interplay between all of a manufacturing processes.
- The communications and materials during the complete production process.
- Efficiencies and losses of complex systems.
- Elaborate and implement actions that push forward organization's culture changes.
The entire Value Stream Mapping method uses a graphical representation of the manufacturing process, factors' pros and cons, that all stakeholders can easily understand.
The new Value Stream Mapping solution found in the ConceptDraw Solution Park continues to extend the range of ConceptDraw DIAGRAM. This solution extends software with several templates and samples, also value stream mapping symbols for drawing Value Stream Diagrams.
Value Stream Mapping Symbols
 Production Control
Central production scheduling or control department, person or operation.
 Customer/Supplier
It is the usual starting point for material flow.

 Inventories
 Shipment
 Electronic Information Flow Electronic flow such as EDI, Internet, intranets, LANs, WANs.
 Information Flow
 Material Flow/ PUSH Arrow "Pushing" of Material from One Process to the Next Process.
 Manual Info
 Pull Arrow Pull movement between internal steps.

 Supermarket

 Safety Stock
 Material Pull
 Dedicated Process Process, operation, machine or department, through which material flows.
All these value stream mapping symbols from the Value Stream Mapping library of Value Stream Mapping Solution were professionally designed to facilitate a drawing process for ConceptDraw DIAGRAM users.
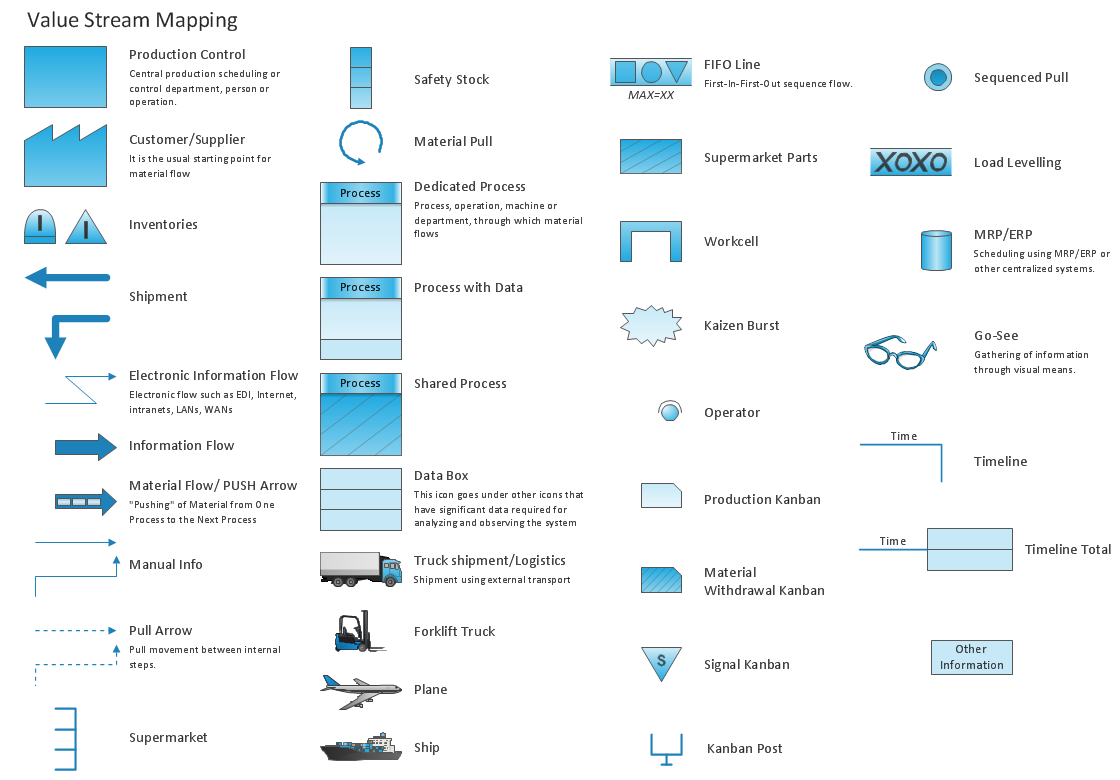
Example 1. Value Stream Mapping Symbols
Besides, all these objects are vector objects, so you can resize them without loss of quality, change their color to make your maps more bright and attractive.

Example 2. Value Stream Mapping Sample
This sample was created in ConceptDraw DIAGRAM using the value stream mapping symbols from the Value Stream Mapping Solution and shows the value stream in a manufacturing, production control and shipping processes. An experienced user spent 20 minutes creating this sample.
Use the Value Stream Mapping Solution for ConceptDraw DIAGRAM software to create your own professional looking Value Stream Maps quick, easy and effective.
All source documents are vector graphic documents. They are available for reviewing, modifying, or converting to a variety of formats (PDF file, MS PowerPoint, MS Visio, and many other graphic formats) from the ConceptDraw STORE. The Value Stream Mapping Solution is available for all ConceptDraw DIAGRAM or later users.
TEN RELATED HOW TO's:
When describing any computer network, we imagine a set of devices and nodes, arranged in some way. Talking about network structures, we should distinguish physical and logical network topologies, as physical topology is about devices location and logical topology illustrates data flow. In the same time, they do not have to match, and some devices, such as repeaters, may have a physical star layout, but a bus logical topology.
There are two main types of computer network topologies: Physical topology that show the physical organization of a network - equipment and types of connections. Star network topology involves a set of devices that is connected to a single hub (router). Ring network topology means that, devices connected according this topology have two connections, connecting with nearby devices to make a loop. Bus network topology is the topology presented at the current diagram. It is similar to a ring topology. The difference is that data moves up and down a linear connection, copying itself where network equipment works as bus-stations along the way. This network topology can be used for small network, or when adding an extra device into a network.
Picture: Network Topologies
Related Solution:
ConceptDraw - Perfect Network Diagramming Software with examples of Backbone Network Diagrams. ConceptDraw Network Diagram is ideal for network engineers and network designers who need to draw Backbone Network diagrams.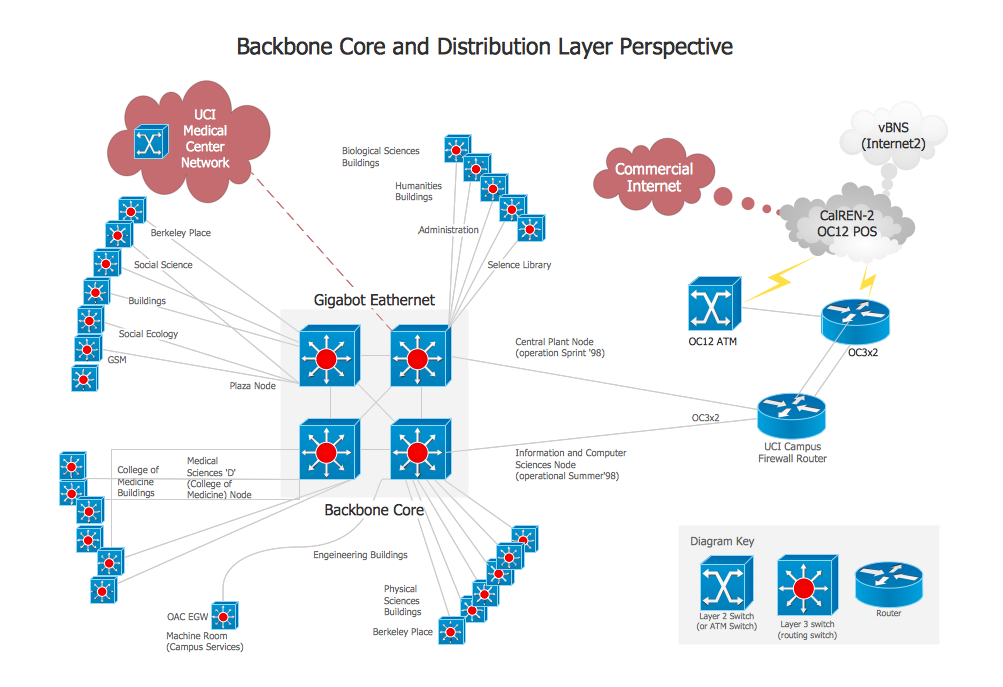
Picture: Network Diagram SoftwareBackbone Network
ConceptDraw DIAGRAM software provides vector shapes and connector tools for quick and easy drawing diagrams for business, technology, science and education
Picture: Cross Functional Flowchart Shapes Stencil
An abstract representation is usually the first thing you will need while developing a database. To understand the ways that databases are structured, you should look through entity-relationship diagram examples and see the notations features and attributes. With an entity-relationship model you can describe a database of any complexity.
This Entity-relationship diagram is a tool for software developers. It enables every element of database to be managed, communicated and tested before release. This ERD was created using symbols advocated by Chen's notation. Because of a linguistic origin of the Chen’s notation, the boxes representing entities could be interpreted as nouns, and the relationships between them are in verb form, shown on a diagram as a diamond.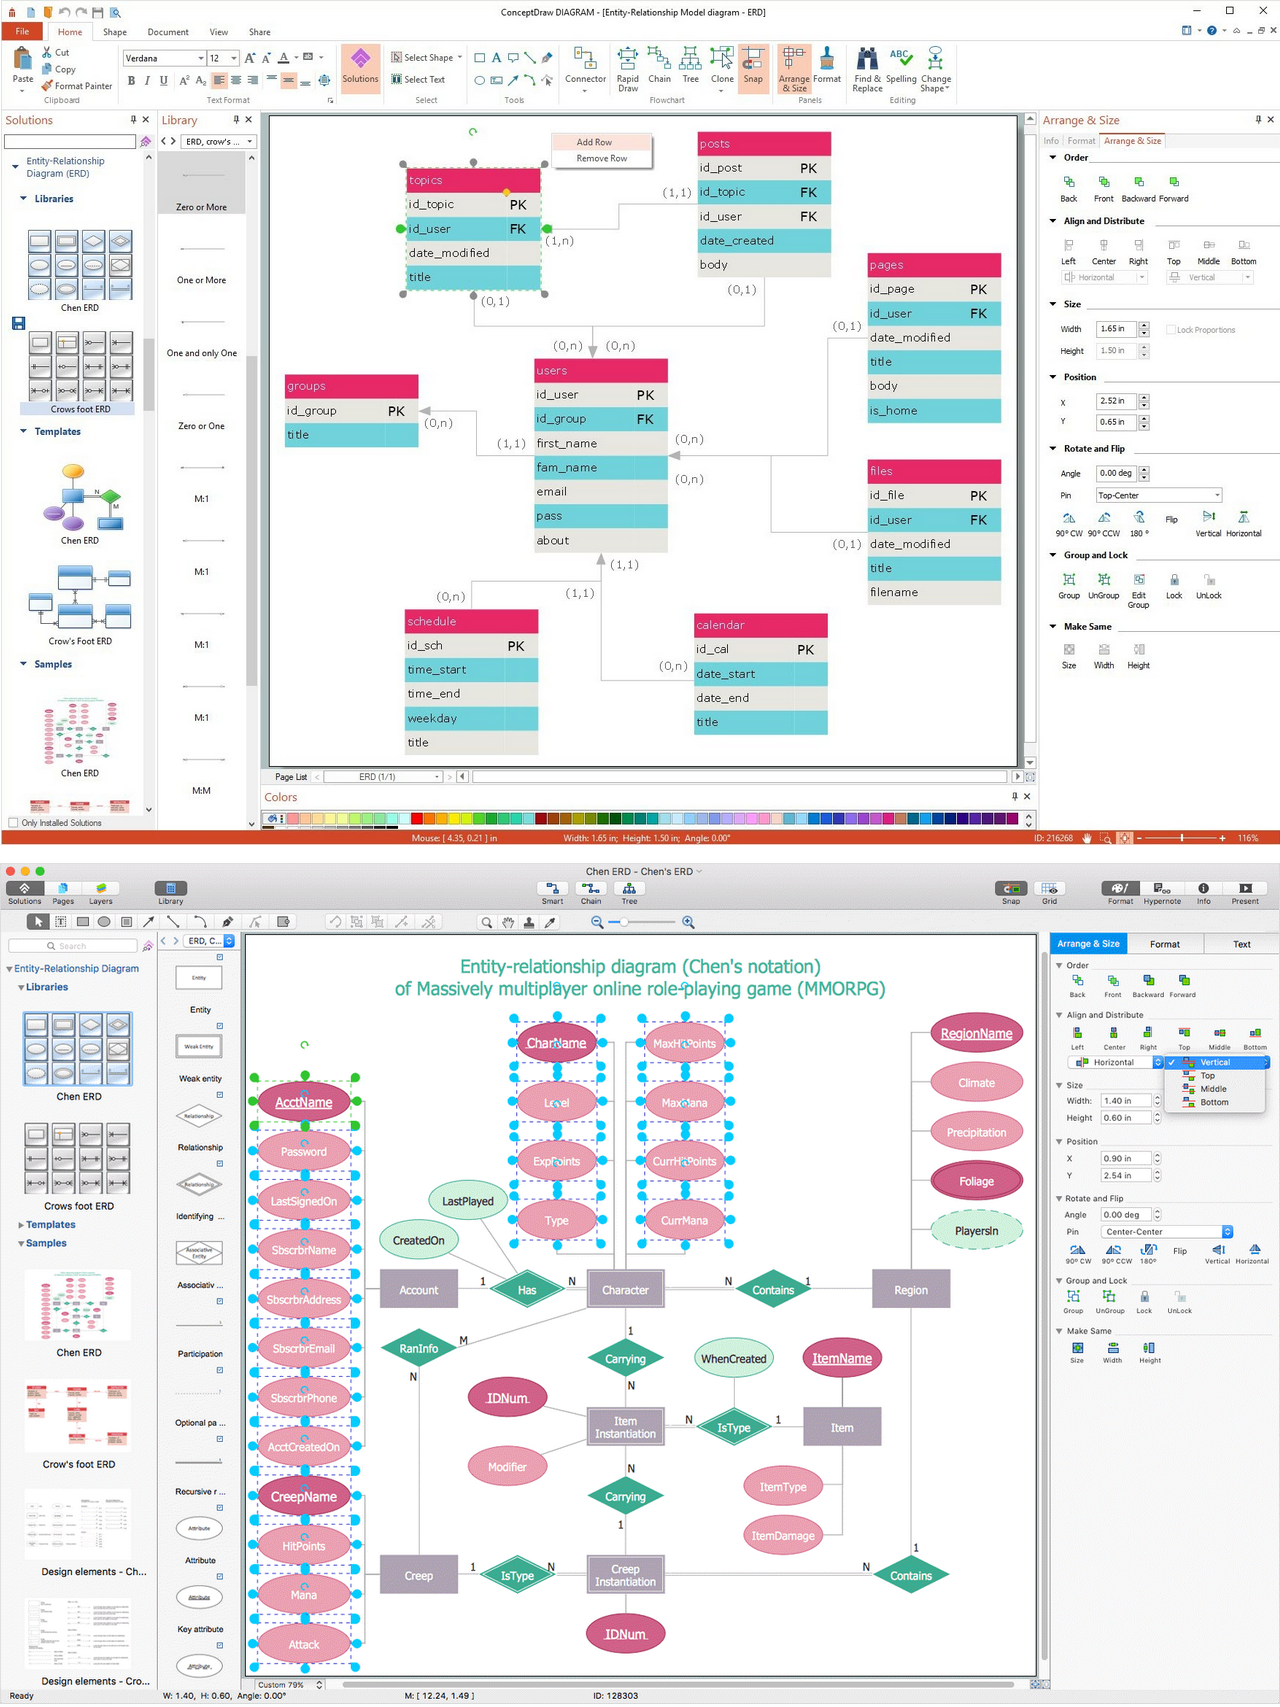
Picture: Entity Relationship Diagram Examples
Related Solution:
Why do you need a business process flow diagram? How to use business process diagram software? Explore ✔️ the significance, ✔️ creation process, and ✔️ discover cutting-edge software solutions designed to streamline and optimize your workflows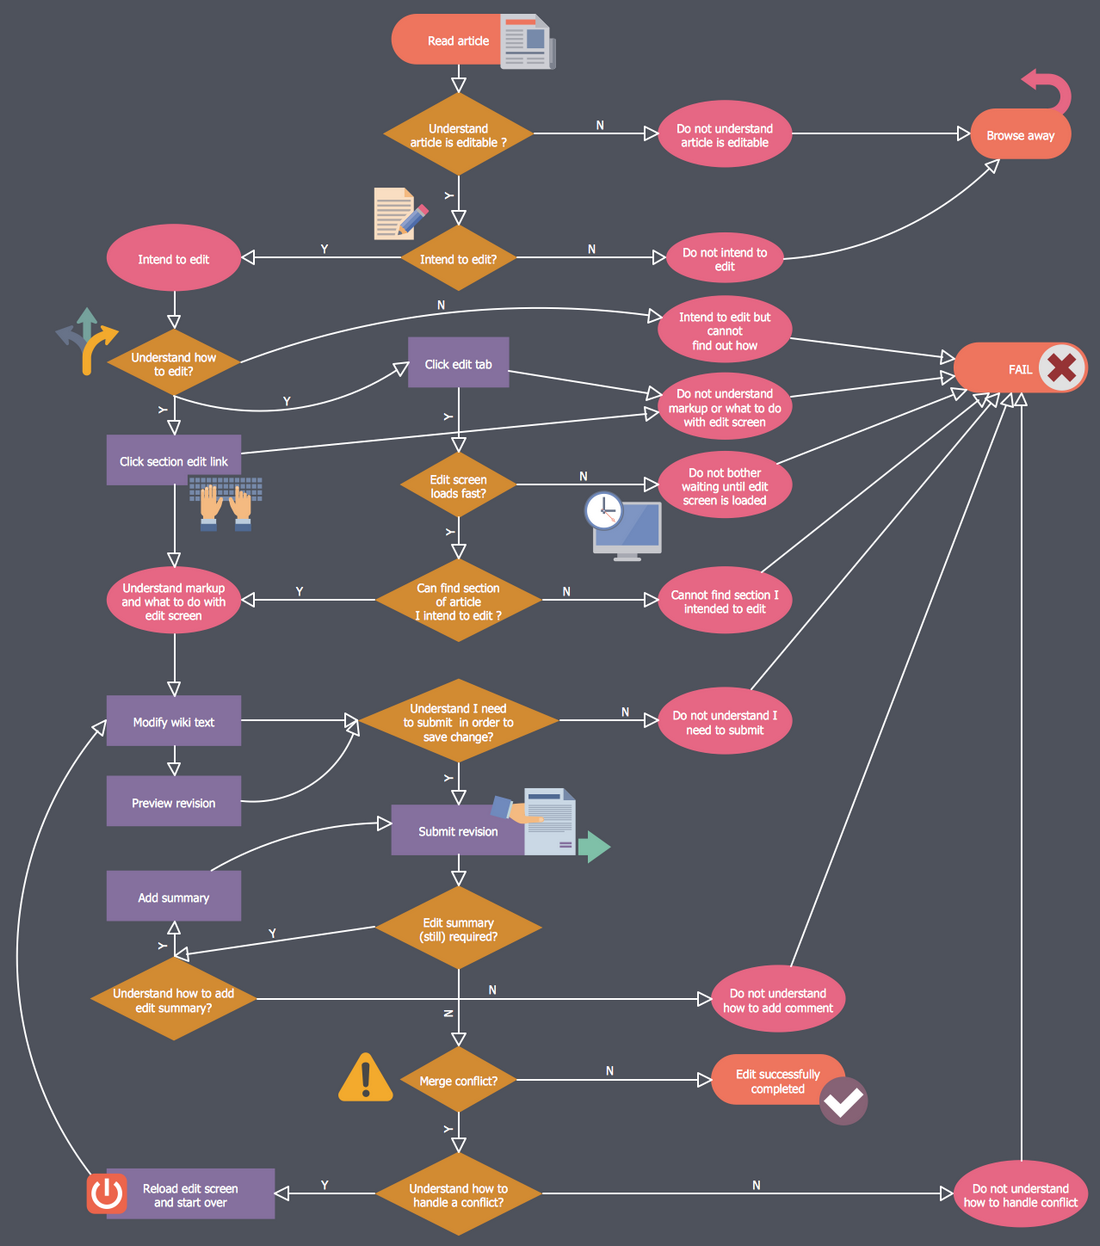
Picture: Business Process Workflow Diagrams & Software
Related Solution:
Learn the most common process flowchart symbols used in business process diagrams and workflow charts. Includes symbol meanings, examples, and a practical reference table.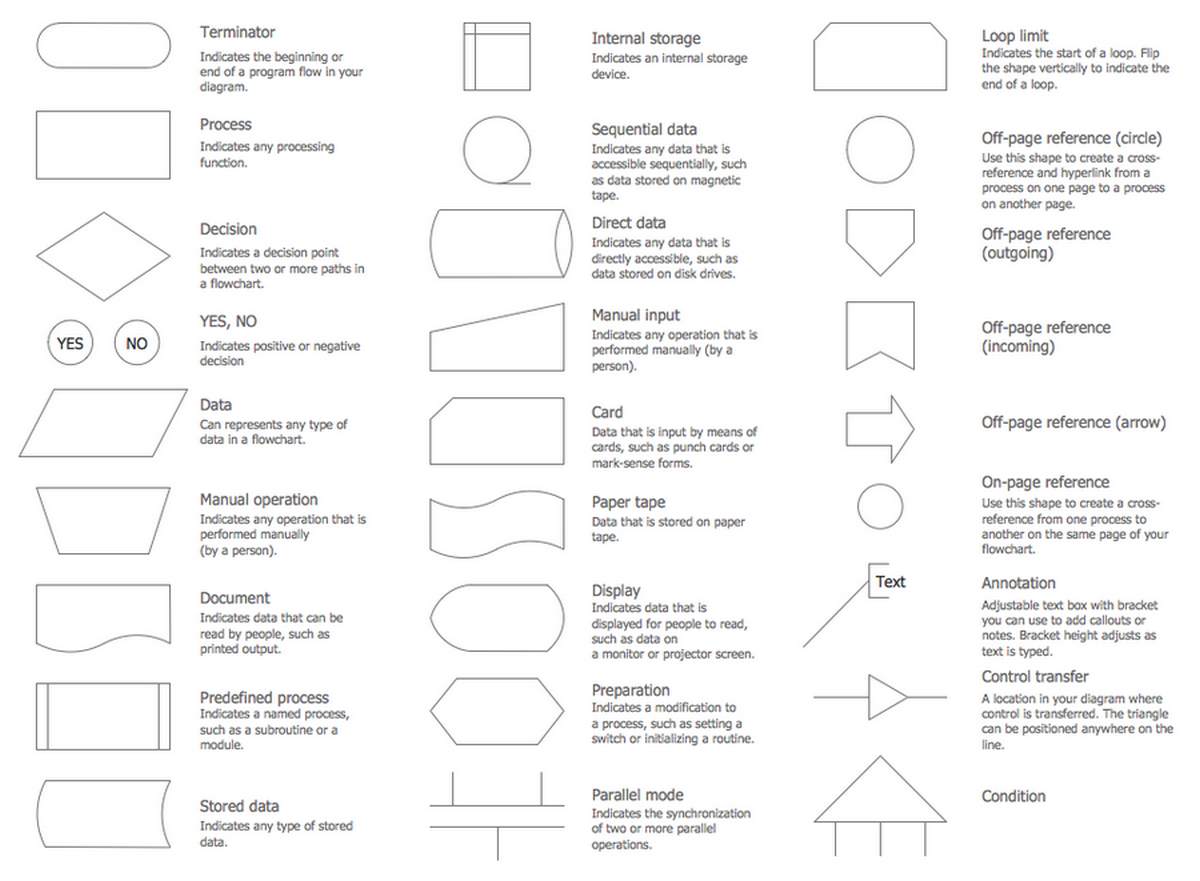
Picture: Process Flowchart Symbols: Meaning, Types and Examples
Related Solution:
ConceptDraw DIAGRAM extended with Mathematics solution from the Science and Education area is a powerful diagramming and vector drawing software that offers all needed tools for mathematical diagrams designing.
Mathematics solution provides 3 libraries with predesigned vector mathematics symbols and figures:
Solid Geometry Library, Plane Geometry Library and Trigonometric Functions Library.
Picture: Mathematics Symbols
Related Solution:
A competent delegation of responsibilities between workers guarantees business success in most cases. At first sight, it might seem that workflow diagram symbols are quite similar to a regular flowchart. But workflow diagram is a more accurate way to present working processes.
Workflow diagrams are helpful for a working process analyzation, to depict a pathway of process issues, personalize responsibilities and identify resources that will help to optimize a workflow. Generally, Workflow diagram deploys flowchart symbols for displaying work process steps and relationships. But, often it require some additions and improvements to become more professional and illustrative. The Workflow solution for ConceptDraw DIAGRAM provides the user with a big library of symbols that are designed especially for workflow diagrams.
Picture: Workflow Diagram Symbols
Related Solution:
All computer networks differ by various params, and their size is one of them. As global area networks are the biggest, personal area (PAN) networks are the smallest. Personal computers, smartphones and other devices that have possibility to connect to Internet form a personal network.
This diagram was created using ConceptDraw Computer Network Diagrams to represent a typical components of Personal area network. A personal area network (PAN) is the connection of IT devices around an individual person. This sample of personal area network involves a notebook, a personal digital assistant (PDA), and a portable printer. Commonly a PAN contains such wireless devices as mouse, keyboard, smartphone and tablet. A wireless connection is typical for a PAN.
Picture: Personal area (PAN) networks. Computer and Network Examples
Related Solution:
This sample shows the Flowchart that displays the solid-state welding processes, the types of welding.
Picture: Types of Welding in Flowchart
Related Solution:
