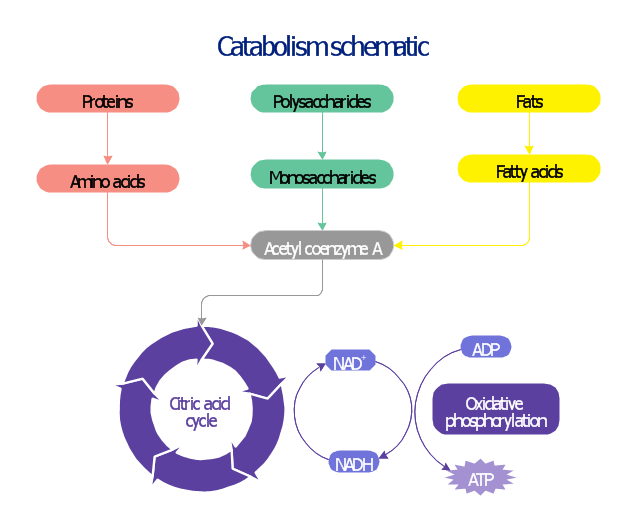
This biochemical chart display how proteins, polysaccharides and fats from food are digested into gastrointestinal tract into aminoacids, monosaccharides and fatty acids, and then broken down and oxidized to carbon dioxide and water in cellular processes of energy generation.
This metabolic pathway map was redesigned from Wikipedia file: Catabolism schematic.svg. [en.wikipedia.org/ wiki/ File:Catabolism_ schematic.svg]
The biochemical diagram example "Catabolism schematic" was created using the ConceptDraw PRO diagramming and vector drawing software extended with the Biology solution from the Science and Education area of ConceptDraw Solution Park.
 Health Food
The Health Food solution contains the set of professionally designed samples and large collection of vector graphic libraries of healthy foods symbols of fruits, vegetables, herbs, nuts, beans, seafood, meat, dairy foods, drinks, which give powerful possi
Physical Activity Plan
The physical activity is one of the key aspects of a healthy lifestyle. It makes a person not only more attractive physically, but also significantly improves his health, positively affects the life's duration, reduces the chances of appearance the serious diseases. This can be a serious sports occupation, but it is not necessary, the moderate physical activity is also very useful and important for everyone. It can be any muscle activity performed during the day, week, month, or year, no matter these are the special physical exercises, dancing, housework, working in the garden, climbing stairs, or just walking. The physical activity has a particular importance for children's health. The exercises and physical activity allow children to prevent development of various chronic diseases and heart illnesses yet at early age, promotes healthy and harmonious child's development, physical, mental and intellectual. The Mind Map designed in ConceptDraw MINDMAP software depicts detailed activity plan, which illustrates the proposal to incorporate more physical activity into a college community.Healthy Diet Plan
The human organism is so constituted that for a full life you need a wide range of nutrients, minerals and vitamins. To get all this, it is necessary to enrich your nutrition by natural and healthy food. The same microelements and nutrients are contained in different foods, so it is very important to create your own healthy diet plan, based on your preferences and containing the balance of nutrients suitable for you. ConceptDraw PRO diagramming and vector drawing software extended with Health Food solution from the Food and Beverage area of ConceptDraw Solution Park contains powerful tools for designing healthy diet plan."Citric acid cycle (tricarboxylic acid cycle, TCA cycle, Krebs cycle) is a series of chemical reactions used by all aerobic organisms to generate energy through the oxidation of acetate derived from carbohydrates, fats and proteins into carbon dioxide and chemical energy in the form of adenosine triphosphate (ATP)." [Citric acid cycle. Wikipedia]
This biochemical diagram example shows metabolic pathways map of citric acid cycle reactions.
This sample was redesigned from the Wikimedia Commons file: TCA cycle.svg. [commons.wikimedia.org/ wiki/ File:TCA_ cycle.svg]
This image is licensed under the Creative Commons Attribution 3.0 Unported license. [creativecommons.org/ licenses/ by/ 3.0/ deed.en]
The metabolic pathway map example "Citric acid cycle (TCA cycle)" was created using the ConceptDraw PRO diagramming and vector drawing software extended with the Biology solution from the Science and Education area of ConceptDraw Solution Park.
The vector stencils library "Citric acid cycle (TCA cycle)" contains 26 symbols of metabolites for drawing metabolic pathway maps and biochemical shematic diagrams of the citric acid cycle (TCA cycle, tricarboxylic acid cycle, Krebs cycle) and diagrams of metabolism processes.
"The citric acid cycle - also known as the tricarboxylic acid cycle (TCA cycle), or the Krebs cycle, - is a series of chemical reactions used by all aerobic organisms to generate energy through the oxidation of acetate derived from carbohydrates, fats and proteins into carbon dioxide and chemical energy in the form of adenosine triphosphate (ATP). In addition, the cycle provides precursors of certain amino acids as well as the reducing agent NADH that is used in numerous other biochemical reactions. Its central importance to many biochemical pathways suggests that it was one of the earliest established components of cellular metabolism and may have originated abiogenically.
The name of this metabolic pathway is derived from citric acid (a type of tricarboxylic acid) that is consumed and then regenerated by this sequence of reactions to complete the cycle. In addition, the cycle consumes acetate (in the form of acetyl-CoA) and water, reduces NAD+ to NADH, and produces carbon dioxide as a waste byproduct. The NADH generated by the TCA cycle is fed into the oxidative phosphorylation (electron transport) pathway. The net result of these two closely linked pathways is the oxidation of nutrients to produce usable chemical energy in the form of ATP." [Citric acid cycle. Wikipedia]
The shapes example "Design elements - TCA cycle" is included in the Biology solution from the Science and Education area of ConceptDraw Solution Park.
 Pie Charts
Pie Charts are extensively used in statistics and business for explaining data and work results, in mass media for comparison (i.e. to visualize the percentage for the parts of one total), and in many other fields. The Pie Charts solution for ConceptDraw PRO v10 offers powerful drawing tools, varied templates, samples, and a library of vector stencils for simple construction and design of Pie Charts, Donut Chart, and Pie Graph Worksheets.
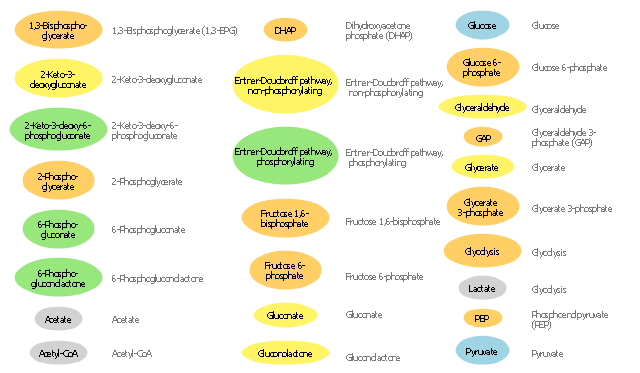
The vector stencils library "Carbohydrate metabolism" contains 25 icons of metabolite symbols.
Use these shapes for drawing carbohydrate metabolism schematics, biochemical diagrams and metabolic pathways maps.
"Carbohydrates are a superior short-term fuel for organisms because they are simpler to metabolize than fats or those amino acids (components of proteins) that can be used for fuel. In animals, the most important carbohydrate is glucose. The concentration of glucose in the blood is used as the main control for the central metabolic hormone, insulin. Starch, and cellulose in a few organisms (e.g., some animals ... and ... microorganisms), both being glucose polymers, are disassembled during digestion and absorbed as glucose. Some simple carbohydrates have their own enzymatic oxidation pathways, as do only a few of the more complex carbohydrates. The disaccharide lactose, for instance, requires the enzyme lactase to be broken into its monosaccharides components; many animals lack this enzyme in adulthood." [Carbohydrate metabolism. Wikipedia]
The shapes example "Design elements - Carbohydrate metabolism" is included in the Biology solution from the Science and Education area of ConceptDraw Solution Park.
 Area Charts
Area Charts are used to display the cumulative totals over time using numbers or percentages; or to show trends over time among related attributes. The Area Chart is effective when comparing two or more quantities. Each series of data is typically represented with a different color, the use of color transparency in an object’s transparency shows overlapped areas and smaller areas hidden behind larger areas.
The vector stencils library "HR arrows" contains 57 arrow pictograms.
Use this arrow icon set to draw your HR flowcharts, workflow diagrams and process charts with the ConceptDraw PRO diagramming and vector drawing software.
The arrow icons library "HR arrows" is included in the HR Flowcharts solution from the Management area of ConceptDraw Solution Park.
Use this arrow icon set to draw your HR flowcharts, workflow diagrams and process charts with the ConceptDraw PRO diagramming and vector drawing software.
The arrow icons library "HR arrows" is included in the HR Flowcharts solution from the Management area of ConceptDraw Solution Park.
The vector stencils library "Sales arrows" contains 57 arrow symbols.
Use these arrow icon set to draw your sales flowcharts, workflow diagrams and process charts with the ConceptDraw PRO diagramming and vector drawing software.
The arrow pictograms library "Sales arrows" is included in the Sales Flowcharts solution from the Marketing area of ConceptDraw Solution Park.
 Cooking Recipes
Create quick and easy recipe diagrams with the Cooking Recipes solution. Make a tasty meal for dinner, for holidays, or for a party.
The vector stencils library "Sales arrows" contains 57 arrow symbols.
Use these arrow icon set to draw your sales flowcharts, workflow diagrams and process charts with the ConceptDraw PRO diagramming and vector drawing software.
The arrow pictograms library "Sales arrows" is included in the Sales Flowcharts solution from the Marketing area of ConceptDraw Solution Park.
Use these arrow icon set to draw your sales flowcharts, workflow diagrams and process charts with the ConceptDraw PRO diagramming and vector drawing software.
The arrow pictograms library "Sales arrows" is included in the Sales Flowcharts solution from the Marketing area of ConceptDraw Solution Park.
- Catabolism schematic - Biochemical diagram | Design elements ...
- Diagram Of Biochemisty Of Carbohydrates Fats And Proteins
- Catabolism schematic - Biochemical diagram | Metabolism Of Fat ...
- Diagram Source Of Fat
- Area Charts | Pie Charts | Health Food | Flow Chart Diagram Of Fat ...
- Carb Protein Fat Diagram Reaction Interaction
- Health Food | Pie Charts | Cooking Recipes | Concept Map Of Fats
- Catabolism schematic - Biochemical diagram | Proteins ...
- Schematic Diagram Of The Biochemistry Of Fats
- Flow Chart For Digestion Of Fat
- Flow And Diagram Of Digestion Of Fat
- Describe Metabolic Inter Relationship Between Protein Fat And ...
- Saturated fats in the U.S. population diet | Pie Charts | Saturated fats ...
- Design elements - TCA cycle | Fat Protein Metabolism Flow Chart
- Fat Metabolism In Flow Chart
- Fat Digestion Flow Chart
- Trans Fat Citric Acid Cycle
- Design elements - Biochemistry of metabolism | Metabolism Of Fat In ...
- Metabolic pathway map - Biochemical diagram | Biology ...

.png--diagram-flowchart-example.png)
-symbols--design-elements---tca-cycle.png--diagram-flowchart-example.png)
