Line Chart Examples
The Line Graphs solution from Graphs and Charts area of ConceptDraw Solution Park contains a set of examples, templates and design elements library of line and scatter charts. Use it to draw line and scatter graphs using ConceptDraw PRO diagramming and vector drawing software for illustrating your documents, presentations and websites.HelpDesk
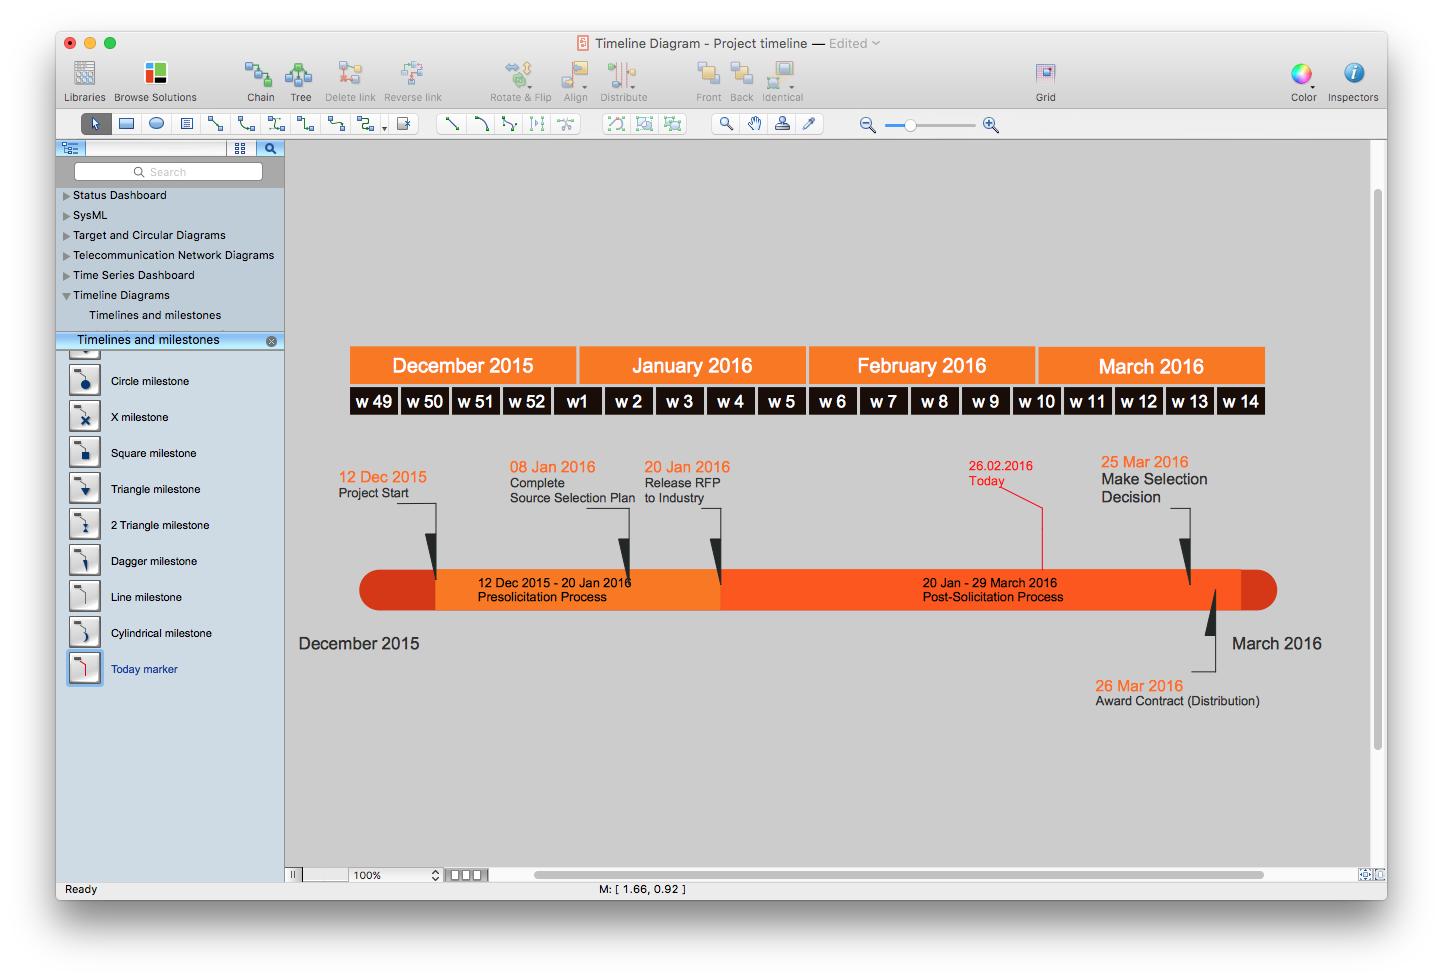
How to Create a Timeline Diagram in ConceptDraw PRO
A Timeline is a chart which displays a project plan schedule in chronological order. A Timeline is used in project management to depict project milestones and visualize project phases, and show project progress. The graphic form of a timeline makes it easy to understand critical project milestones, such as the progress of a project schedule. Timelines are particularly useful for project scheduling or project management when accompanied with a Gantt chart. It captures the main of what the project will accomplish and how it will be done. making a project timeline is one of the most important skills a project manager needs have. Making comprehensive, accurate timelines allows you getting every project off in the best way. ConceptDraw PRO allows you to draw a timeline charts using special library.
 Line Graphs
How to draw a Line Graph with ease? The Line Graphs solution extends the capabilities of ConceptDraw PRO v10 with professionally designed templates, samples, and a library of vector stencils for drawing perfect Line Graphs.
Line Graph
ConceptDraw PRO extended with Line Graphs solution from Graphs and Charts area of ConceptDraw Solution Park is ideal software for quick and simple drawing professional looking line graph.HelpDesk
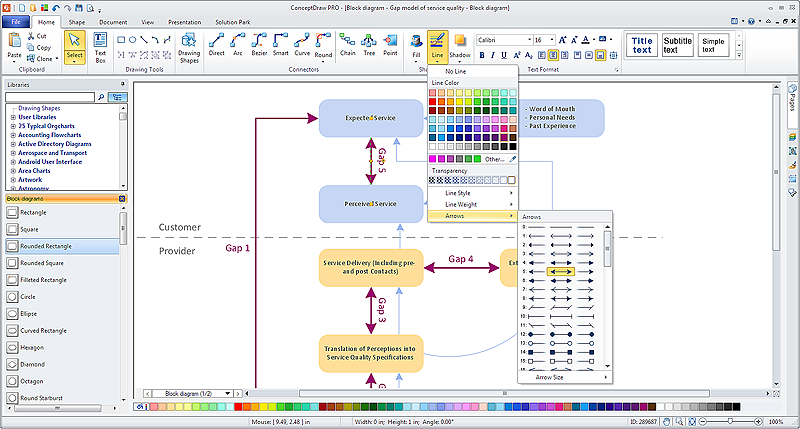
How to Connect Objects in ConceptDraw PRO on PC
ConceptDraw PRO provides a few options for drawing connections between objects: Direct Connectors,Smart, Arc, Bezier, Curve and Round Connectors. You can connect objects in your ConceptDraw diagram with proper connectors using the embedded automatic connection modes. This article describes how you can connect objects with connectors and how you can ascribe different types and behaviors.

What Is a Line Chart
What Is a Line Chart? A line chart is a basic type of chart represented by a series of data points connected with a straight line. Explaining the meaning of “What is a line chart?” is convenient to use illustrations with professional looking line charts designed in ConceptDraw PRO diagramming and vector drawing software extended with Line Graphs solution from the Graphs and Charts area.What Is a Picture Graph?
What is a Picture Graph? It's one of the most useful way which allows explain the information, statistical data in a visual form using the pictures. ConceptDraw PRO extended with Picture Graphs solution from the Graphs and Charts area offers you the easiest way of Picture Graphs drawing.- Straight Line Method Algorithm And Flowchart In Maths
- Line Flow Chart
- Line Graphs | Plumbing and Piping Plans | Process Flowchart | Line ...
- Process Flowchart | What Is a Picture Graph? | What Is a Line Chart ...
- Types Of Polygon With Diagram
- How to Draw a Line Chart Quickly | Line Graphs | Line Chart ...
- How to Create a Line Chart | Basic Flowchart Symbols and Meaning ...
- Basic Diagramming | How to Create a Line Chart | How to Draw a ...
- Organizational Charts with ConceptDraw PRO | Basic Flowchart ...
- Create Organizational Chart | How to Create a Line Chart | Basic ...
- Line Chart Examples | Line Chart Template for Word | Line Graph ...
- Process Flowchart | Pie Chart Software | Line Graph Charting ...
- Process Flowchart | Sales Flowcharts | Data Flow Diagrams (DFD ...
- Process Flowchart | Create Organizational Chart | Orgchart | Draw A ...
- How to Create a Timeline Diagram in ConceptDraw PRO | Basic ...
- Straight Line Plan Diagram
- Process Flowchart | How to Draw a Line Graph | Sample Pictorial ...
- Timeline Diagrams | How to Make a Timeline | Timeline Diagrams ...
- ConceptDraw PRO - Organizational chart software | Create ...
- ConceptDraw PRO - Organizational chart software | Create ...


