
Gane Sarson Diagram
Once you want to build some smart logical model of some system using graphical techniques to enable users, designers and well as analysts to get a clear and common picture of this system and how its parts fit together to meet the user's needs, we recommend to use Gane and Sarson method in order to create Gane and Sarson diagram. Such diagram, as many others, can be made with help of our unique and sophisticated software - ConceptDraw DIAGRAM is here for you to enable you to use any of existing templates and samples as well as numerous stencil libraries full of design elements and symbols so the final result looks very sophisticated and very professional. Download ConceptDraw DIAGRAM right now and find our Gane-Sarson notation library to start creating your great looking, smart and sophisticated diagram. In the end you can always review, modify or convert it to a variety of formats, such as image, PDF file, HTML, MS PowerPoint Presentation MS Visio or Adobe Flash, as well as print or send it by e-mail in one second.
Creando Diagramas. Connect Everything. ConceptDraw Arrows10
Amazon Web Services (AWS) diagram - SharePoint server reference architecture for public facing website scenario
Data Flow Diagram Symbols. DFD Library
Showing information transfers and processing some system’s steps, it is better to illustrate such processes on a diagram in a way of data flow one. Data flow diagram (DFD) is the one to represent the connections and relationships between users and developers. Using structured systems analysis in terms of displaying the inputs and the outputs is possible with Data Flow Diagram software called ConceptDraw DIAGRAM all together with templates and samples existing and in advance created for your use to make it easier to use our product and to let your business grow and prosper. Find over 1000 symbols we offer to create your diagram and try to review final one, modify as well as convert it to a variety of formats: PDF, HTML, Adobe Flash, MS PowerPoint Presentation, MS Visio, or print it, or send quick via e-mail. Section Solutions on this site can be very helpful to start and it will help you to get used to ConceptDraw DIAGRAM as there are many tutorials and articles as well as videos and samples.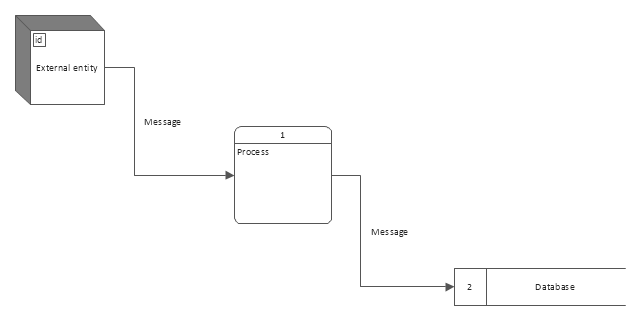
Use this template to create your data flow diagrams (DFD) by Gane - Sarson (DFD
) notation using the ConceptDraw PRO diagramming and vector drawing


SWOT Sample in Computers
Illustrating Strengths, Weaknesses, Opportunities and Threats of some business environment or business organization is always better in a way of SWOT analysis in a way of table where all the details are mentioned in order having Strengths in same column with Opportunities and Weaknesses and Threats in the same column just next to the first one the right. So having them all mentioned in four blocks next to each other having the internal and external blocks on the left side and lead to making the analysis and so the result which will lead to solutions in terms of making the company succeed. drawing SWOT Matrix is simple having ConceptDraw DIAGRAM software and for using it properly this site can be very helpful as there are so many examples, tutorials and articles as well as links to the Solutions full of design elements and templates. Download it today and make your analysis by tomorrow looking great and very professional.
Interaction Overview Diagram UML2.0. Professional UML Drawing
uml interaction overview diagram for mac

Structured Systems Analysis and Design Method (SSADM)
Structured Systems Analysis and Design Method (SSADM) was developed in the UK in the early 1980s and accepted in 1993 in order to analyze and project the information systems. Use the data flow diagrams (DFD) for describing the informational, functional and event-trigger models, the Logical Data Structure (LDS) diagrams for describing which data the system operates with and Entity Life History (ELH) diagrams for modelling events that happened in the system and find it simple to make any of these or other diagrams with help of our software. No matter what kind of flowcharts you decided to create, you can always do it using our ConceptDraw DIAGRAM product with help of Solutions sector on this site as well as STORE application which you can download to use the existing layouts from. Starting now, you’ll definitely make a better chart tomorrow, so why not to do it now, at this very moment? Once you get used to ConceptDraw DIAGRAM , you’ll find our product to be the most smart version of any existing applications and you’ll recommend it to all those who you care for to simplify their work and their lives.

Data Flow Diagram Examples
One of the best diagrams to create for a purpose of graphically representing the "flow" of a data in some information system, modelling process aspects, overviewing system as a whole, visualizing data processing or structurizing the design, it should be data flow diagram or DFD. To create one you can use a pencil and sheet of paper which may take couple of hours to finish, or you can use more progressive method which is to do it in some software, for example ConceptDraw DIAGRAM one. ConceptDraw DIAGRAM allows to create any kind of diagram as well as any kind of chart, flowchart, plan or even scheme in a very short time with help of existing stencil libraries, pre-designed in terms of making the process of drawing simpler for the new and also for the advanced users. Downloading this application today means making the first step towards your own great looking professional diagram.
Design Data Flow. DFD Library
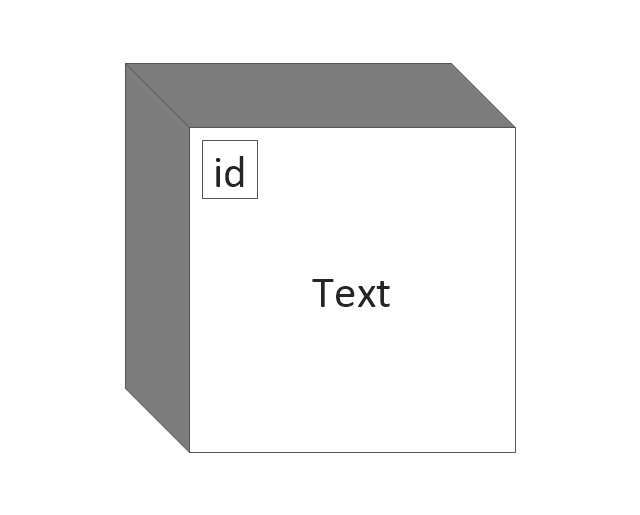
In case you want to learn how to make diagrams professionally having no previous experience in drawing them before, we can recommend you to start with making data flow diagrams and the number one advisor for you will be ConceptDraw DIAGRAM software as it allows to make any needed diagram as well as any chart, flowchart, plan or schemes in a very short time having lots of libraries with lots of design elements which can be helpful during the process of creating great looking professional diagrams. Thus, one of the libraries is Data flow diagram (DFD) which consists such design symbols as State (multi state), Start state (multi state), Stop state (multi state), External interactor, Stop state, Data store, Entity relationship, Entity, Oval process, Entity with ID and location (rounded corners), Data store (with ID), Entity (rounded corners) and Object and that is only one of so many different libraries we created in advance all for our users.
Data Flow Diagram Model
If you need to represent some data flow in some information system that can be done in many ways and one of them is drawing the data flow diagram or DFD one as it helps to track the flow itself as well as the system as a whole. Making this DFD can be simpler using profession software which is ConceptDraw DIAGRAM one and which has so many templates and samples and libraries full of design elements for illustrating the flows in a graphical way. Having our solution for making data flow diagram using numerous models can be the best option ever as any plan, scheme, flowchart and chart as well as the diagram can be created in a very short terms once you download ConceptDraw DIAGRAM. Showing the way some system is divided and becomes the one having some small parts representing each process and highlighting the data flow between all these parts is better in a way of DFD and creating DFD is better by using ConceptDraw DIAGRAM.


The vector stencils library "DFD, Gane - Sarson notation" contains 12 DFD
elements. Use it for drawing data flow diagrams (DFD) using Gane - Sarson
notation in

UML Use Case Diagram Example — Registration System
Registration System UML Use Case Diagram
- Gane Sarson Diagram | DFD, Gane - Sarson notation - Template ...
- Gane Sarson Diagram | Structured Systems Analysis and Design ...
- Entity-Relationship Diagram (ERD) | Gane Sarson Diagram | Circle ...
- Gane Sarson Diagram | Data Flow Diagram Symbols. DFD Library ...
- DFD, Gane - Sarson notation - Vector stencils library | Gane Sarson ...
- Gane Sarson Diagram | Online Flow Chart | Property Management ...
- Gane Sarson Diagram | Basic Flowchart Symbols and Meaning ...
- Gane Sarson Diagram | Describe Gene And Sarson Symbols
- DFD, Gane - Sarson notation - Vector stencils library | Diagram Of ...
- DFD, Gane - Sarson notation - Vector stencils library | DFD, Gane ...
- Gane Sarson Diagram | Yed Flowchart Tutorial
- Gane Sarson Diagram | eLearning for Skype | Explain About Gene ...
- Program to Make Flow Chart | Gane Sarson Diagram | Scrum ...
- Data Flow Diagrams (DFD) | Process Oriented Design By Gane ...
- Gane Sarson Diagram | Types of Flowcharts | Describe The Gane ...
- DFD, Gane - Sarson notation - Template
- Gane Sarson Diagram | Hiring process workflow | Swim Lane ...
- SWOT Sample in Computers | Gane Sarson Diagram | Diagramming ...
- Gane Sarson Diagram | Data Flow Diagram | Program Evaluation ...
- Gane Sarson Diagram | Seven Basic Tools of Quality — Quality ...