HelpDesk
Create a Matrix Organizational Chart . ConceptDraw HelpDesk
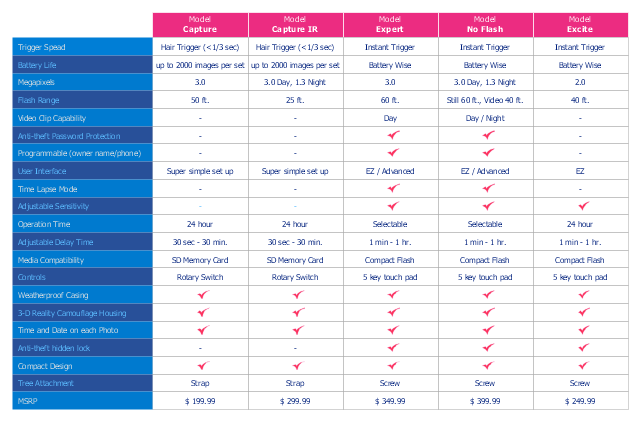
There are a number of moments which are influenced by how the organizational structure of a certain business needs to be, how complex, and which type itCompetitive Feature Comparison Matrix is a tool to compare the features and functionality of competitive products or services in side-by-side table.
HelpDesk
Creating Prioritization Matrix . ConceptDraw HelpDesk
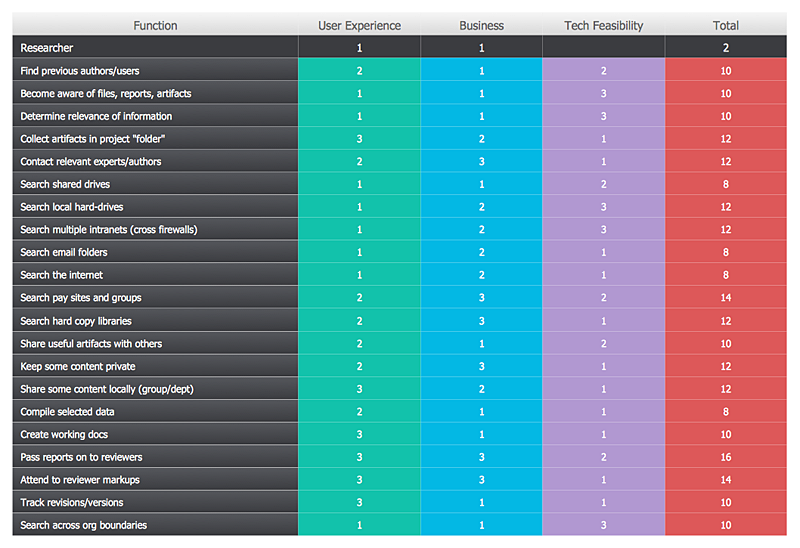
Making the prioritization matrix is helpful when all cannot be done at the same time. Prioritization matrix diagram shows the relationships between factorsHelpDesk
Creating Ansoff Matrix Template . ConceptDraw HelpDesk
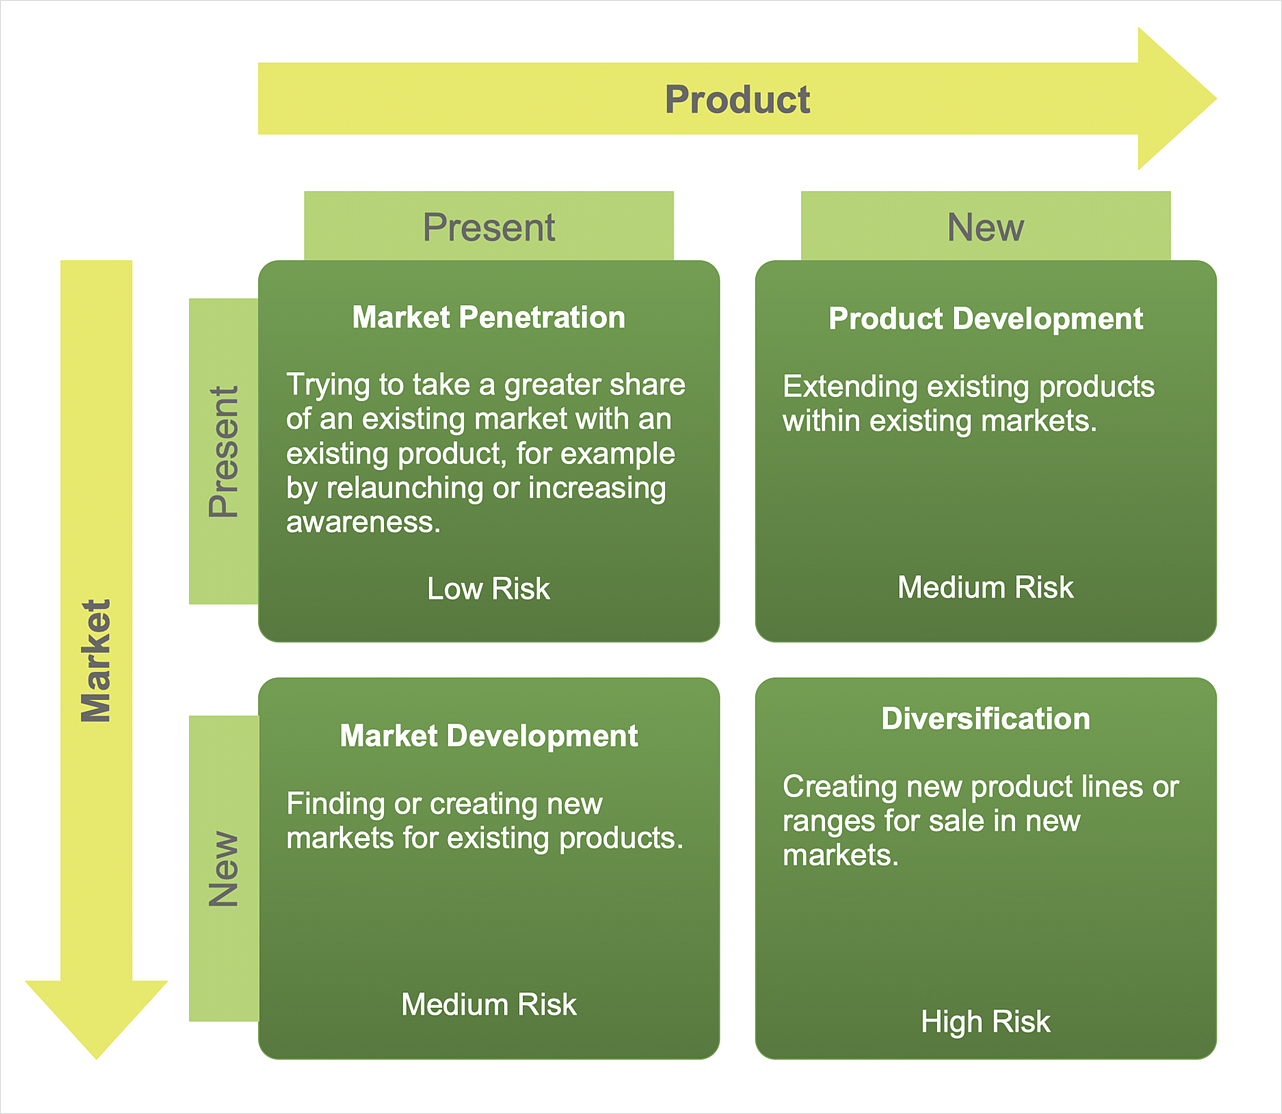
Ansoff Matrix is a marketing planning tool that helps a business determine its product and market growth strategy.This SWOT analysis matrix template helps you in positioning of SWOT factors as bubbles on bubble chart by size/scale (X axis) and relevance/importance (Y axis).
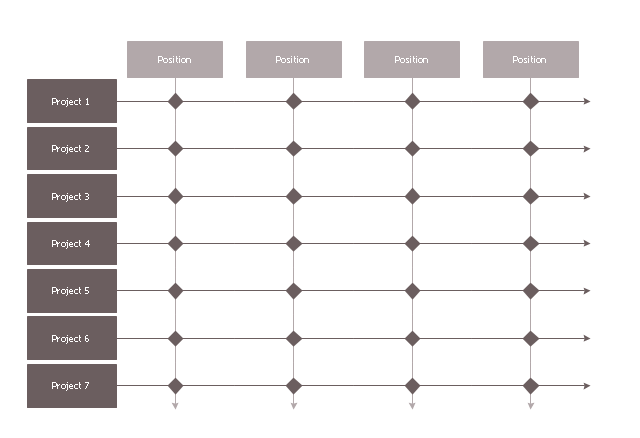
"Employees in a matrix organization report on day-to-day performance to the project or product manager whose authority flows sideways (horizontally) across
 Matrices Solution. ConceptDraw.com
This solution extends ConceptDraw DIAGRAM with samples, templates and a library of design elements for drawing business matrix diagrams.
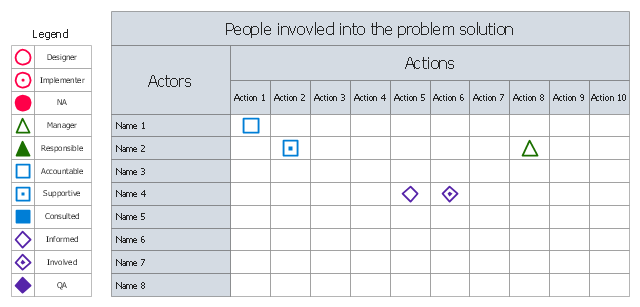
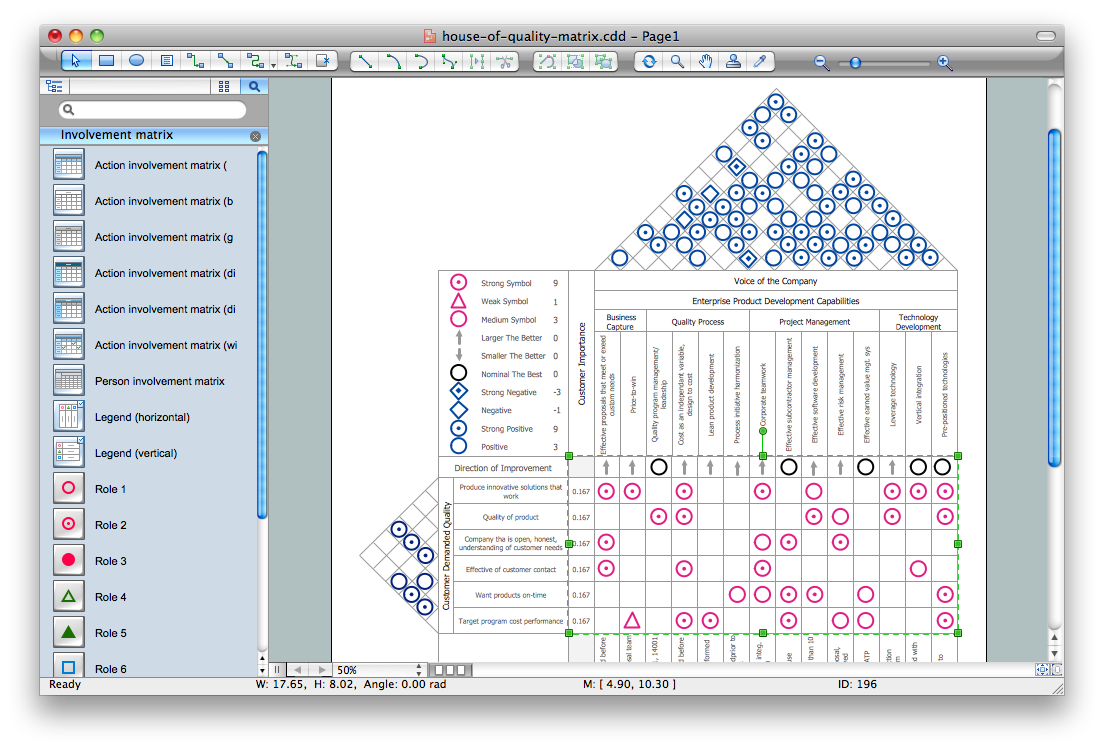
The involvement matrix (responsibility assignment matrix , RAM, RACI matrix , ARCI matrix , linear responsibility chart , LRC) defines the level of involvement and
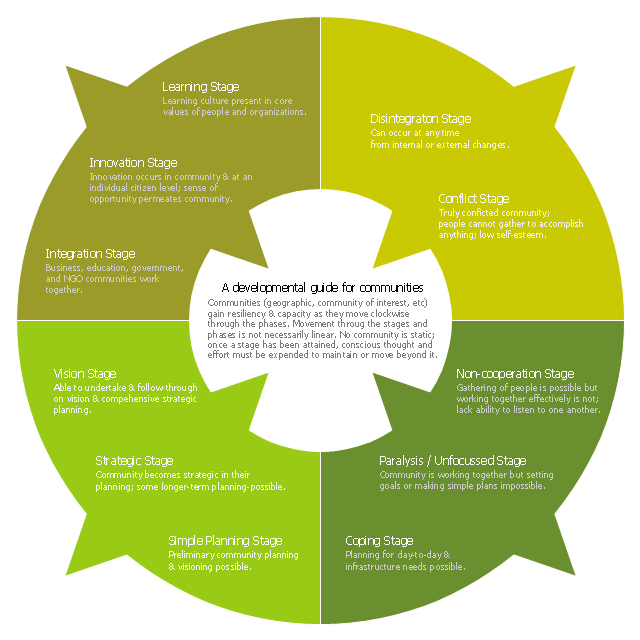
This ring chart sample was created on the base of the figure illustrating the "CCP Handbook - Comprehensive Community Planning for First Nations in British
What is SWOT Analysis?
What is SWOT analysis? The answer seems to be obvious to those who learnt economics at school, university or those, who work in this field of activity providing good service of analyzing the existing businesses, companies, etc. Shortly, SWOT matrix represents strengths (a company's strengths are its resources and capabilities that can be used as a basis for developing a competitive advantage), weaknesses (the absence of certain strengths may be viewed as a weakness), opportunities (the external environmental analysis may reveal certain new opportunities for profit and growth) and threats (changes in the external environmental also may present threats to the company). But once you never had a chance to get to know about it before, ConceptDraw DIAGRAM can help you to create the SWOT matrix in a short terms without you even know how to start and what to do first as we provide our clients with support in a way of offering lots of different stencil libraries of design elements and, of course, numerous templates of already created SWOT matrix, which is being provided by the SWOT analysis solution.This puzzle piece diagram sample shows alternating sign matrix . It was designed on the base of the Wikimedia Commons file: Matrice signes alternants 4x4.svg
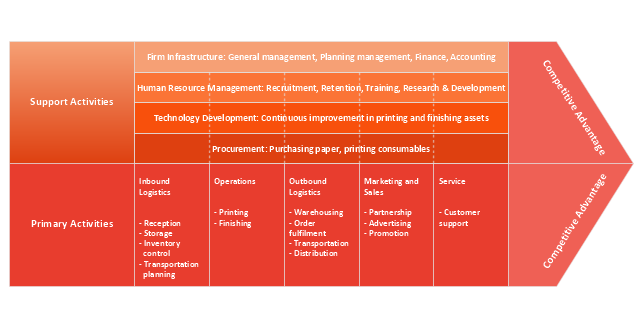
"A value chain is a chain of activities that a firm operating in a specific industry performs in order to deliver a valuable product or service for the
SWOT Matrix Template
SWOT analysis (or SWOT Matrix) is a professional method used to estimate the Strengths, Weaknesses, Opportunities and Threats of any project, business venture, product, place, industry or person. Very useful tool for comparing the factors that can help some, for example, company to become globally recognized and for its leaders to make sure all they do is right and they are heading in the right direction, and SWOT matrix can be created in ConceptDraw DIAGRAM software within a minute if you use our templates and examples of already pre-designed samples of such analysis in order to help its users to make whatever they need in a very short time and the final result to look smart and professional. Download ConceptDraw DIAGRAM today and use it as the unique tool for creating not only SWOT matrix, but other great looking plans, charts, flowcharts, schemes and diagrams. Use the best application for drawing sophisticated charts and so to progress.Swot Analysis Examples for Mac OSX
Having already pre-designed examples as having already made in advance templates is always useful in terms of creating your own plans or schemes as well as charts, flowcharts, diagrams. Having ConceptDraw DIAGRAM software means having all necessary tools for drawing all mentioned above and more, such as, for example, SWOT analysis for analyzing Strengths, Weaknesses, Opportunities as well as Threats of some business process or some company, or structure, or business activity as a whole. We provide our clients with numerous examples for creating their own SWOT matrix on Mac or Windows. That allows you to be able to draw anything you want with help of stencil libraries as well as samples and templates previously created by our designers and IT specialists. Download ConceptDraw DIAGRAM today and compare it to any other application to find out how unique and smart it is for making sophisticated charts, flowcharts and schemes, diagrams and plans.This SWOT analysis matrix template helps you in positioning of SWOT factors as bubbles on bubble chart by size/scale (X axis) and relevance/importance (Y
- Functional Organizational Structure | Organizational Chart | How to ...
- Matrix Organization Structure | Pyramid Diagram and Pyramid Chart
- How to Draw a Matrix Organizational Chart | 25 Typical Orgcharts ...
- Flowchart Definition | Deployment Chart Software | Matrix Flow Chart
- 25 Typical Orgcharts | SWOT Matrix Template | How to Draw a Matrix ...
- Feature Comparison Chart Software | Marketing | Competitor ...
- How to Draw a Matrix Organizational Chart with ConceptDraw PRO ...
- Quality function deployment chart - Template | QFD matrix ...
- SWOT analysis matrix diagram - Instructional sample | SWOT ...
- Porter's generic strategies matrix diagram | Block diagram - Porter's ...

