Samples / Statistical Charts / Sample Bar Graphs
Sample Bar Graphs
Samples of bar and column charts are created using ConceptDraw DIAGRAM diagramming and vector drawing software and the Bar Charts solution.
ConceptDraw DIAGRAM provides export of vector graphic multipage documents into multiple file formats: vector graphics (SVG, EMF, EPS), bitmap graphics (PNG, JPEG, GIF, BMP, TIFF), web documents (HTML, PDF), PowerPoint presentations (PPT), Adobe Flash (SWF).
Tutorials and Solutions:
Video Tutorials: ConceptDraw Solution Park
Solutions: Bar Graphs for ConceptDraw DIAGRAM
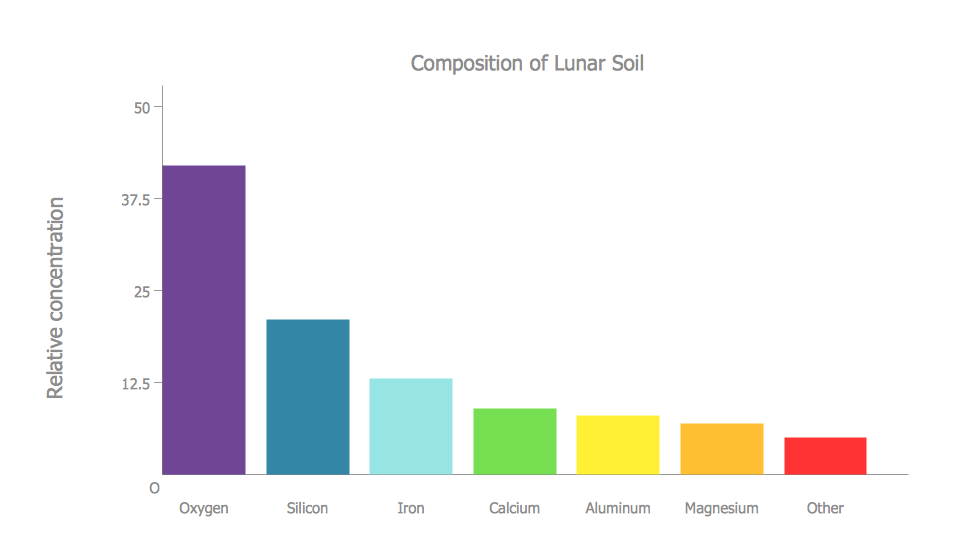
Sample 1: Composition of Lunar Soil
Bar Graph sample: Composition of lunar soil.
This example is created using ConceptDraw DIAGRAM diagramming software enhanced with
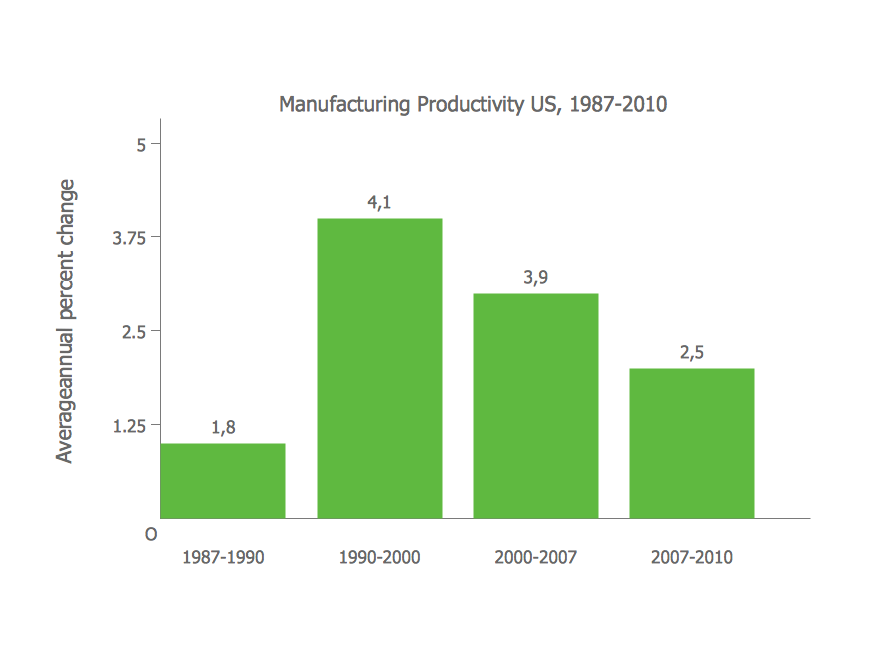
Sample 2: Manufacturing Productivity
Bar Graph sample: Manufacturing productivity.
This example is created using ConceptDraw DIAGRAM diagramming software enhanced with
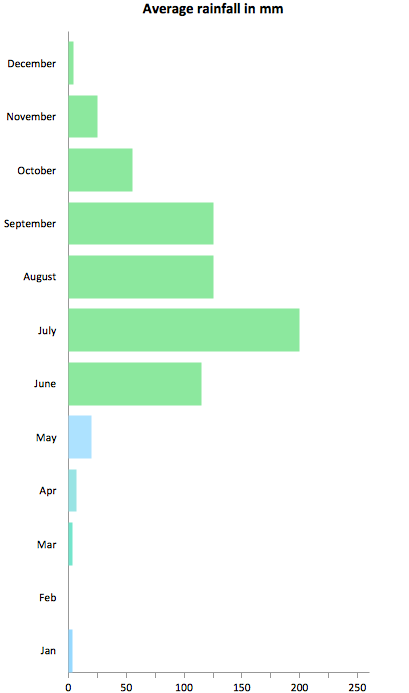
Sample 3: Average Rainfall
Bar Graph sample: Average rainfall.
This example is created using ConceptDraw DIAGRAM diagramming software enhanced with
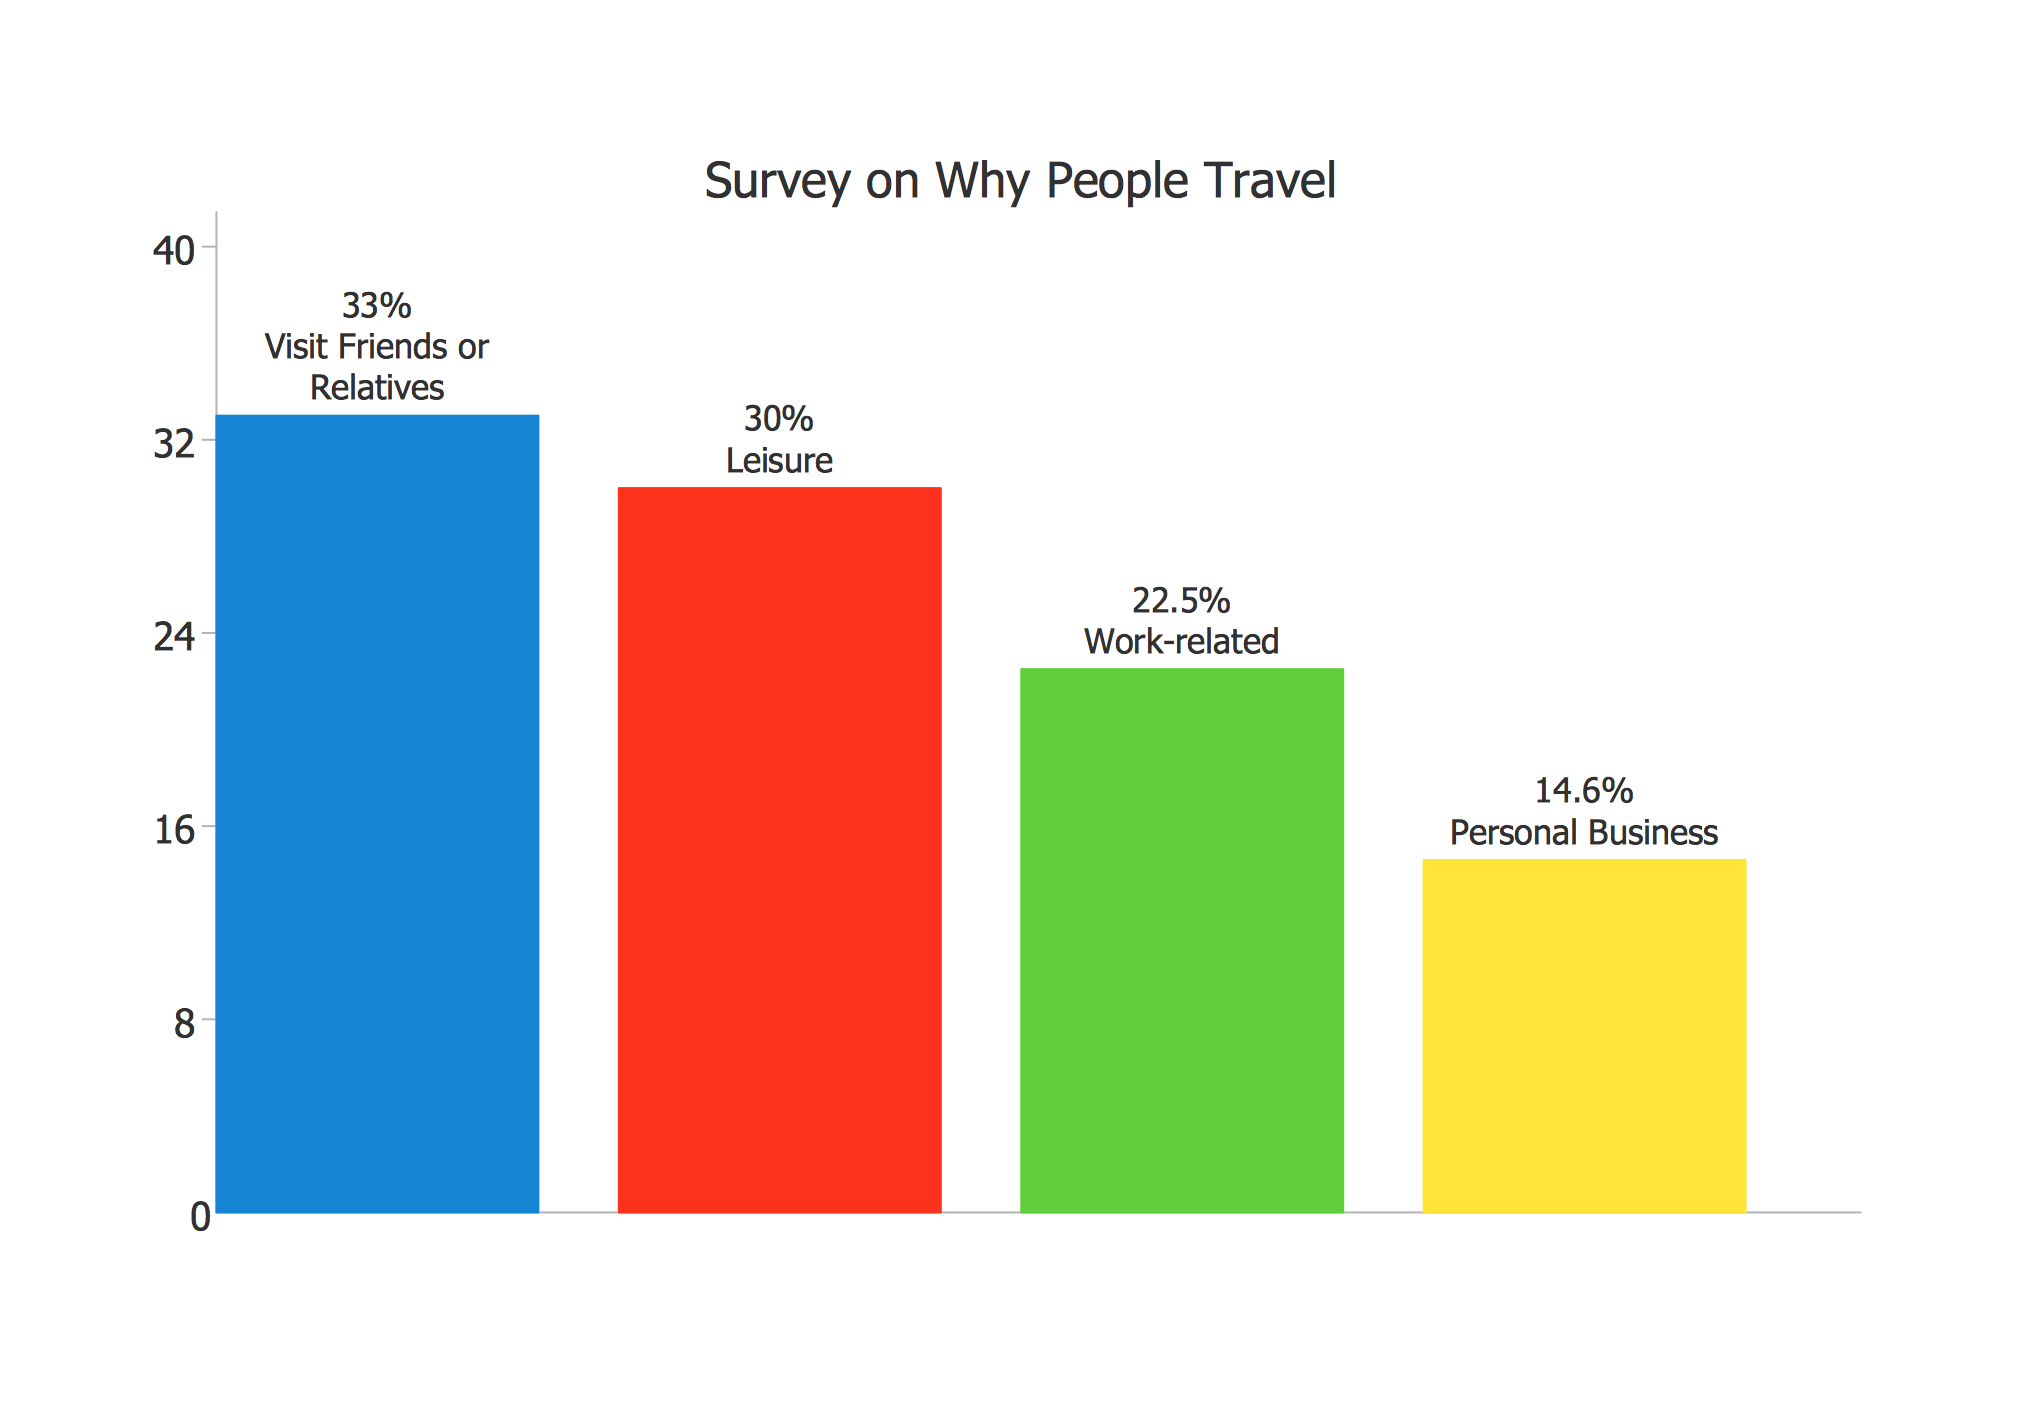
Sample 4: Survey on Why People Travel
Bar Graph sample: Survey on why people travel.
This example is created using ConceptDraw DIAGRAM diagramming software enhanced with
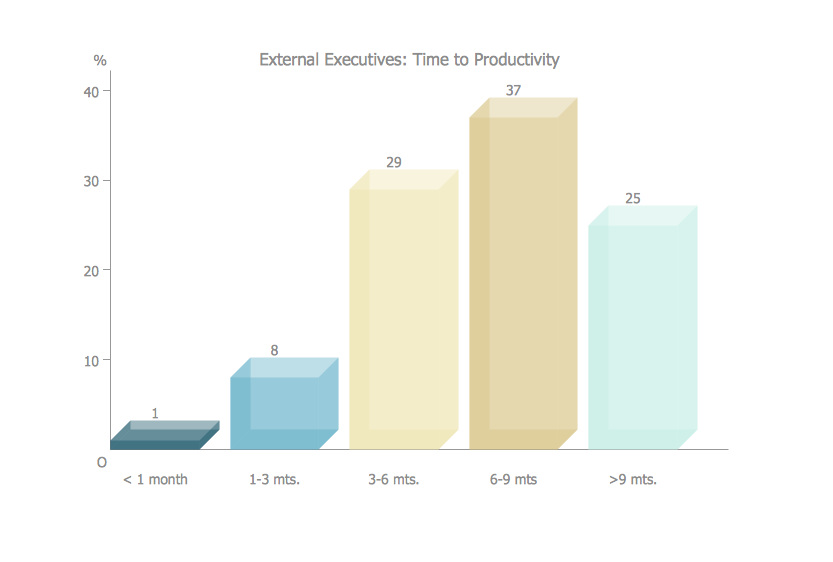
Sample 5: Times to Productivity
Bar Graph sample: Times to productivity.
This example is created using ConceptDraw DIAGRAM diagramming software enhanced with
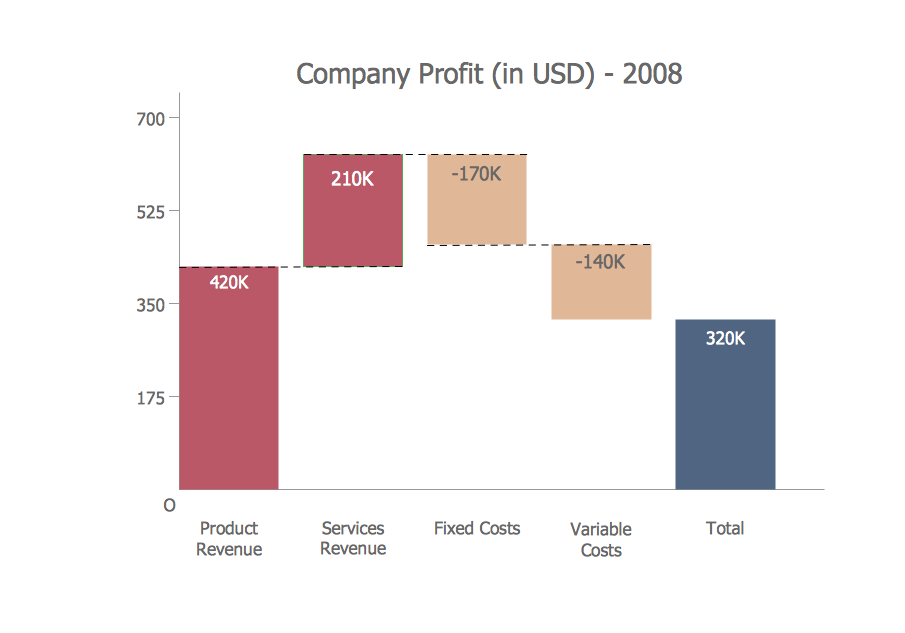
Sample 6: Waterfall
Bar Graph sample: Waterfall.
This example is created using ConceptDraw DIAGRAM diagramming software enhanced with
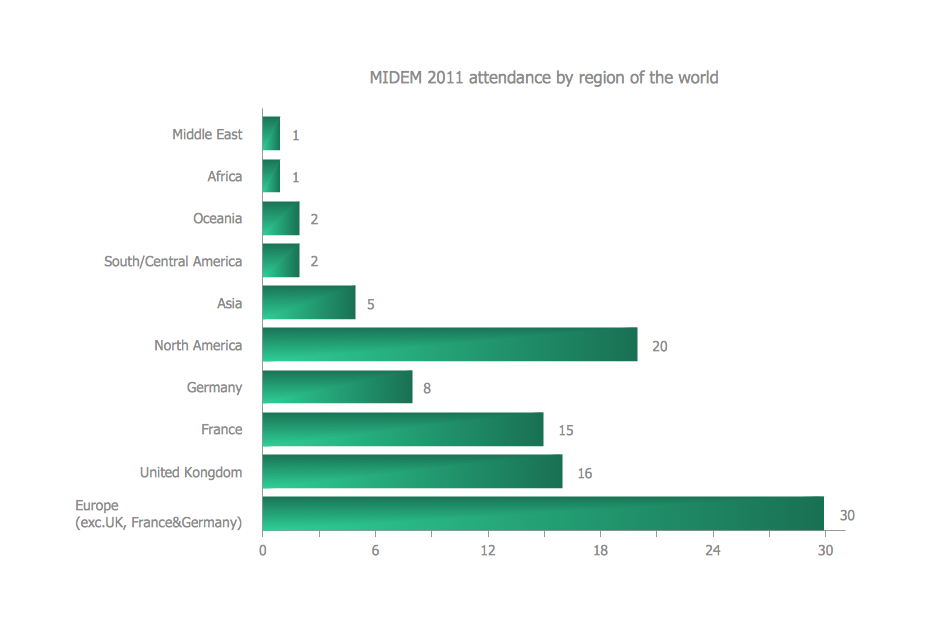
Sample 7: MIDEM-2011 Attendance by Region of the World
Bar Graph sample: MIDEM-2011 attendance by region of the world.
This example is created using ConceptDraw DIAGRAM diagramming software enhanced with
Sample 8: Changes in Price Indices
Bar Graph sample: Changes in price indices.
This example is created using ConceptDraw DIAGRAM diagramming software enhanced with

Sample 9: Global Competitiveness Index Infrastructure Score
Bar Graph sample: Global competitiveness index infrastructure score.
This example is created using ConceptDraw DIAGRAM diagramming software enhanced with

Sample 10: The Most Spoken Languages of the World
Bar Graph sample: The most spoken languages of the world.
This example is created using ConceptDraw DIAGRAM diagramming software enhanced with

Sample 11: Average Trip Length Among U.S. Children
Bar Graph sample: Average trip length among U.S. children.
This example is created using ConceptDraw DIAGRAM diagramming software enhanced with

Sample 12: EPIET Fellows by Country of Origin
Bar Graph sample: EPIET fellows by country of origin.
This example is created using ConceptDraw DIAGRAM diagramming software enhanced with

Sample 13: Amino Acid Composition of Complete UniProt Database
Bar Graph sample: Amino acid composition of complete UniProt database.
This example is created using ConceptDraw DIAGRAM diagramming software enhanced with

Sample 14: Iran Internet Users per 100 Person
Bar Graph sample: Iran internet users per 100 person.
This example is created using ConceptDraw DIAGRAM diagramming software enhanced with

Sample 15: Median Income by Age and Marital Status
Bar Graph sample: Median income by age and marital status.
This example is created using ConceptDraw DIAGRAM diagramming software enhanced with

Sample 16: Nitrate Concentration in Community Water Systems (CWS)
Bar Graph sample: Nitrate concentration in Community Water Systems (CWS).
This example is created using ConceptDraw DIAGRAM diagramming software enhanced with

Sample 17: Number of Members in the CNT between 1911 and 1937
Bar Graph sample: Number of members in the CNT between 1911 and 1937.
This example is created using ConceptDraw DIAGRAM diagramming software enhanced with

Sample 18: Percentage of U.S. High School Students
Bar Graph sample: Percentage of U.S. high school students.
This example is created using ConceptDraw DIAGRAM diagramming software enhanced with

Sample 19: Percentage with Various Levels of Family Income
Bar Graph sample: Percentage with various levels of family income.
This example is created using ConceptDraw DIAGRAM diagramming software enhanced with

Sample 20: Serious Crime in Cincinnati
Bar Graph sample: Serious crime in Cincinnati.
This example is created using ConceptDraw DIAGRAM diagramming software enhanced with

All samples are copyrighted CS Odessa's.
Usage of them is covered by Creative Commons “Attribution Non-Commercial No Derivatives” License.
The text you can find at: https://creativecommons.org/licenses/by-nc-nd/3.0