Samples / Statistical Charts / Pie Charts
Pie Charts
Samples of pie and donut charts are created using ConceptDraw DIAGRAM diagramming and vector drawing software and the Pie Charts solution.
ConceptDraw DIAGRAM provides export of vector graphic multipage documents into multiple file formats: vector graphics (SVG, EMF, EPS), bitmap graphics (PNG, JPEG, GIF, BMP, TIFF), web documents (HTML, PDF), PowerPoint presentations (PPT), Adobe Flash (SWF).
Tutorials and Solutions:
Video Tutorials: ConceptDraw Solution Park
Solutions: Pie Charts for ConceptDraw DIAGRAM
Sample 1: Approximate Composition of the Air
Pie Charts sample: Approximate composition of the air.
This example is created using ConceptDraw DIAGRAM diagramming software enhanced with

Sample 2: 2008 Autogas Consumption
Pie Charts sample: 2008 autogas consumption.
This example is created using ConceptDraw DIAGRAM diagramming software enhanced with

Sample 3: 2007 Uranium
Pie Charts sample: 2007 Uranium.
This example is created using ConceptDraw DIAGRAM diagramming software enhanced with

Sample 4: Business Report
Pie Charts sample: Business report.
This example is created using ConceptDraw DIAGRAM diagramming software enhanced with
Sample 5: Budgeted Appropriations
Pie Charts sample: Budgeted appropriations.
This example is created using ConceptDraw DIAGRAM diagramming software enhanced with

Sample 6: DA Determinations
Pie Charts sample: DA determinations.
This example is created using ConceptDraw DIAGRAM diagramming software enhanced with

Sample 7: European Parliament Elections
Pie Charts sample: European parliament elections.
This example is created using ConceptDraw DIAGRAM diagramming software enhanced with

Sample 8: Sector Weightings
Pie Charts sample: Sector weightings.
This example is created using ConceptDraw DIAGRAM diagramming software enhanced with

Sample 9: English Dialects
Pie Charts sample: English Dialects.
This example is created using ConceptDraw DIAGRAM diagramming software enhanced with

Sample 10: Europe Browser Usage Share
Pie Charts sample: Europe Browser Usage Share.
This example is created using ConceptDraw DIAGRAM diagramming software enhanced with

Sample 11: General Fund Disbursements
Pie Charts sample: General Fund Disbursements.
This example is created using ConceptDraw DIAGRAM diagramming software enhanced with

Sample 12: Income and Outlays
Pie Charts sample: Income and Outlays.
This example is created using ConceptDraw DIAGRAM diagramming software enhanced with

Sample 13: Major Categories of Federal Spending
Pie Charts sample: Major Categories of Federal Spending.
This example is created using ConceptDraw DIAGRAM diagramming software enhanced with

Sample 14: OLAB Fiscal Year
Pie Charts sample: OLAB Fiscal Year.
This example is created using ConceptDraw DIAGRAM diagramming software enhanced with

Sample 15: Percentage of EU Farm Land by Country
Pie Charts sample: Percentage of EU Farm Land by Country.
This example is created using ConceptDraw DIAGRAM diagramming software enhanced with

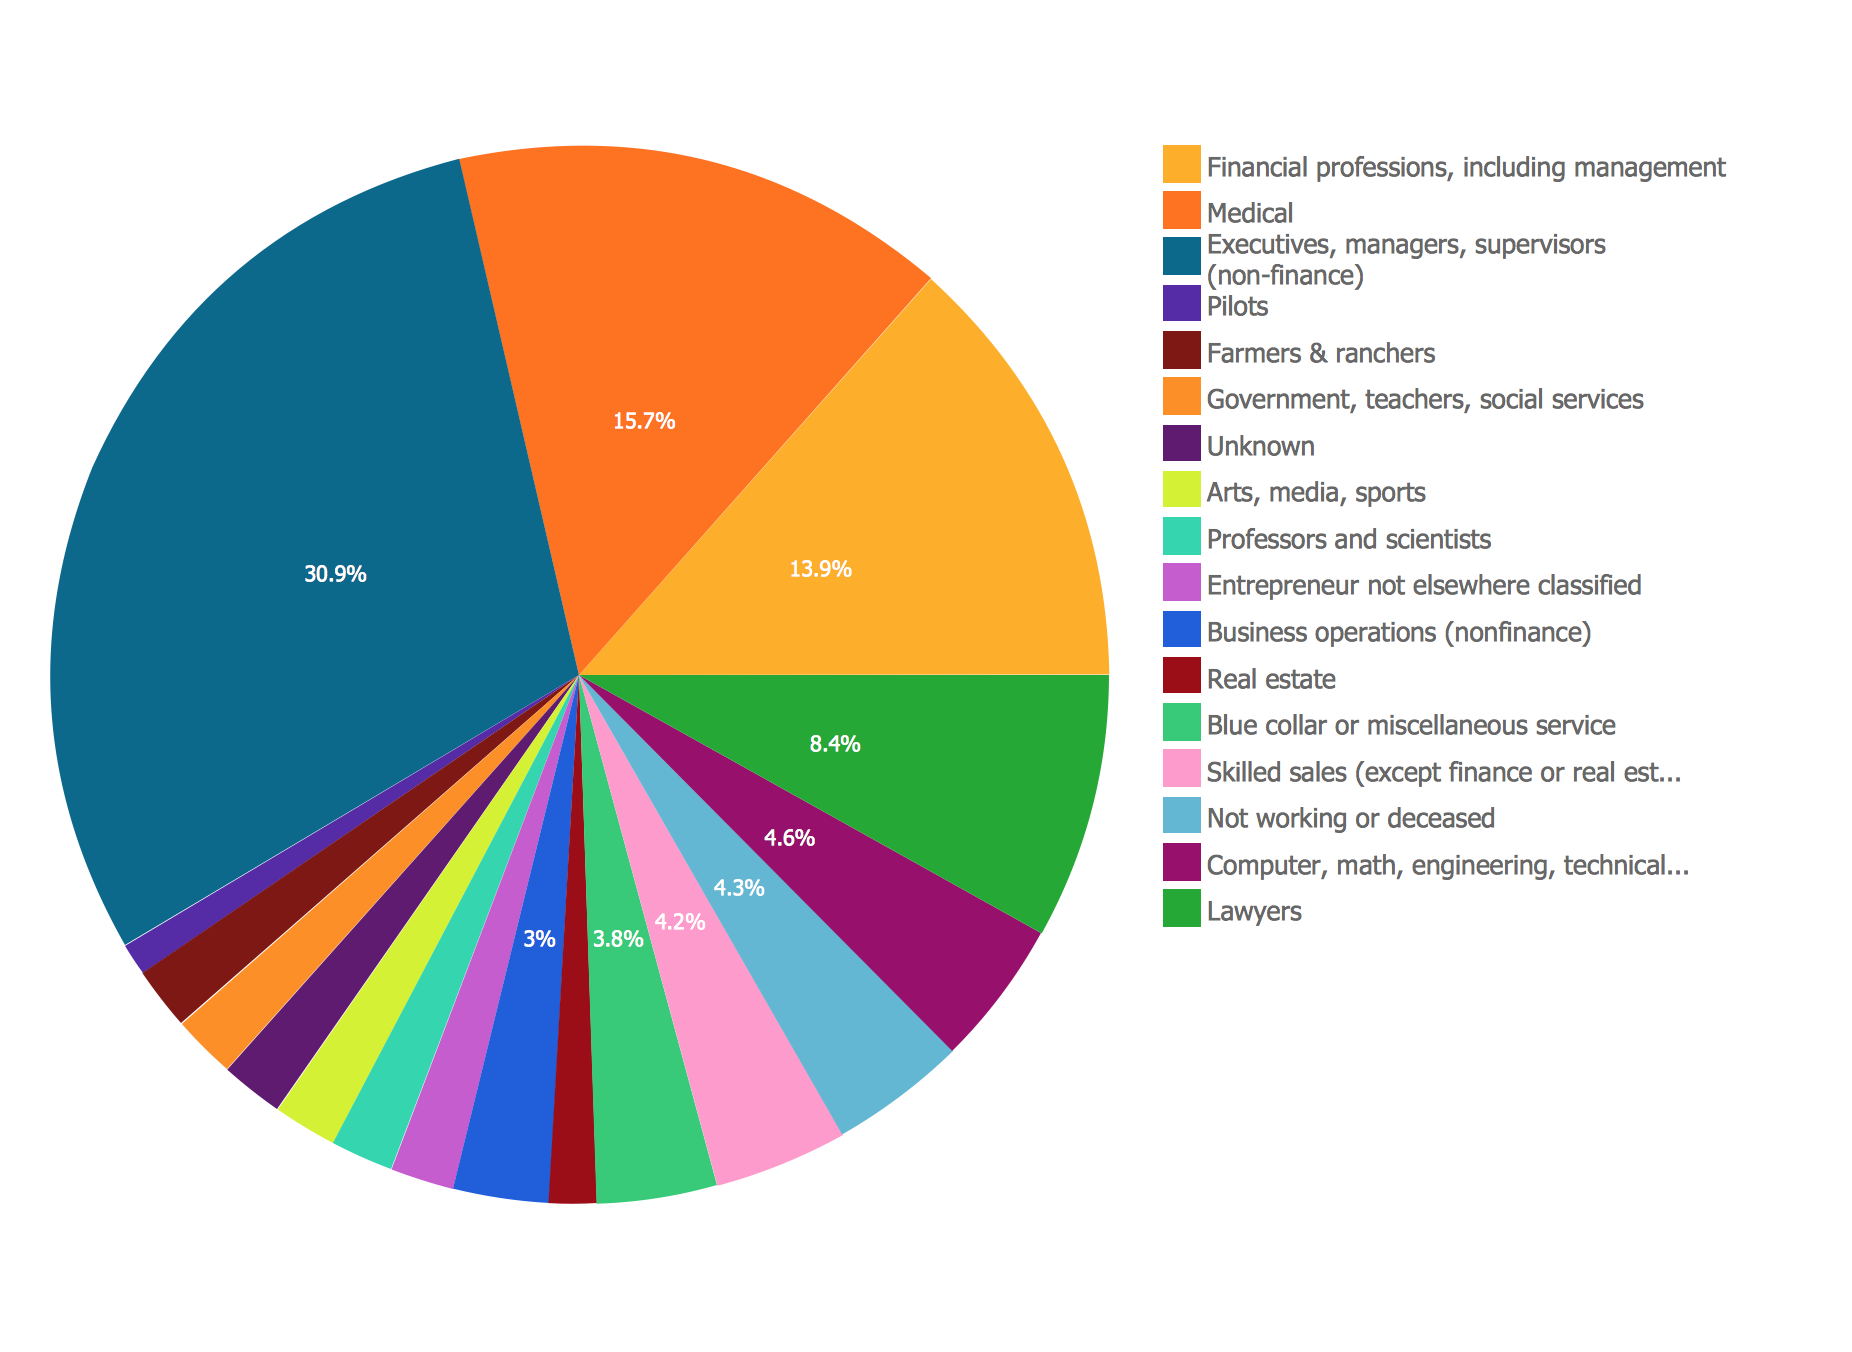
Sample 16: Percentage of the Top 1% Wage Earners in the US by Occupation
Pie Charts sample: Percentage of the Top 1% Wage Earners in the US by Occupation.
This example is created using ConceptDraw DIAGRAM diagramming software enhanced with

Sample 17: Percentages of the U.S. Population by Race
Pie Charts sample: Percentages of the U.S. Population by Race.
This example is created using ConceptDraw DIAGRAM diagramming software enhanced with

Sample 18: Renewable Energy
Pie Charts sample: Renewable Energy.
This example is created using ConceptDraw DIAGRAM diagramming software enhanced with

Sample 19: Saturated Fats in The U.S. Population Diet
Pie Charts sample: Saturated Fats in The U.S. Population Diet.
This example is created using ConceptDraw DIAGRAM diagramming software enhanced with

Sample 20: State and Local Revenue and Expenditures
Pie Charts sample: State and Local Revenue and Expenditures.
This example is created using ConceptDraw DIAGRAM diagramming software enhanced with

Sample 21: State Operating Funds
Pie Charts sample: State Operating Funds.
This example is created using ConceptDraw DIAGRAM diagramming software enhanced with

All samples are copyrighted CS Odessa's.
Usage of them is covered by Creative Commons “Attribution Non-Commercial No Derivatives” License.
The text you can find at: https://creativecommons.org/licenses/by-nc-nd/3.0