Baseball Diagram – Basic Bunt Coverage – Runner at 1st
"It’s less common for a team to sacrifice with only a runner on first base, but you will see it occasionally (especially with a weak hitter at the plate). In this scenario, the offense is trying to move the runner into scoring position, and the batter will most likely try to bunt towards first base. The first baseman holds the runner at first base so he cannot extend his lead; this allows for the possibility (however slim) of making a force play at second base." [iSport Baseball]
ConceptDraw DIAGRAM software extended with the Baseball solution delivers samples with diagrams of the most popular plays in baseball. You can complete this set modifying any sample. All you need is to drag and drop objects to depict another play and then save with the different name. Feel free to add text label with the play name directly to your document.
A combination of the "Baseball Fields" and "Baseball Positions" libraries gives you an ability to create a baseball-related drawing in seconds. Follow next steps to create you own baseball schema:
- From the "Baseball Fields" library drop a field object to your document
- From the "Baseball Positions" library drop all positions object you need to your document
- Place positions on the field according to your drawing idea
- Add arrows or text labels if needed.
All drawings, schemas and diagrams created in ConceptDraw DIAGRAM are scalable vector graphics that allows use it for any kind of presentation needs. As a perfect tool for explaining baseball rules and strategies you can present using two displays. The first display is for moving objects, the second one is full-screen presentation. This trick strengthens you explanation with dynamic visual range.

Sample 1. Baseball Diagram – Basic Bunt Coverage – Runner at 1st.
This diagram was created in ConceptDraw DIAGRAM using the "Baseball Positions" library from the Baseball Solution. An experienced user spent 10 minutes creating this sample.
It demonstrates a portion of the solution's capabilities and the professional results you can achieve.
All source documents are vector graphic documents. They are available for reviewing, modifying, or converting to a variety of formats (PDF file, MS PowerPoint, MS Visio, and many other graphic formats) from the ConceptDraw STORE. The Baseball Solution is available for all ConceptDraw DIAGRAM or later users.
TEN RELATED HOW TO's:
ConceptDraw DIAGRAM creates drawings, flowcharts, block diagrams, bar charts, histograms, pie charts, divided bar diagrams, line graphs, area charts, scatter plots, circular arrows diagrams, Venn diagrams, bubble diagrams with great visual appeal on Mac OS X.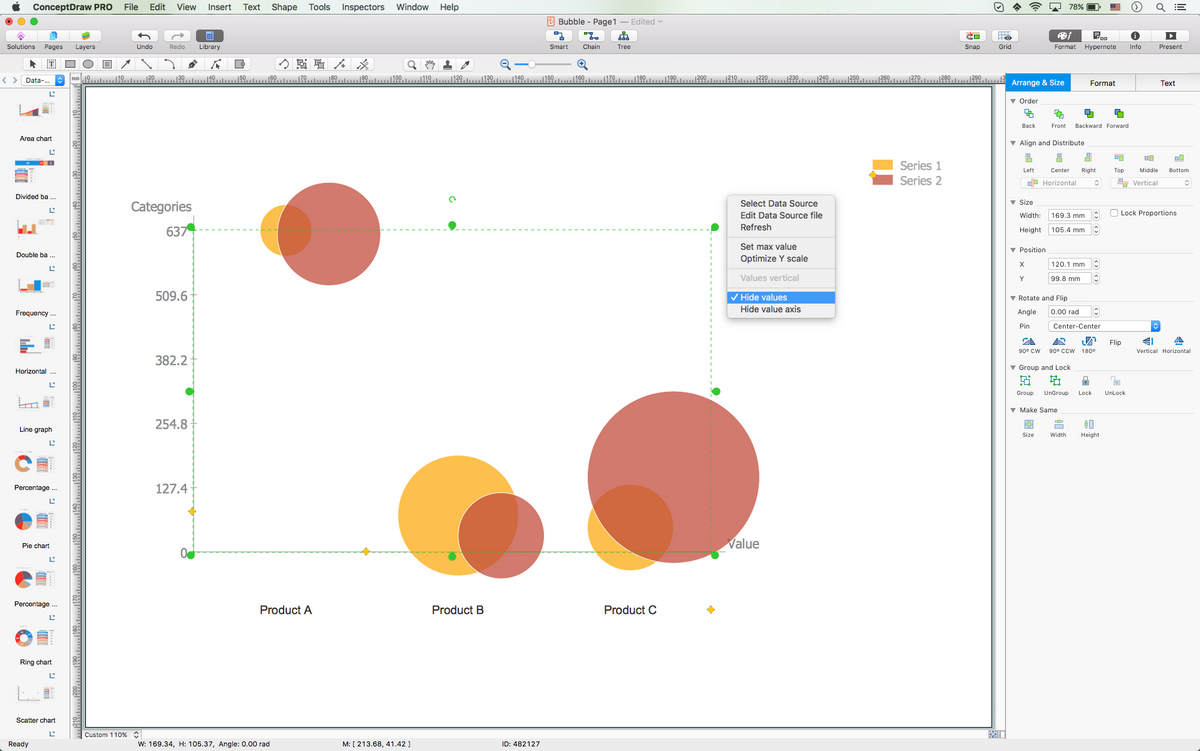
Picture: Best Diagramming Software for macOS
Related Solution:
A triangular graphic representing Graham's hierarchy of disagreement, based on Paul Graham's March 2008 essay How to Disagree.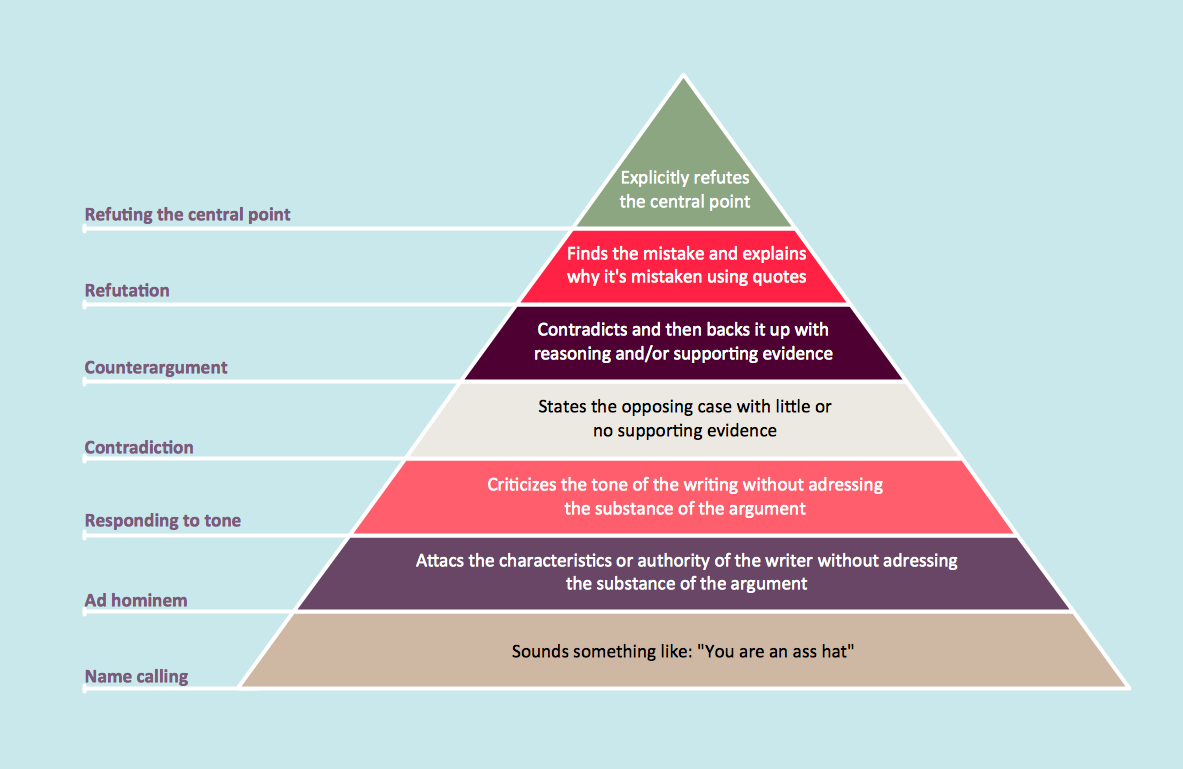
Picture: Pyramid Diagram
Related Solutions:
It’s very important that your basketball illustrations looked bright, beautiful, interesting and attracted the attention. For this you just need to add the illustrations! The Basketball solution delivers two libraries with predesigned vector clipart objects. Simply drag the needed clipart to your diagram to make it successful.
Picture: Basketball Illustrations
Related Solution:
Using diagrams is the easiest way to explain American Football defensive formations. The Football solution for ConceptDraw DIAGRAM contains a set of samples depicts the most popular defensive formations diagrams. Using embedded presentation tools you are able to share your football knowledge with wide audience.
Picture: Defensive Formation – 4-3 Defense Diagram
Related Solution:
This sample was created in ConceptDraw DIAGRAM diagramming and vector drawing software using the Computer and Networks solution from Computer and Networks area of ConceptDraw Solution Park.
A Daisy Chain is the simple computer network. It is the easiest way to add more Ethernet devices into the network. In the Daisy Chain network one computer is connected to the next without any intervening devices, thus the message is sent from one computer to the next and then to the next and so on. A Daisy Chain can be linear or ring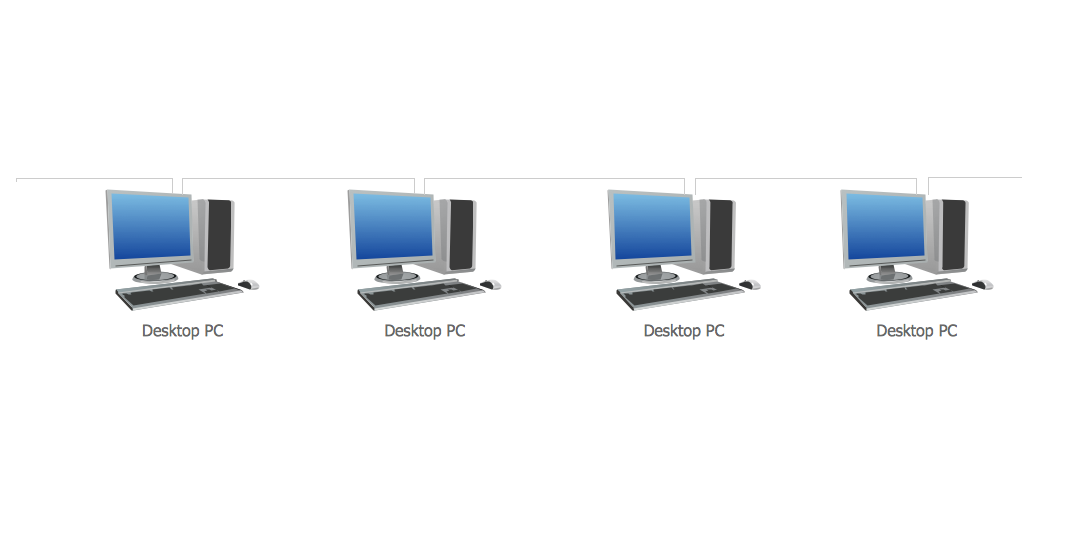
Picture: Daisy Chain Network Topology
Related Solution:
ConceptDraw DIAGRAM software extended with the Baseball solution delivers libraries, templates and samples allowing baseball fans or specialists to draw baseball-related schemas in minutes.
Picture: Colored Baseball Field Diagram
Related Solution:
Is it possible to develop a diagram as quickly as the ideas come to you? The innovative ConceptDraw Arrows10 Technology included in ConceptDraw DIAGRAM is a powerful drawing tool that changes the way diagrams are produced.
While making the drawing process easier and faster.
Picture: How to draw a Cross-Functional Flowchart
Related Solution:
The Soccer solution from the Sport area of ConceptDraw Solution Park is designed as a tool that helps produce soccer illustrations of any complexity in minutes. You can quick and easy design the professional looking plan of the soccer field with set up dimensions.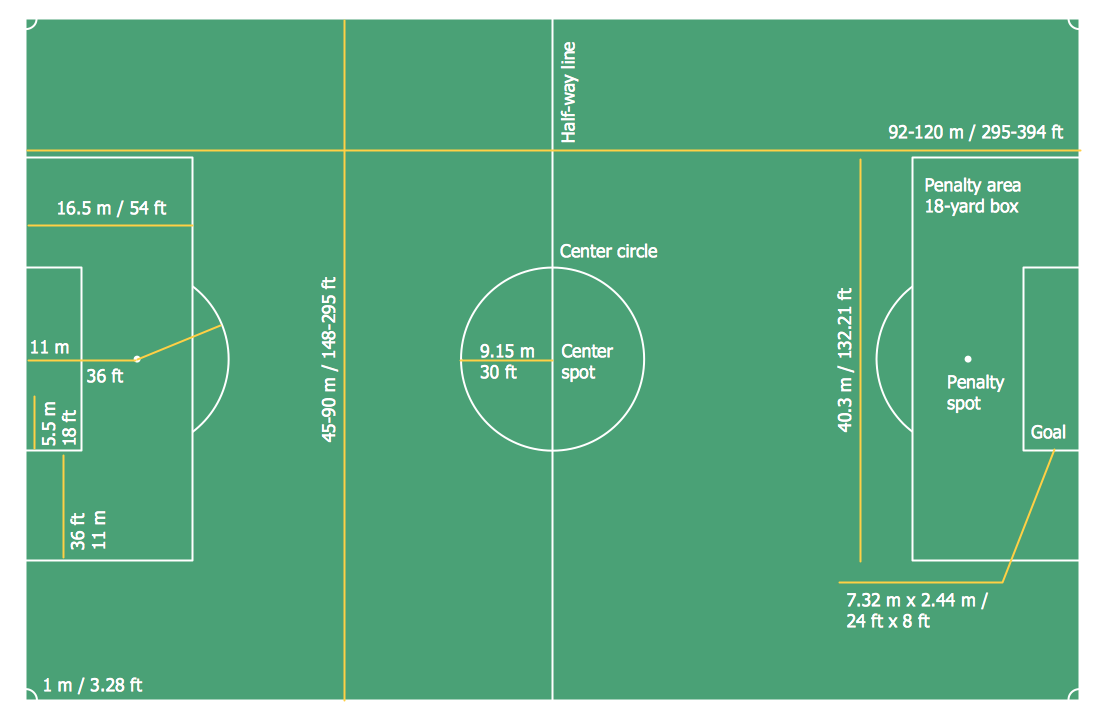
Picture: Soccer (Football) Dimensions
Related Solution:
A flowchart is a powerful tool for examining processes. It helps improving processes a lot, as it becomes much easier to communicate between involved people, to identify potential problems and to optimize workflow. There are flowcharts of different shapes, sizes and types of flowchart vary from quite basic process flowcharts to complex program flowcharts. Nevertheless, all these diagrams use the same set of special symbols like arrows to connect blocks, parallelogram to show data receiving or rectangles for showing process steps.
Basic flowcharts are used to represent a simple process algorithm. A basic flowchart notation consists of rectangles (business processes), arrows (the flow of information, documents, etc.). The same notation is used in items such as the "decision", which allow you to do the branching. To indicate the start of the entire business process and its termination can be used the "Terminator" element. The advantages of Basic Flowchart are simplicity and clarity. With it you can quickly describe the business process steps. Creating of Basic Flowchart does not require any special knowledge, as easily understand by employees with different levels of education and IQ.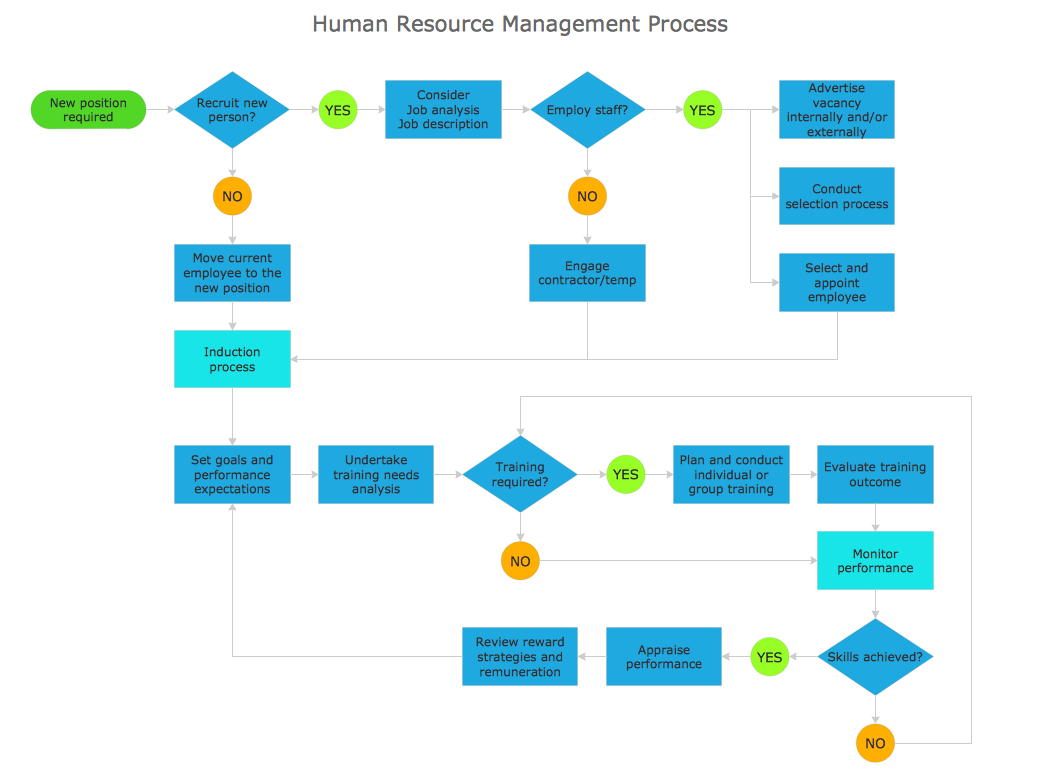
Picture: Types of Flowchart — Overview
Related Solution:
Structured-systems analysis and design method uses data flow diagrams to represent the process of data flowing through a system. Talking about this might be useless without a proper example of DFD for online store (Data Flow Diagram). This DFD example shows all the distinctness that a diagram can bring into a scattered data structure.
Data flow diagrams are used to show how data is processed within some business processes. Making DFD is a common practice for business process modeling and analysis. This diagram represents the online store business flow. It describes inputs and outputs within online selling process and depicts the interactions between its participants. This DF diagram can be used by system analysts to create an overview of a business, to study and discover its inherent strengths and weak points.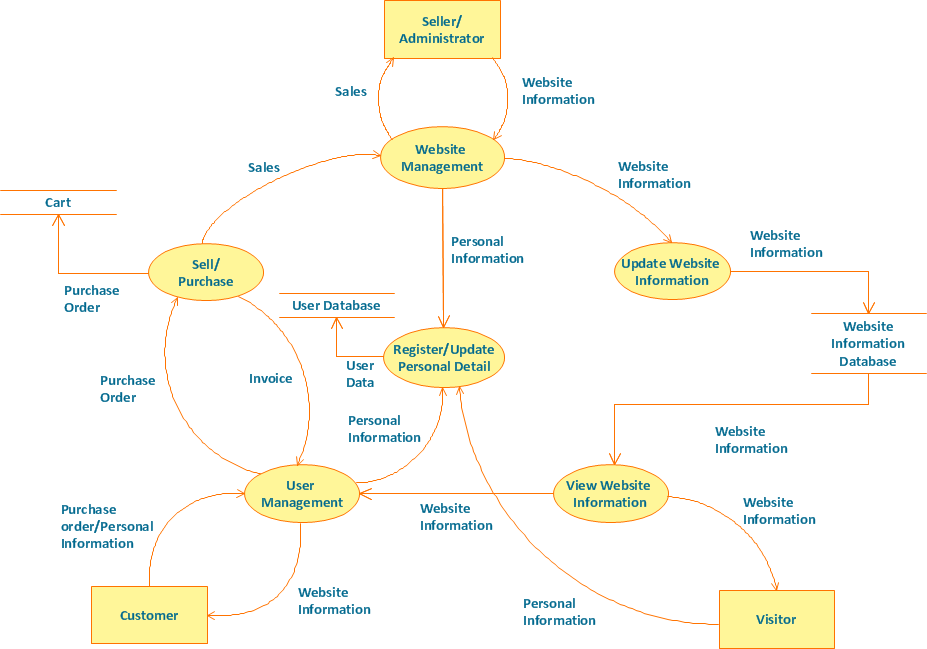
Picture: Example of DFD for Online Store (Data Flow Diagram)
Related Solution: