Diagramming tool - Amazon Web Services
and Cloud Computing Diagrams
The AWS Architecture Diagrams solution includes icons, sample and templates for several Amazon Web Services products and resources, to be used when creating architecture diagrams. The icons are designed to be simple so that you can easily incorporate them in your diagrams and put them in your whitepapers, presentations, datasheets, posters or any technical material you like.
For IT specialists, system designers and network administrators, the AWS Architecture Diagrams solution offers a wide range of recognizable graphic icons to help illustrate a diagram, as well as a helpful selection of templates and samples to model a design on. Architecture diagrams are a great way to communicate your design, deployment and topology. Here you will find an official collection of AWS resources that will help you build great AWS Architecture diagrams.
Useful for:
- Create Web Application Architecture
- Architect infrastructure based on AWS (Amazon Web Services)
- Design application services based on AWS (Amazon Web Services)
- Design auto-scalable architecture
- Design for elastic compute cloud
- Illustrate whitepapers and presentations with cloud computing diagram
- Create vector graphics files about elastic cloud systems
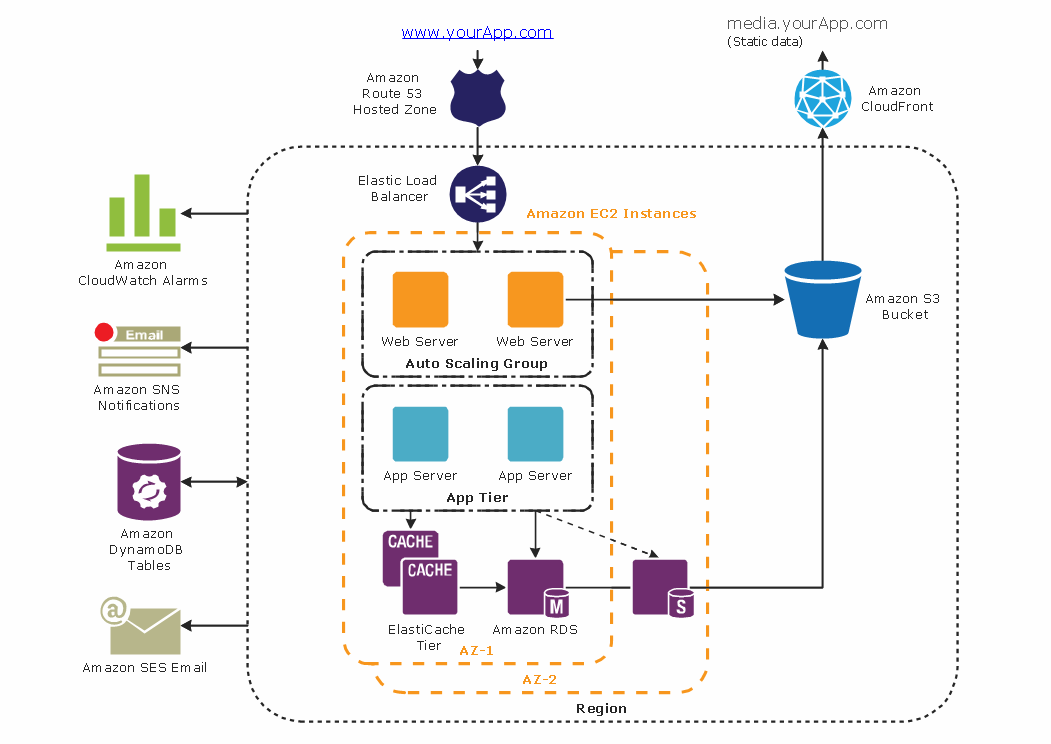
Diagrams of any complexity can be produced. This 3-tier diagram shows the core network backbone, the distribution layer, and the access layer. Creating a diagram is a dynamic process, and items can be easily added or withdrawn from the network as necessary.
This diagram was created in ConceptDraw DIAGRAM using the AWS Architecture Diagram library from the Amazon Web Services Architecture Diagrams solution (AWS solution).
ConceptDraw DIAGRAM provides export of vector graphic multipage documents into multiple file formats: vector graphics (SVG, EMF, EPS), bitmap graphics (PNG, JPEG, GIF, BMP, TIFF), web documents (HTML, PDF), PowerPoint presentations (PPT), Adobe Flash (SWF).
See also:
Diagramming software for Amazon Web Service
Diagrams, charts, schemes, symbols and icons
AWS Simple Icons for Architecture Diagrams
Diagramming for Amazon Web Services architecture - Design Elements and Icons
Samples
Network Diagrams — AWS Architecture
TEN RELATED HOW TO's:
The Architecture Diagrams are the type of diagrams which help to system designers, system developers, and application developers to visualize the overall high-level structure of the system or application and depict the interactions between software systems, users, external systems, data sources, and services. The ConceptDraw DIAGRAM Architecture Diagrams Software provides the unique Cloud Computing Diagrams solution from the Computers and Network area of ConceptDraw Solution Park with wide set of powerful tools for fast and easy creating various types of Architecture diagrams.
Picture: Architecture Diagrams
Related Solution:
Nowadays, any architect or landscape designer can't do without a pack of digital tools for designing and projecting. Thus, there will be no problem to develop any landscape architecture plan with ConceptDraw DIAGRAM , especially since there are so many ready-to use templates and examples included. It's just as easy as drawing sketches on paper.
If you using ConceptDarw DIAGRAM there is no needs to have a professional skills on landscape and garden design. As well as you don't need to be an expert in architectural charts and plans drawing. The all you need is the Landscape and Garden solution. This solution contains a unique collection of the professional designed vector objects depicting flower and grass, bushes and trees, garden furniture, pools and accessories. In one word - the full set of graphical elements enabling to focus on the creativeness while creating your landscape and garden plan.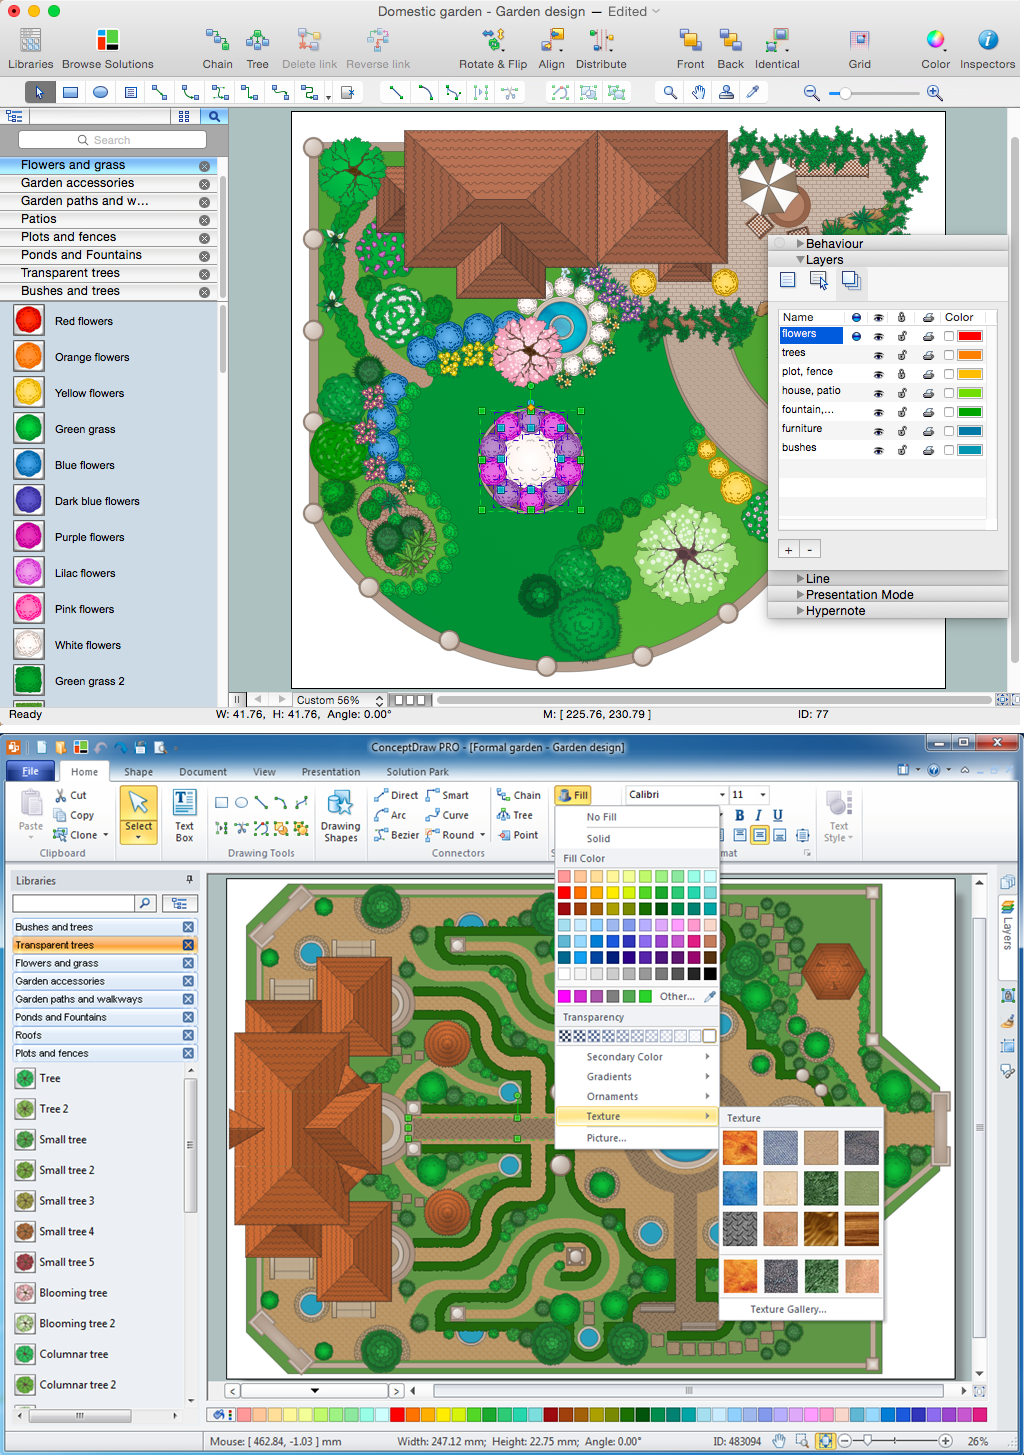
Picture: Landscape Architecture with ConceptDraw DIAGRAM
Related Solution:
What do you know about restaurants? To have a better understanding, use restaurant floor plans software, and enjoy the result. Registration is going to take just a few minutes, and you will be able to start your experience from tons of examples and free templates.
This restaurant floor plan was created with the help of he ConceptDraw Cafe and Restaurant Plans solution. The main feature of this restaurant is small kitchen. Perhaps that is why the designer of this establishment, has paid great attention to interior diversity. The facilities of ConceptDraw DIAGRAM allow him to make this easily. Here are represented tables for two, for three or four visitors. A visitor can choose any of the bright multi-colored chairs and tables. The two tables at the right upper corner attract one's attention. They are strictly decorated and located near the second door. Probably they are for security service of the restaurant, which monitors to ensure that visitors do not run away without paying.
Picture: Restaurant Floor Plans Software
Related Solution:
In general, you can use any icons to represent network equipment on a diagram. However, there are some icons, for instance, Cisco icons, shapes, stencils and symbols, that are recognizable worldwide. Using those icons you can create Cisco network topology diagrams in minutes and share them anywhere.
The icons depicting Cisco network equipment are recognized and generally applied as standard images for designing network diagrams. They are free to used , but can not be reworked. Cisco network diagrams are created to depict how signals processed on the network equipment and end-user computers and how data transfer through LAN or WLAN between nodes. The vector graphic library of ConceptDraw CISCO Network Diagrams solution includes about 90 icons of Cisco network equipment for designing computer network diagrams with ConceptDraw DIAGRAM.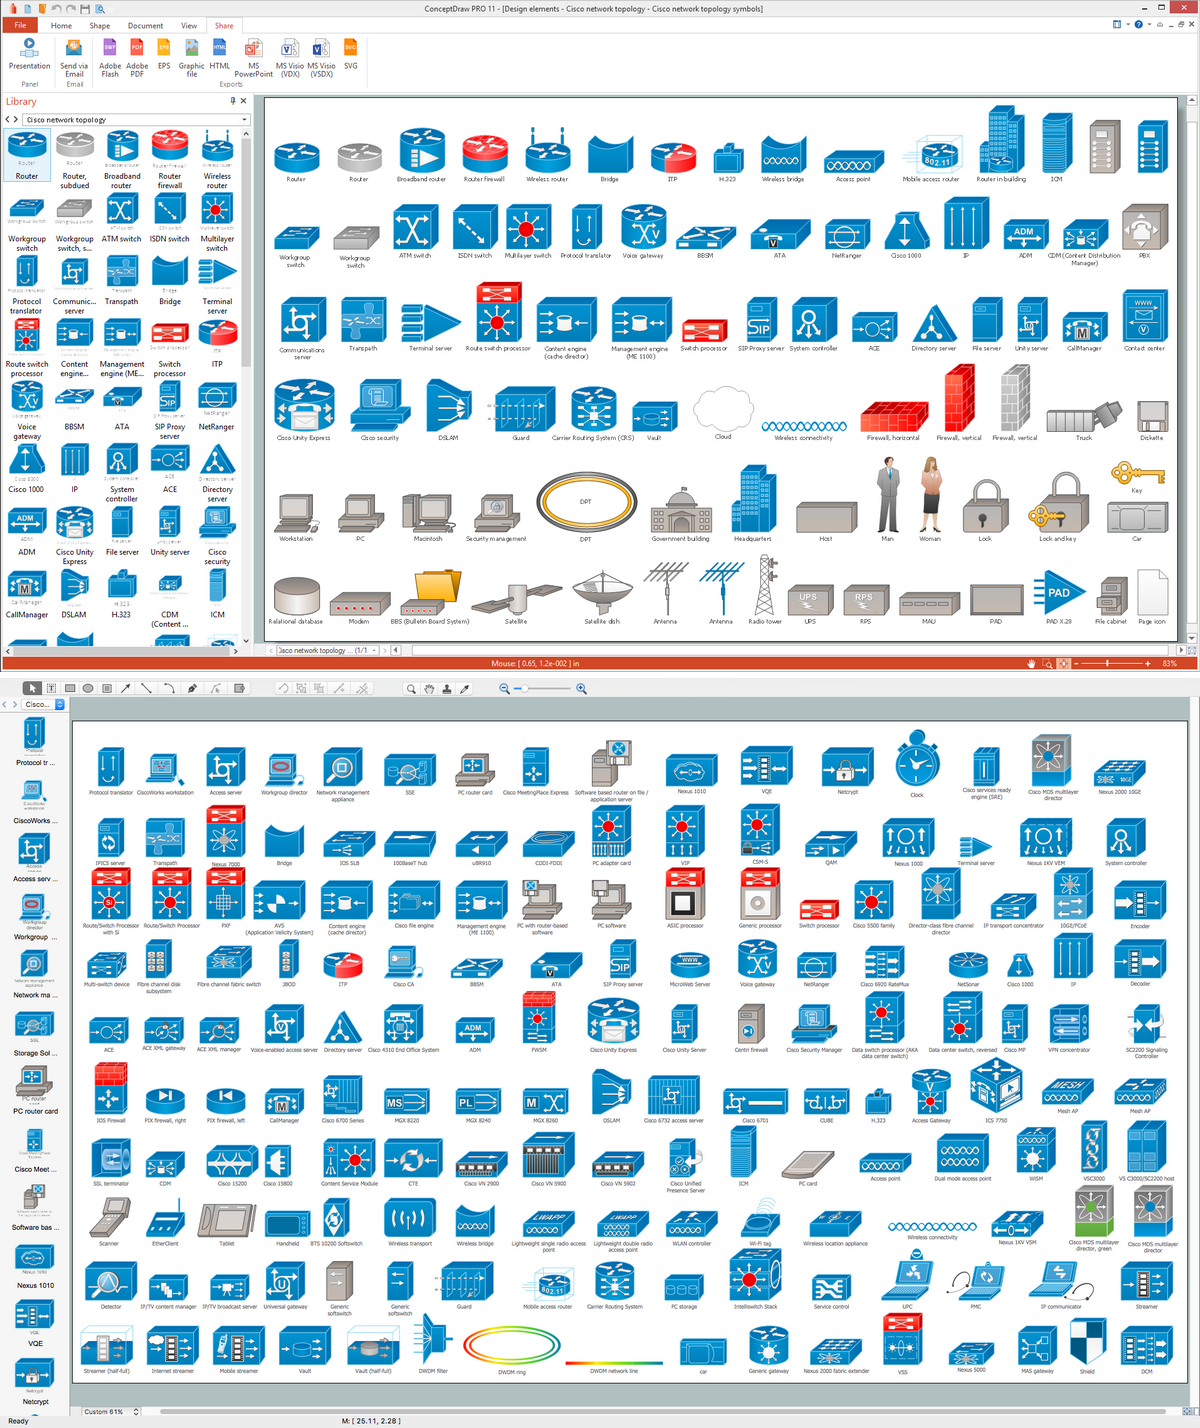
Picture: Cisco Network Topology. Cisco icons, shapes, stencils and symbols
Related Solution:
Microsoft Azure is widely used cloud platform which was created by Microsoft and now is managed by Microsoft datacenters in 19 regions of the world, and has a wide set of benefits and features.
ConceptDraw DIAGRAM diagramming and vector drawing software extended with Azure Architecture Solution from the Computer and Networks area of ConceptDraw Solution Park is the best for designing various pictorial infographics, illustrations and materials showing the possibilities and work of Microsoft Azure Cloud System and Azure services.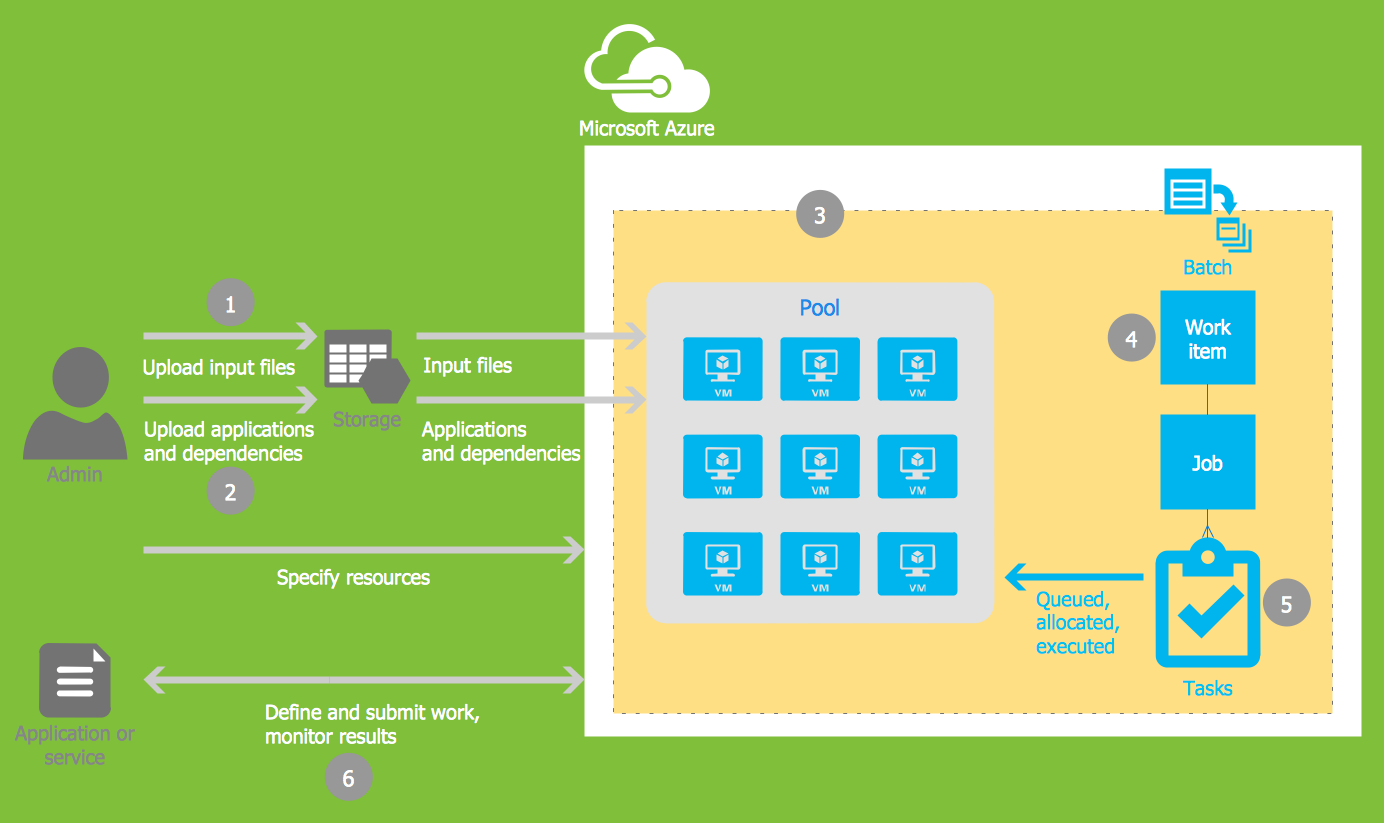
Picture: Microsoft Azure
Related Solution:
Website wireframe is a detailed view of design or its skeleton. It shows all the important elements of the final website, the main groups of contents, information structure, describes the user's interaction with interface and its estimated visualisation.
ConceptDraw DIAGRAM extended with Website Wireframe solution from the Software Development area is the best wireframing software. Using the wireframe tools, libraries of vector objects, template and examples which offers a Website Wireframe solution, you will easily design the websites wireframes of any complexity.
Picture: Wireframing
Related Solution:
Cisco switches and hubs deliver the best performance, and often used as network solutions for small businesses, enterprises, data centers. Cisco switches are the core interconnect devices of each computer network. The numerous Cisco switches specifically designed for various applications. Network switches are separated for two types: fixed configuration and modular switches. The fixed configuration switches deprecate swapping or adding another module, and vice versa for modular switch.
Picture: Cisco Switches and Hubs. Cisco icons, shapes, stencils and symbols
Related Solution:
A list of parameters on which networks differ is very long. A large network with a range up to 50 kilometers is called metropolitan area network (MAN), and this type of network can include several local area networks. Metropolitan networks in their turn connect into global area networks.
Here you will see a Metropolitan Area Network (MAN). This is an extensive network which occupies a large territory including a few buildings or even the whole city. The space of the MAN is bigger than LAN, but lower than WAN. MAN comprise a lot of communication equipment and delivers the Internet connection to the LANs in the city area. Computer and Networks solution for ConceptDraw DIAGRAM provides a set of libraries with ready-to-use vector objects to design various kinds of computer networks.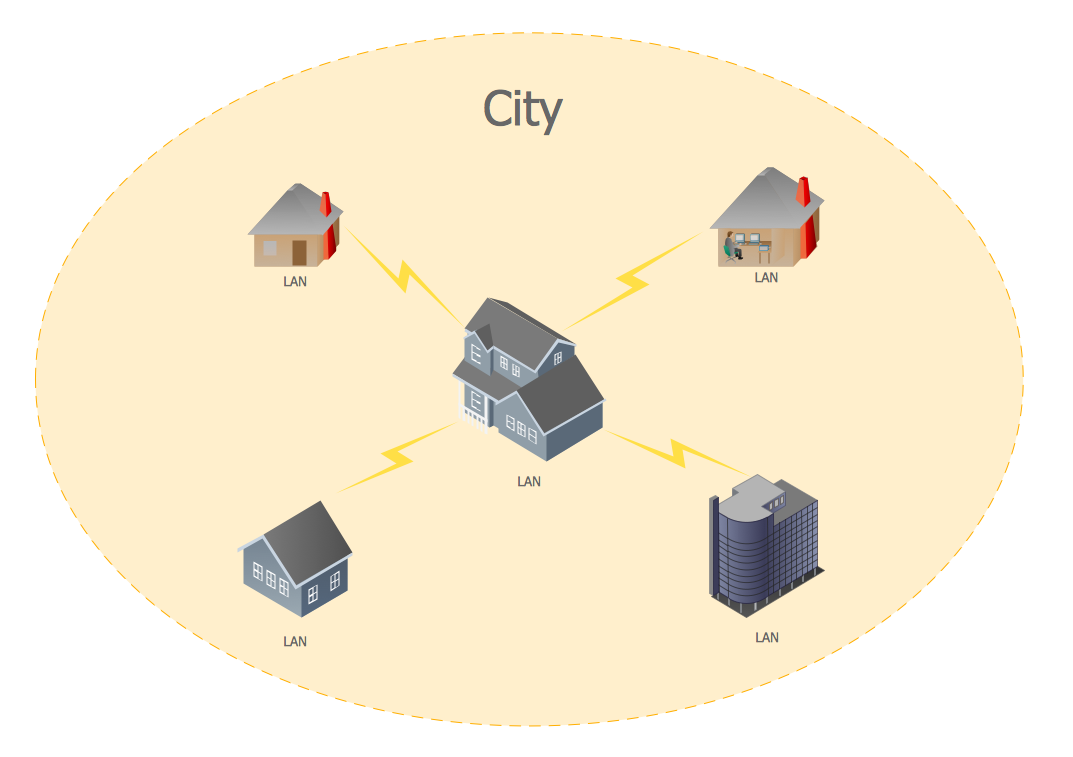
Picture: Metropolitan area networks (MAN). Computer and Network Examples
Related Solution:
One of the ways effectively visualize what is a Cloud computing or Cloud computing architecture, is to create the Sequence diagram for Cloud computing. The ConceptDraw DIAGRAM diagramming and vector drawing software enhanced with Cloud Computing Diagrams solution from the Computers and Network area of ConceptDraw Solution Park will help you design all desired types of diagrams related with cloud computing.
Picture: Sequence Diagram for Cloud Computing
Related Solution:
This diagram represents the electrical floor plan. This is a common practice - to draw the electrical plan on the floor plan. The outlets, fixtures and other electrical equipment are depicted on the floor plan with special symbols. This drawing was created using the possibilities of ConceptDraw DIAGRAM as CAD software. Computer-aided design software is intended to replaces manual engineering drafting with an automated process. CAD software is used by engineers, architects, and others to make high-precision technical drawings and illustrations. CAD software allows technical specialists to develop, examine and manage various engineering projects.
It is almost impossible nowadays to imagine mechanical engineering without digital technologies. Finding a suitable CAD software for creating mechanic diagram and electrical diagram architectural designs can take a lot of time and effort. However, with ConceptDraw DIAGRAM you can create any diagram that you want and later convert it to the most popular graphic formats like.vsdx,.png,.pptx etc.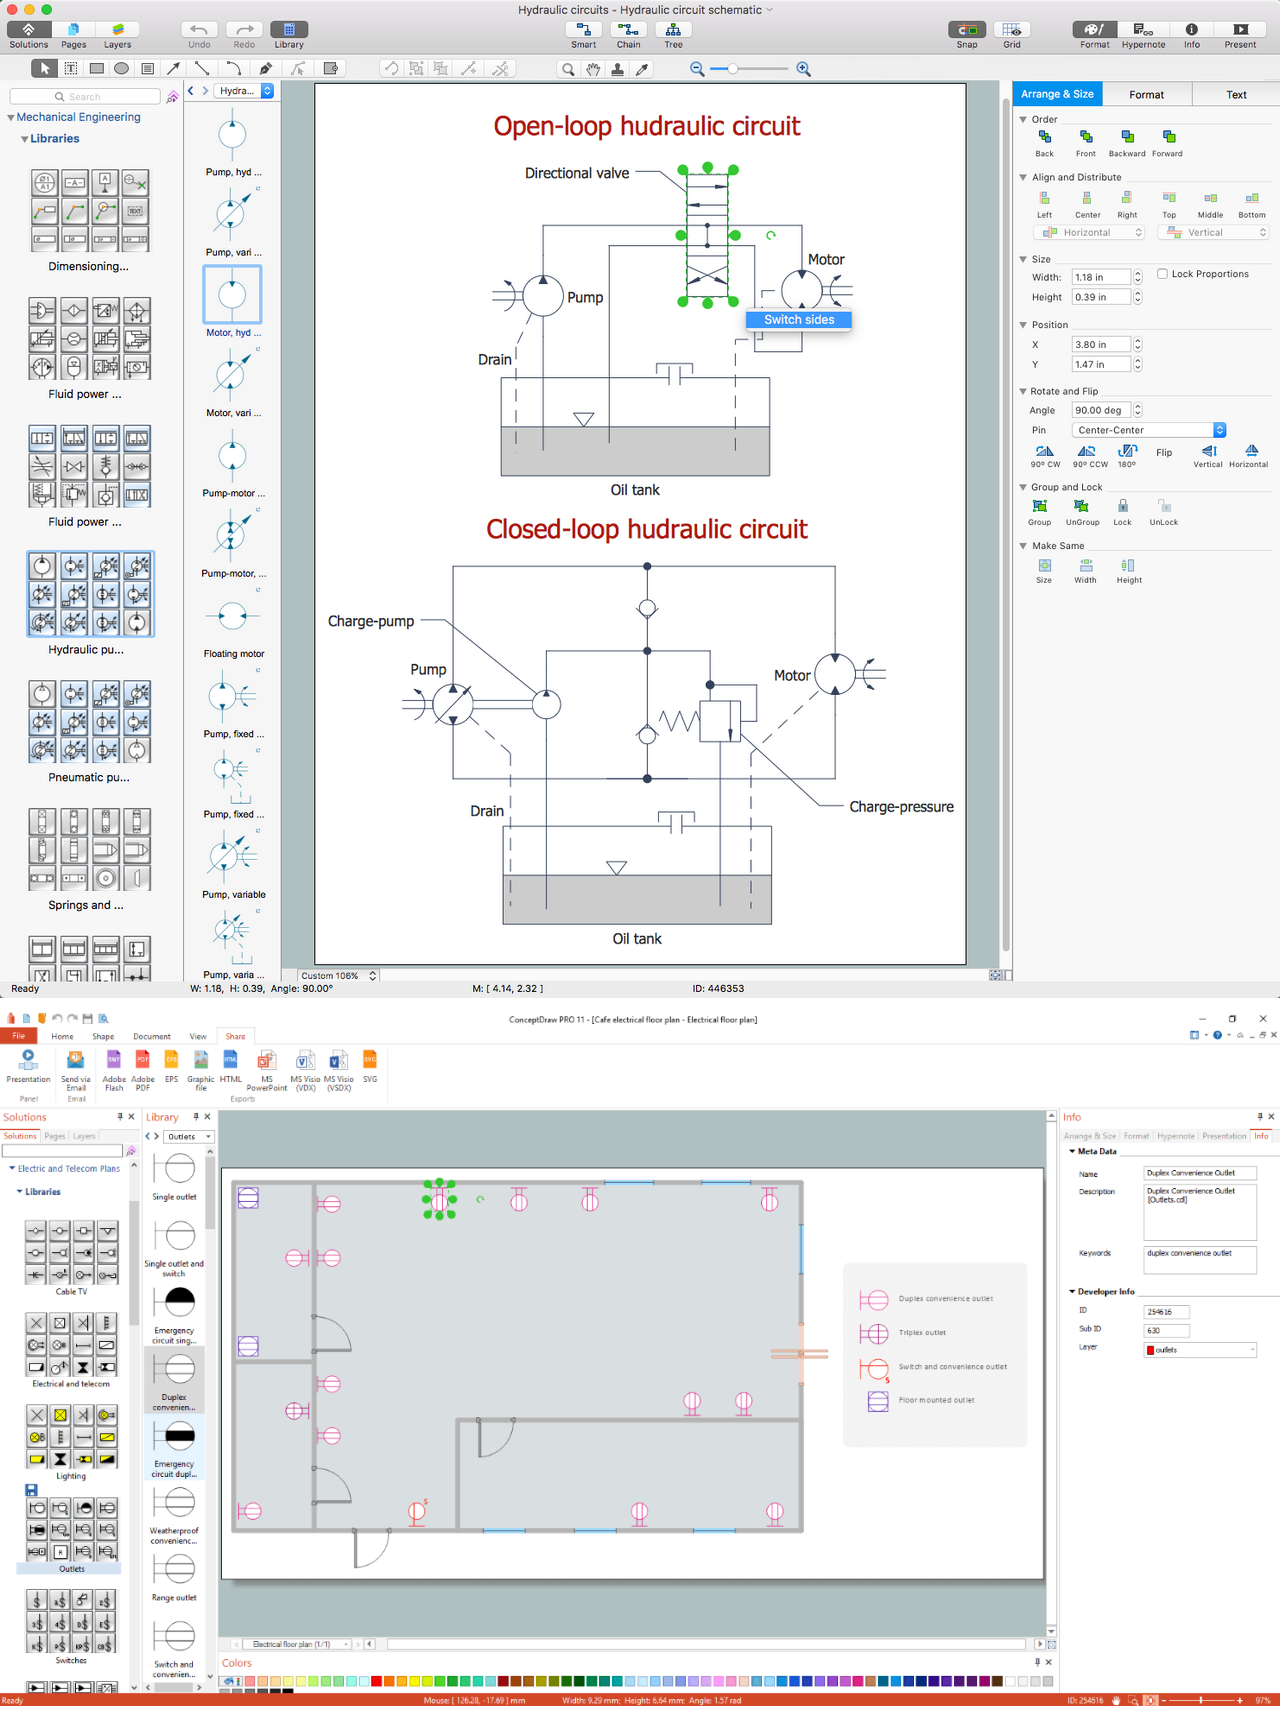
Picture: CAD Drawing Software for Making Mechanic Diagram and Electrical Diagram Architectural Designs
Related Solution: