A KPI Dashboard Provides
the Answers Your Sales Team
Sales Dashboard Solution
The Sales Dashboard Solution gives users the ability to use live data to drive displays that show sales performance in a wide variety of graphs. ConceptDraw DIAGRAM is a software for making Live charts anв gauges that provide effectiveness to your business. By using dashboards one obtain benefits:
- Saves time compared to running multiple reports
- Align strategies and organizational goals
- Saves time compared to running multiple reports
- Visual presentation of performance measures
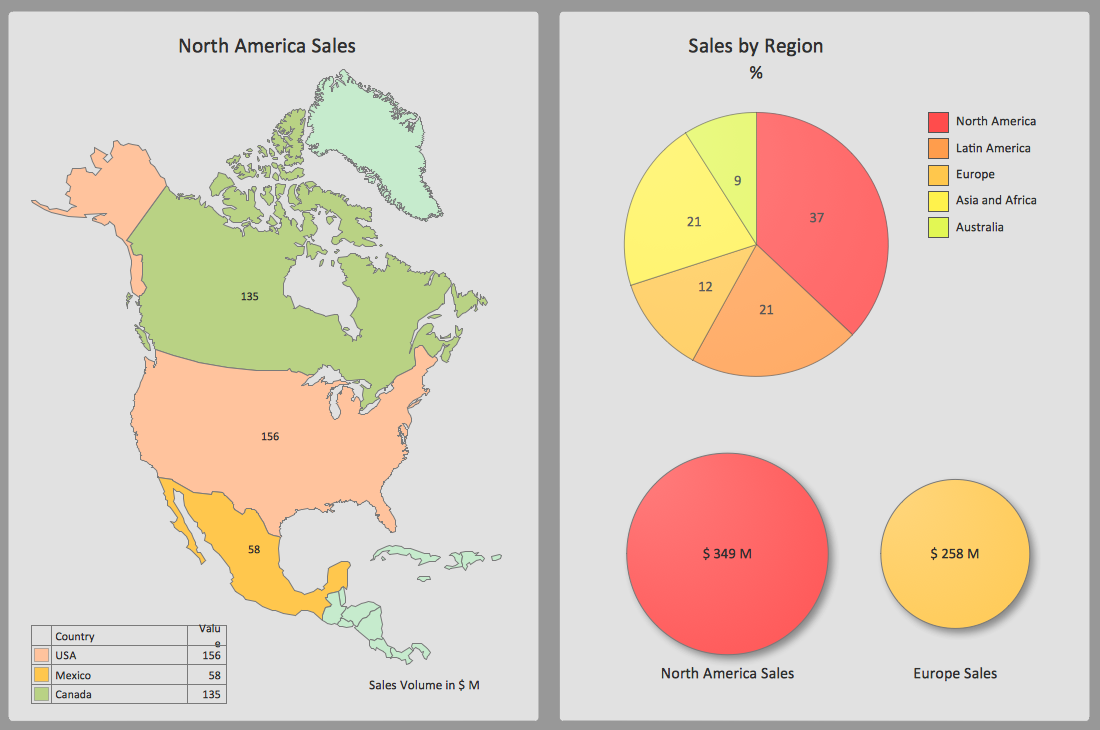
Pic. 1. Geographically Sample
TEN RELATED HOW TO's:
ConceptDraw Sales Dashboard solution allows you empower your sales team with a sales dashboard that visualizes all team and personal KPI your team need to work effectively.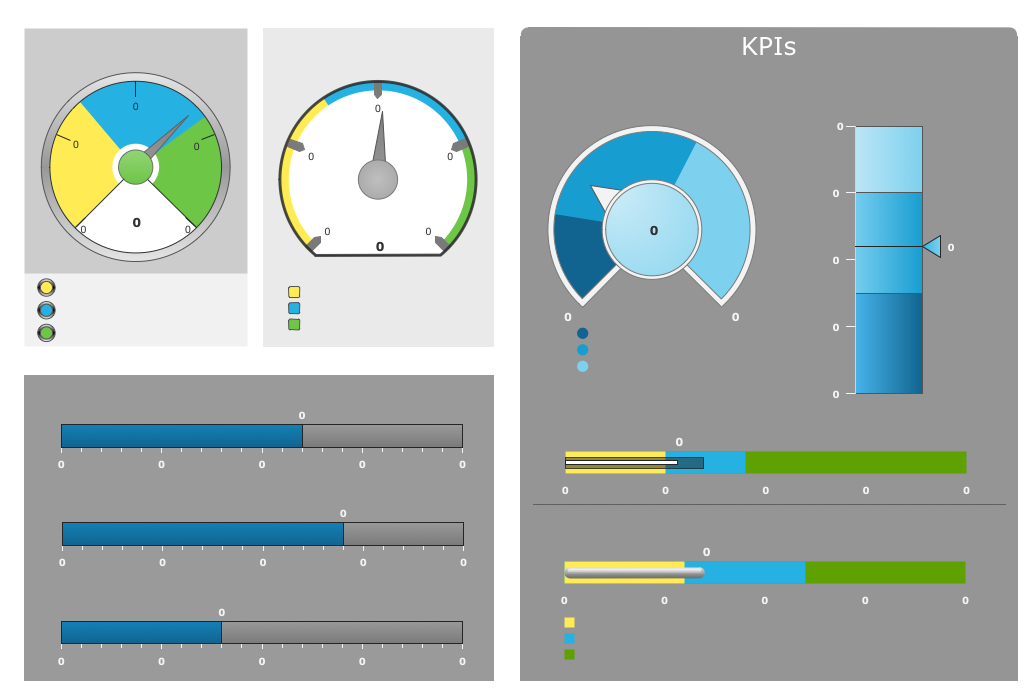
Picture: Empower Your Sales Team With a Sales Dashboard
ConceptDraw Sales Dashboard Solution is a simple and effective way of visualizing sales data and get clear picture of your sales process to see how your business can improve.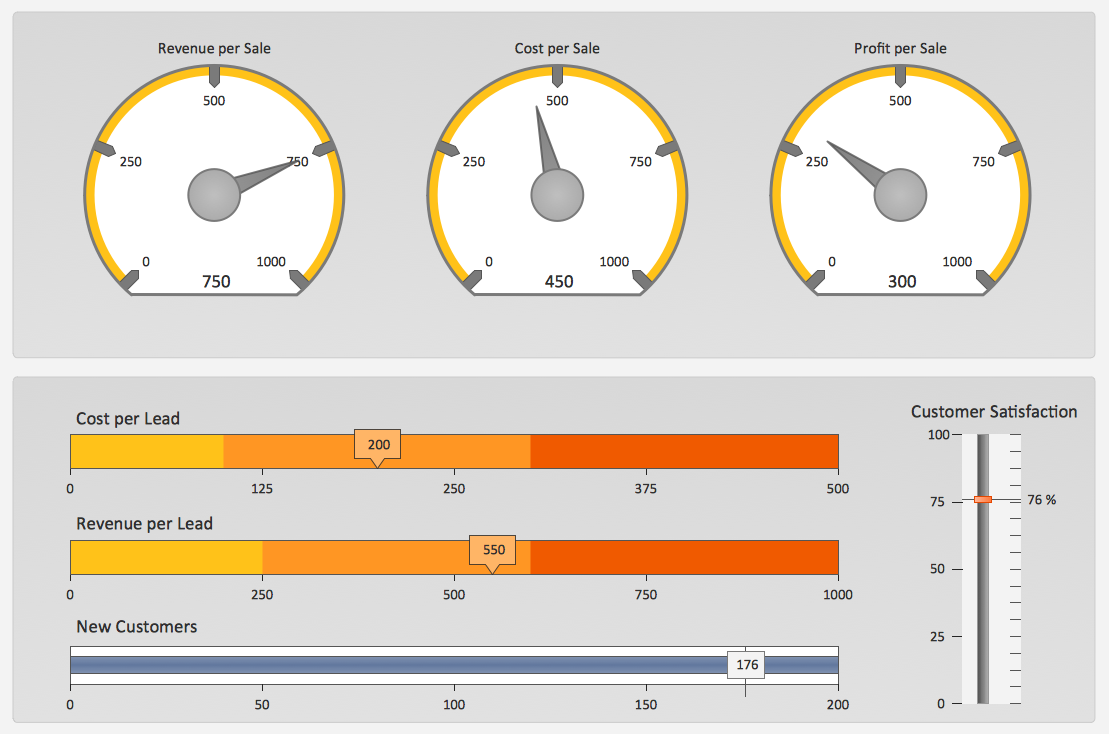
Picture: Sales Dashboard Solutionscan help your sales team keep an eye on performance
Any business process consists from a number of tasks carrying out the certain business goal. It is useful to diagram business processes to ensure that they are as foolproof, logical and sequential as possible. This business process diagram describes a typical booking process flow by the example of a cab booking process. It can be used as a roadmap for any booking system implementation. Diagramming a business process allows you to look at the entire project and take into account all types of possible scenarios. Business process diagram helps you investigate and clarify the process thoroughly so that you can find out how it can be improved. Business process diagram supports team communications by ensuring that each process element is clear and everyone in the team is on the same page.
Sometimes your company brings you less profit than you expect it to be, and it’s difficult to reveal the causes. Maybe it’s time to learn new technologies, because business diagram are easily developed by means of special software, so you won’t make any extra effort. In return, you will increase your productivity and get more done in a less time.
Picture: Business Diagram Software
Related Solutions:
When strategy manager deals with planning a strategy statements for the some upcoming period commonly he use a SWOT matrix to analyse. Filling the four sectioned matrix, helps manager to determine what external and internal factors are influenced on the company's position at the market. And where hidden potential opportunities and threats. Using mind map, made in ConceptDraw MINDMAP it is easy to capture all factors of influence. The next stage is turn a mind map into SWOT matrix with just one click by using the ConceptDraw solution for SWOT and TOWS diagrams.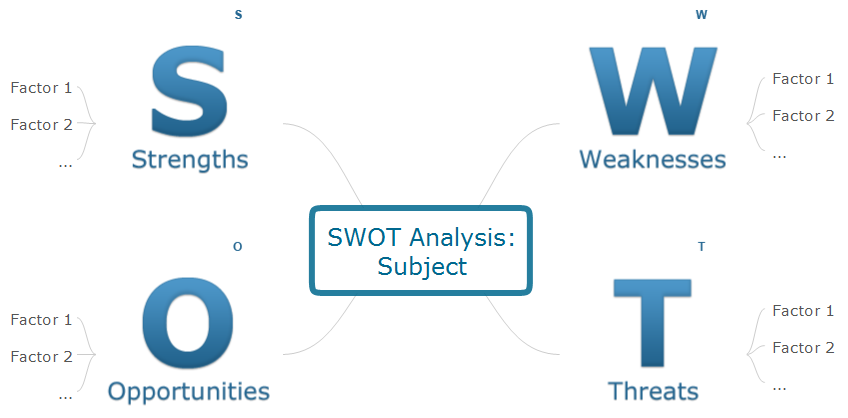
Picture: SWOT analysis Software & Template for Macintosh and Windows
ConceptDraw PROJECT is a vigorous tool for managing single or multiple projects. It lets you determine all essential elements involved into project, control schedules, resources and finances, and monitor projects' progress in most effective yet simple manner.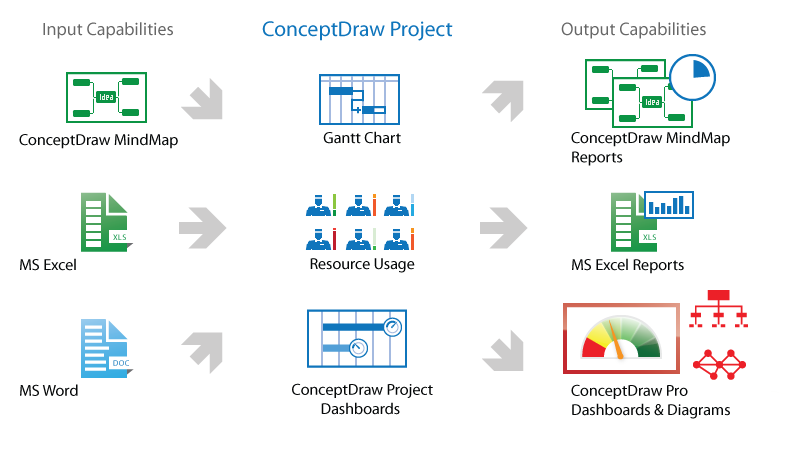
Picture: Product Overview
The library with 40 vector stencils is included in the ConceptDraw Value Stream Mapping solution.
Picture: Value Stream Mapping Icons
Related Solution:
This sample was created in ConceptDraw DIAGRAM diagramming and vector drawing software using the Pie Charts Solution from Graphs and Charts area of ConceptDraw Solution Park.
This sample shows the Pie Chart of the approximate air composition. You can see the percentage of oxygen, nitrogen and other gases in the air visualized on this Pie Chart.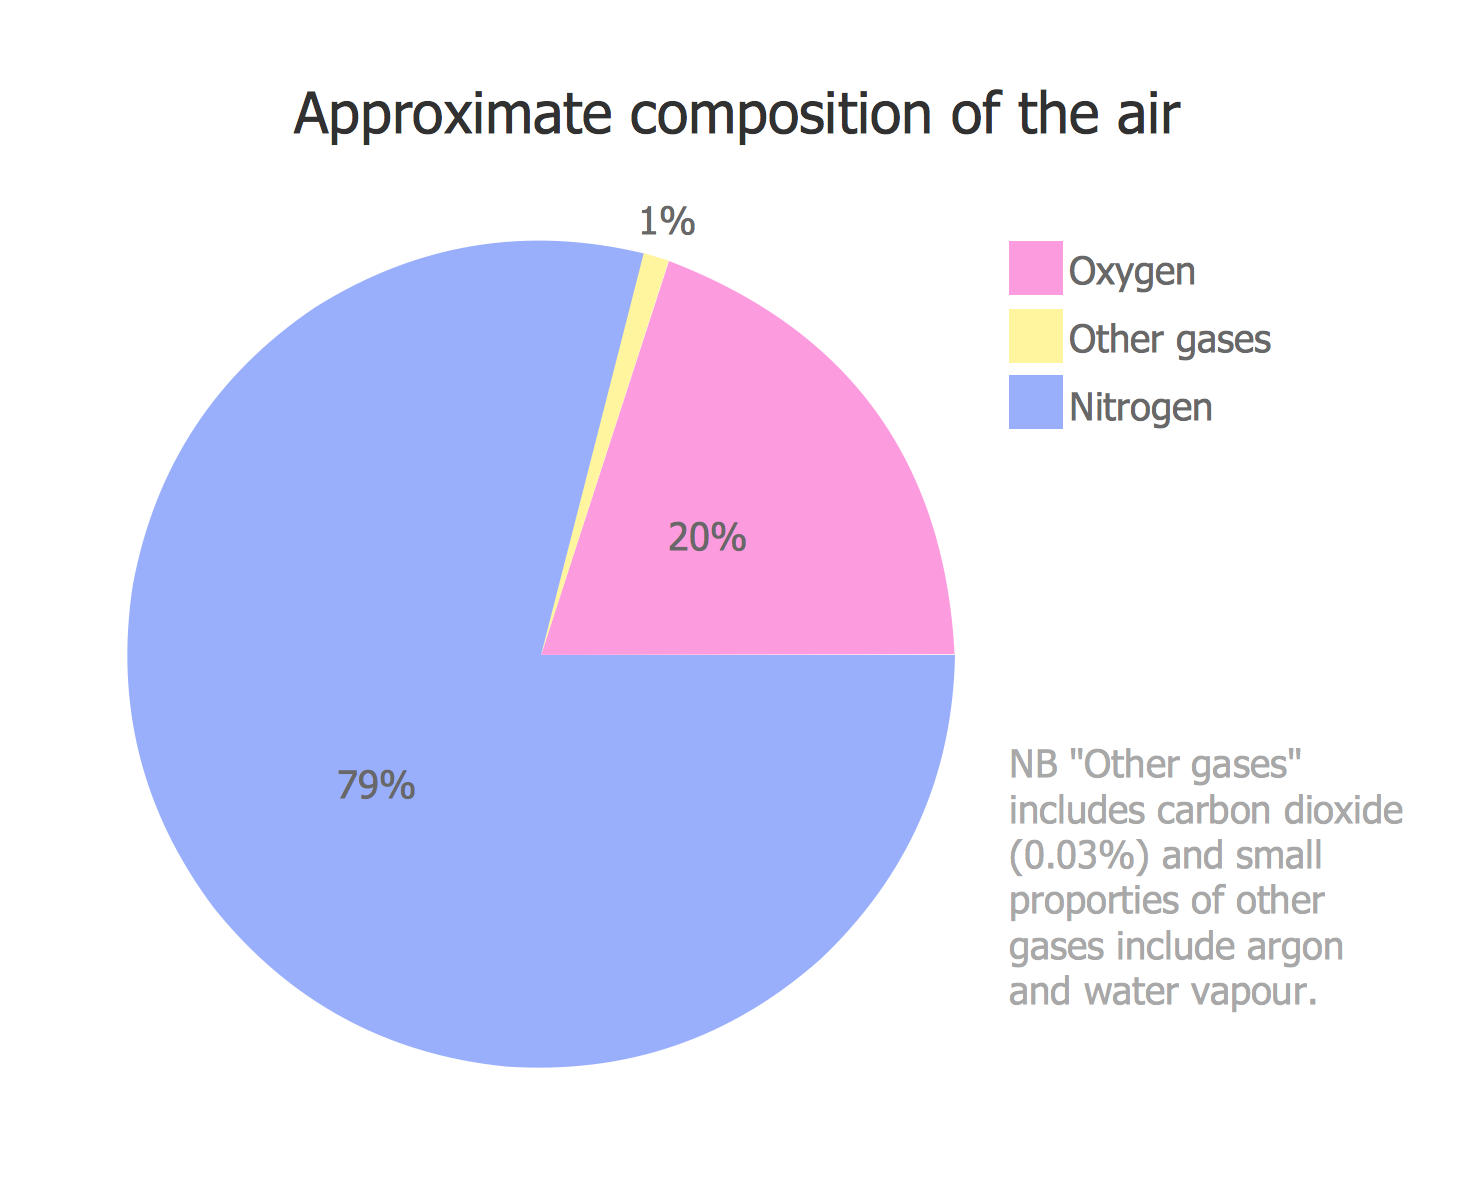
Picture: Percentage Pie Chart. Pie Chart Examples
Related Solution:
Sales dashboard is a tool that provides the answers to all questions your sales team may have. A mature sales dashboard provides complete set of KPI to shows corporate, team or personal performance to keep sales process clear.
Picture: A KPI Dashboard Providesthe Answers Your Sales Team
Drawing of Half Pipe Plans is quite complex process. But now it's very to design the Half Pipe Plans of any complexity with ConceptDraw DIAGRAM diagramming and vector drawing software extended with Plumbing and Piping Plans Solution.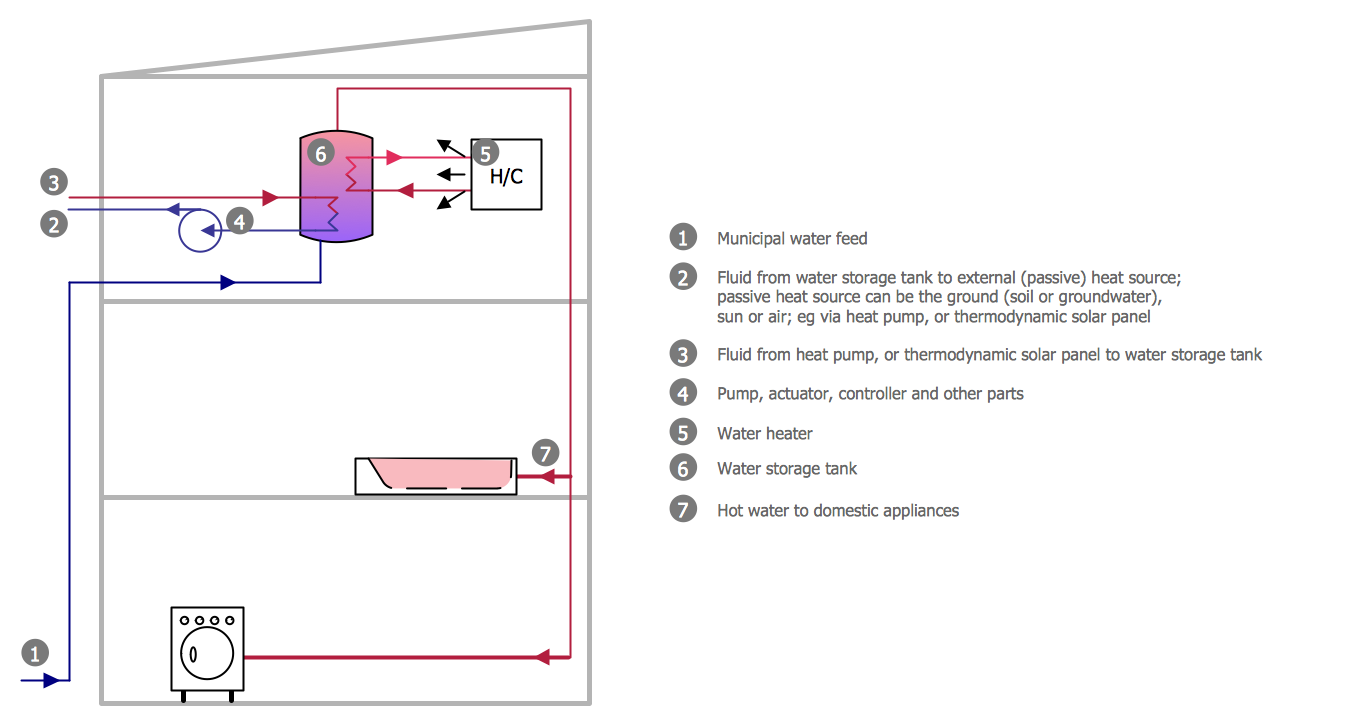
Picture: Half Pipe Plans
Related Solution:
ConceptDraw DIAGRAM diagramming and vector drawing software supplied with Sales Dashboard solution provides the full set of useful tools which make it the best for producing the live KPI Dashboard of any complexity.
Picture: KPI Dashboard
Related Solution:
ConceptDraw
DIAGRAM 18