Account Flowchart Stockbridge SystemFlowchart Examples
ConceptDraw defines some flowchart types, divided into ten categories Every flowchart type has specific shapes and examples
A data processing system is a combination of people, machines, as well as the processes which produce a defined set of outputs out of a defined set of inputs. Both the outputs and the inputs can be interpreted as facts, data, information, etc. The definition depends on the interpreter's relation to the system and a common synonymous term is known to be an “information system”.
Any data processing system is known to be involving a combination of conversion for converting data to another format, a validation for making sure that the supplied data is correct, clear and useful, sorting for arranging the items in some particular sequence or in the different sets, summarization known to be simply reducing the detail data to its main points, aggregation, which is simply combining the multiple pieces of data, analysis (the organization after the collection and interpretation as well as the presentation of data) and reporting, which is a process of listing the details or the summary of data in a way of the computed information sometimes.
There are many types of data processing systems exist, such as those defined by the application area, the scientific data processing, which is a process involving a computation being simply the comparison as well as the arithmetic operations, upon a small amount of the so called “input data”. As a result, there is a small volume of output left in the very end. The so called “commercial data processing” is the one involving a large volume of input data, a large volume of output and a few computational operations.
“Data analysis” is the one of the methods used for describing the facts, detecting the patterns, developing explanations, as well as testing the hypotheses. It is used for analysing the sales and the data from the customers upon receiving the result of the surveys they’ve been through for identifying the connections between the different products allowing the so called “cross selling campaigns”. There are systems defined by the service type, the so called “transaction processing systems”. There are also the information storage and the retrieval systems, the control and command systems, the computing service systems, the process control systems and the message switching systems.
One of the most commonly used examples of a data processing system is the process of maintaining a check register when the transactions which are simply checks and deposits are recorded upon uprising, as well as the transactions being summarized for determining an existing balance. There are also so called “deposits by source” exist as well as the “checks by type”, such as the ones used within the charitable organizations’ activities. Such information is used for obtaining the information, such as the total of all contributions within one year. It is well-known that a system, in which all the transactions are being recorded on a consistent basis, as well as the same method of the so called “bank re-conciliation” is used each time.
Transaction processing is known to be distinct from all the other computer processing models, such as batch processing, real-time processing and time-sharing. The batch processing is simply an execution of a series of programs, which are known to be also called as the “jobs”, on a computer without using any manual intervention. A few transactions are called a “batch”. Such batch is known to be collected as well as processed at the very same time, resulting in each transaction having not an immediate result, available while the transaction is being entered, having a time delay.
But there are so called “real time systems” where an appropriate response to a stimulus can be always guaranteed as well as the request quick enough for affecting the conditions caused the stimulus itself. Each of the transactions in the real-time processing is known to be unique, being not a part of a group of any different transactions. A Transaction Processing System is basically a system, which is known to be collecting, modifying, retrieving and storing any data transactions of any enterprise. Transaction processing, instead of allowing some user to be able to run the so called “arbitrary programs”, allows the predefined as well as the structured transactions. Each of such transactions is basically a short duration, having its processing activity for each of the transactions programmed in advance.
Once you decide to create a flowchart mentioning all the processes happening within any needed system to be described, you can always use a very useful and unique as well as professionally developed software — ConceptDraw DIAGRAM Such application allows its users to make any needed flowchart, including the account one mentioning all the processes taking place within a particular system going into as many details as it is needed, using the previously created graphical objects as well as the pre-made examples of all the mostly and widely used flowcharts. Some of the existing solutions from ConceptDraw STORE contains more than one template enabling all the ConceptDraw DIAGRAM users to have such examples as their own drafts which can be always edited in order to end up having an amazing result — a professionally made chart, flowchart, diagram, any needed map, scheme, plan as well as other drawings, depending on what field of the business activity you are involved in.

Example 1. Cross-Functional Flowcharts Solution
Thus, one of the solutions provided by the IT specialists of CS Odessa is the “Cross-Functional Flowcharts”, offering 45 graphical shapes as well as the pre-made and ready-to-use samples of the flowcharts, such as Cross-Functional ones. Having ConceptDraw DIAGRAM as well as the mentioned solution which can be downloaded from ConceptDraw STORE (and ConceptDraw STORE application can itself be downloaded from this site, as well as a ConceptDraw DIAGRAM one) means having an opportunity to make any needed flowchart, including the Cross-Functional one, mentioning all the needed data as well as its circulation within a particular system, such as a Stockbridge one.

Example 2. Stockbridge system flowchart example
"This is a flowchart of a data processing system combining manual and computerized processing to handle accounts receivable, billing, and general ledger."
[Data processing system. Wikipedia]
TEN RELATED HOW TO's:The network architecture and design specialization will help you gain the technical leadership skills you need to design and implement high-quality networks that support business needs. Picture: Computer Network Architecture. Computer and Network Examples The Total Quality Management Diagram solution helps your organization visualize business and industrial processes. Create Total Quality Management diagrams for business process with ConceptDraw software.
 Picture: Create TQM Flowcharts for MacRelated Solution: Data base diagrams describes inter-related data and tables. It describes roles and relationships, internal and external dependencies, data exchange conventions and structures of knowledge domain.
ConceptDraw Software provides number of data-base chart libraries including major 49 vector symbols. Use these DFD flowchart symbol libraries to design data-base structure and models, use it to design data base process-oriented models, or simple data-oriented models. The are special drawing tools for making data flowcharts, data process diagrams, structured analysis diagrams, and information flow diagrams.
Picture: Create TQM Flowcharts for MacRelated Solution: Data base diagrams describes inter-related data and tables. It describes roles and relationships, internal and external dependencies, data exchange conventions and structures of knowledge domain.
ConceptDraw Software provides number of data-base chart libraries including major 49 vector symbols. Use these DFD flowchart symbol libraries to design data-base structure and models, use it to design data base process-oriented models, or simple data-oriented models. The are special drawing tools for making data flowcharts, data process diagrams, structured analysis diagrams, and information flow diagrams. Picture: Database Flowchart SymbolsRelated Solution: The SDL Diagrams produced with ConceptDraw DIAGRAM are vector graphic documents and are available for reviewing, modifying, and converting to a variety of formats
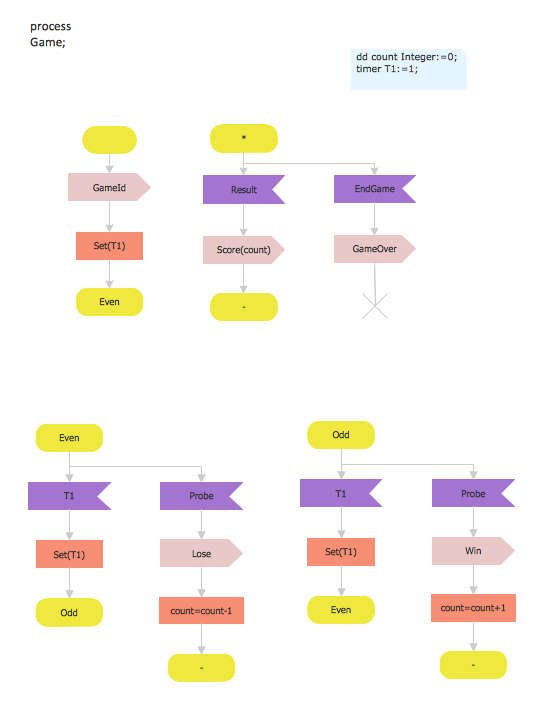 Picture: SDL DiagramRelated Solution: A Venn diagram, sometimes referred to as a set diagram, is a diagramming style used to show all the possible logical relations between a finite amount of sets. Having ConceptDraw DIAGRAM software one allows anyone who cares for their drawings to look not only nice but also smart and professional.
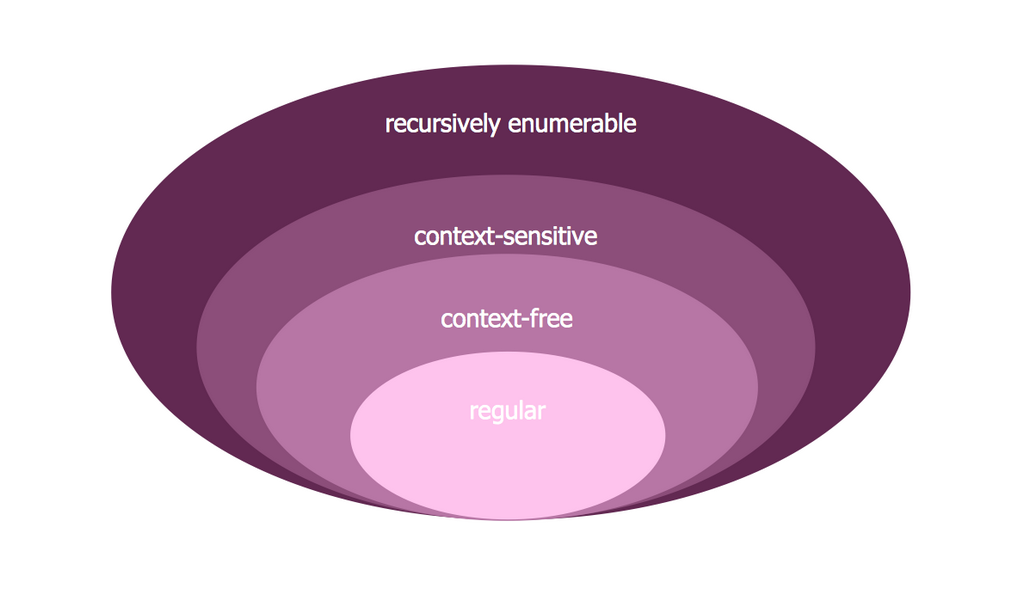 Picture: Venn Diagram Examples for Problem SolvingComputer Science. Chomsky HierarchyRelated Solution: Nodes of any computer network are somehow organized in a hierarchy or a layout. Some of the common layouts like star network topology are more reliable and some like ring topology withstand high loads better. It is also important to distinguish logical topologies from physical.
This diagram represents a typical view of the star network topology. The star network topology is one of the most frequently used network topologies in the majority of office and home networks. It is very popular because of its low cost and the easy maintenance. The plus of the star network topology is that if one computer on the local network is downed, this means that only the failed computer can not send or receive data. The other part of the network works normally. The minus of using star network topology is that all computers are connected to a single point-switch, or hub. Thus, if this equipment goes down, the whole local network comes down.
Picture: Venn Diagram Examples for Problem SolvingComputer Science. Chomsky HierarchyRelated Solution: Nodes of any computer network are somehow organized in a hierarchy or a layout. Some of the common layouts like star network topology are more reliable and some like ring topology withstand high loads better. It is also important to distinguish logical topologies from physical.
This diagram represents a typical view of the star network topology. The star network topology is one of the most frequently used network topologies in the majority of office and home networks. It is very popular because of its low cost and the easy maintenance. The plus of the star network topology is that if one computer on the local network is downed, this means that only the failed computer can not send or receive data. The other part of the network works normally. The minus of using star network topology is that all computers are connected to a single point-switch, or hub. Thus, if this equipment goes down, the whole local network comes down.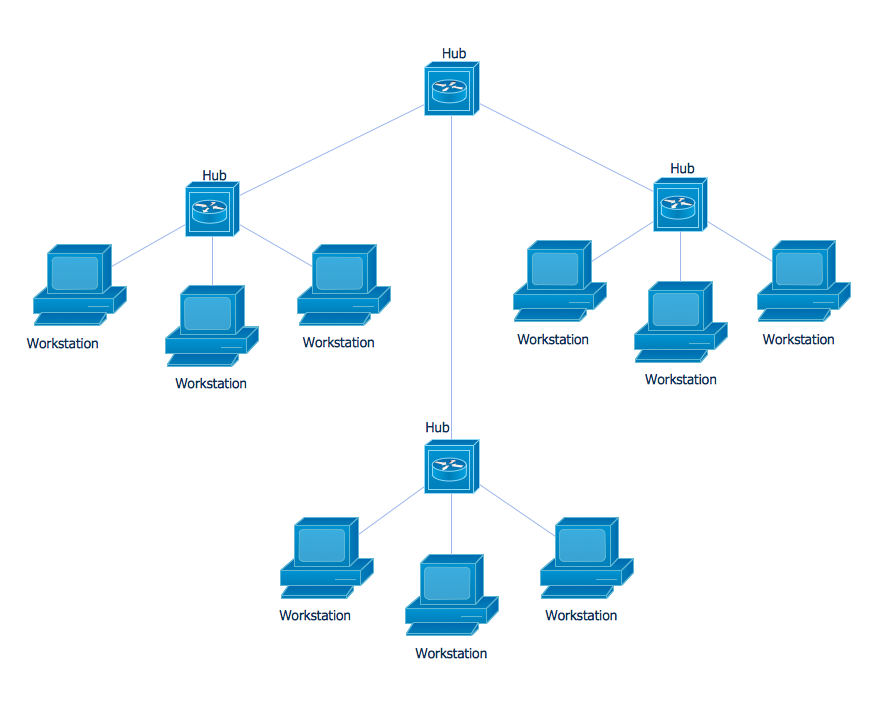 Picture: Star Network TopologyRelated Solution: Describing a workflow or approval process can take hours and be too complicated, especially since there are options to do it quickly and vividly. Diagrams called flowcharts replace long paragraphs of boring text and represent information in a graphic way. You can draw one on paper or you can use flowchart software to do it quickly and scalable. This kind of software is easy to use and you don’t need any special skills to start using it. In addition, there are a lot examples and predesigned templates on the Internet.
Flowcharts are a best tool for staking out a huge and complex process into some small readable parts. Surely, flowcharts can be drawn manually but the use of standard symbols that make it clear for a wide audience makes a software tool preferred for this task. The core for a successful flowchart is its simplicity. That is why often before beginning making flowchart through software, people draw the sketch on a piece of paper. Designing an effective flowchart means the combination of the data needed to be shown and the simplicity with which you depict it.
Picture: Star Network TopologyRelated Solution: Describing a workflow or approval process can take hours and be too complicated, especially since there are options to do it quickly and vividly. Diagrams called flowcharts replace long paragraphs of boring text and represent information in a graphic way. You can draw one on paper or you can use flowchart software to do it quickly and scalable. This kind of software is easy to use and you don’t need any special skills to start using it. In addition, there are a lot examples and predesigned templates on the Internet.
Flowcharts are a best tool for staking out a huge and complex process into some small readable parts. Surely, flowcharts can be drawn manually but the use of standard symbols that make it clear for a wide audience makes a software tool preferred for this task. The core for a successful flowchart is its simplicity. That is why often before beginning making flowchart through software, people draw the sketch on a piece of paper. Designing an effective flowchart means the combination of the data needed to be shown and the simplicity with which you depict it. Picture: Flowchart Software: A Comprehensive GuideRelated Solution: ConceptDraw DIAGRAM enhanced with Flowcharts Solution is the best flow chart maker online design software. Use it to ✔️ create clear and actionable Flowcharts, ✔️ improve decision-making, ✔️ enhance problem-solving in various scenarios, ✔️ enhance creativity and productivity across industries, ✔️ streamline workflows
 Picture: Flow Chart OnlineRelated Solution: Draw your own business process flowcharts using ConceptDraw DIAGRAM diagramming and business graphics software.
The Flowcharts Solution for ConceptDraw DIAGRAM is a comprehensive set of examples and samples in several different color themes for professionals that need to graphically represent a process.
Picture: Flow Chart OnlineRelated Solution: Draw your own business process flowcharts using ConceptDraw DIAGRAM diagramming and business graphics software.
The Flowcharts Solution for ConceptDraw DIAGRAM is a comprehensive set of examples and samples in several different color themes for professionals that need to graphically represent a process. Picture: Flow Chart Diagram ExamplesRelated Solution: This sample was created in ConceptDraw DIAGRAM diagramming and vector drawing software using the Cross-Functional Flowcharts solution from the Business Processes area of ConceptDraw Solution Park.
This sample shows the Swim Lanes Flowchart of Identification and logging.
Picture: Flow Chart Diagram ExamplesRelated Solution: This sample was created in ConceptDraw DIAGRAM diagramming and vector drawing software using the Cross-Functional Flowcharts solution from the Business Processes area of ConceptDraw Solution Park.
This sample shows the Swim Lanes Flowchart of Identification and logging.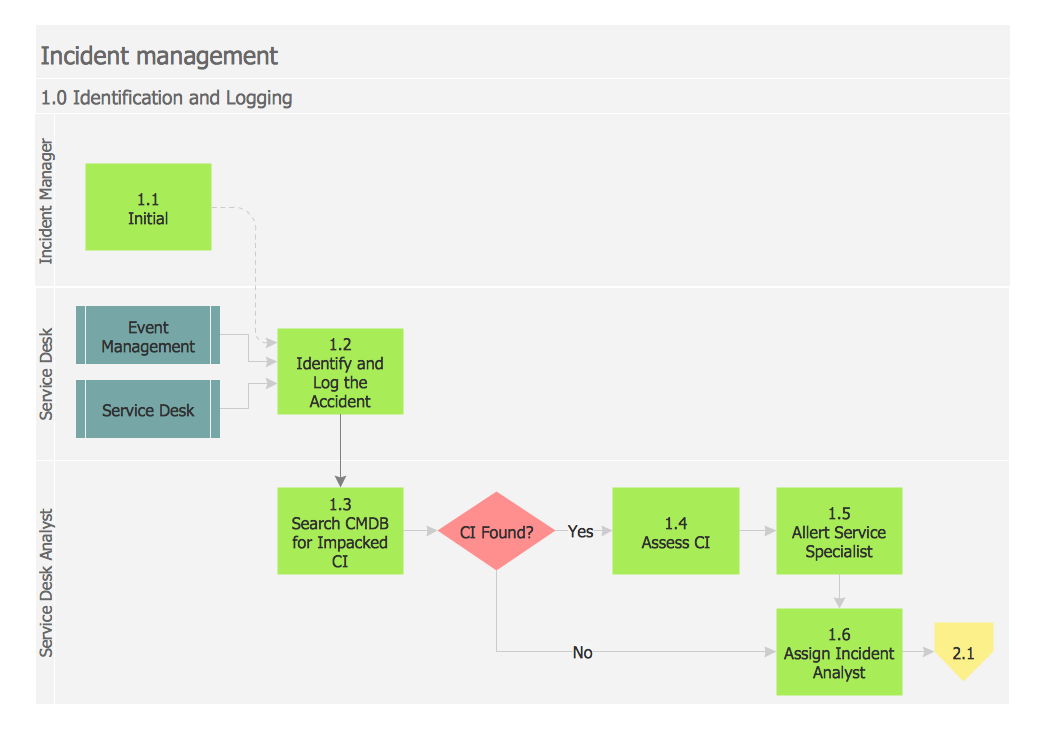 Picture: Swim Lanes Flowchart. Flowchart ExamplesRelated Solution:
ConceptDraw DIAGRAM 18
Picture: Swim Lanes Flowchart. Flowchart ExamplesRelated Solution:
ConceptDraw DIAGRAM 18
A data processing system is a combination of people, machines, as well as the processes which produce a defined set of outputs out of a defined set of inputs. Both the outputs and the inputs can be interpreted as facts, data, information, etc. The definition depends on the interpreter's relation to the system and a common synonymous term is known to be an “information system”.
Any data processing system is known to be involving a combination of conversion for converting data to another format, a validation for making sure that the supplied data is correct, clear and useful, sorting for arranging the items in some particular sequence or in the different sets, summarization known to be simply reducing the detail data to its main points, aggregation, which is simply combining the multiple pieces of data, analysis (the organization after the collection and interpretation as well as the presentation of data) and reporting, which is a process of listing the details or the summary of data in a way of the computed information sometimes.
There are many types of data processing systems exist, such as those defined by the application area, the scientific data processing, which is a process involving a computation being simply the comparison as well as the arithmetic operations, upon a small amount of the so called “input data”. As a result, there is a small volume of output left in the very end. The so called “commercial data processing” is the one involving a large volume of input data, a large volume of output and a few computational operations.
“Data analysis” is the one of the methods used for describing the facts, detecting the patterns, developing explanations, as well as testing the hypotheses. It is used for analysing the sales and the data from the customers upon receiving the result of the surveys they’ve been through for identifying the connections between the different products allowing the so called “cross selling campaigns”. There are systems defined by the service type, the so called “transaction processing systems”. There are also the information storage and the retrieval systems, the control and command systems, the computing service systems, the process control systems and the message switching systems.
One of the most commonly used examples of a data processing system is the process of maintaining a check register when the transactions which are simply checks and deposits are recorded upon uprising, as well as the transactions being summarized for determining an existing balance. There are also so called “deposits by source” exist as well as the “checks by type”, such as the ones used within the charitable organizations’ activities. Such information is used for obtaining the information, such as the total of all contributions within one year. It is well-known that a system, in which all the transactions are being recorded on a consistent basis, as well as the same method of the so called “bank re-conciliation” is used each time.
Transaction processing is known to be distinct from all the other computer processing models, such as batch processing, real-time processing and time-sharing. The batch processing is simply an execution of a series of programs, which are known to be also called as the “jobs”, on a computer without using any manual intervention. A few transactions are called a “batch”. Such batch is known to be collected as well as processed at the very same time, resulting in each transaction having not an immediate result, available while the transaction is being entered, having a time delay.
But there are so called “real time systems” where an appropriate response to a stimulus can be always guaranteed as well as the request quick enough for affecting the conditions caused the stimulus itself. Each of the transactions in the real-time processing is known to be unique, being not a part of a group of any different transactions. A Transaction Processing System is basically a system, which is known to be collecting, modifying, retrieving and storing any data transactions of any enterprise. Transaction processing, instead of allowing some user to be able to run the so called “arbitrary programs”, allows the predefined as well as the structured transactions. Each of such transactions is basically a short duration, having its processing activity for each of the transactions programmed in advance.
Once you decide to create a flowchart mentioning all the processes happening within any needed system to be described, you can always use a very useful and unique as well as professionally developed software — ConceptDraw DIAGRAM Such application allows its users to make any needed flowchart, including the account one mentioning all the processes taking place within a particular system going into as many details as it is needed, using the previously created graphical objects as well as the pre-made examples of all the mostly and widely used flowcharts. Some of the existing solutions from ConceptDraw STORE contains more than one template enabling all the ConceptDraw DIAGRAM users to have such examples as their own drafts which can be always edited in order to end up having an amazing result — a professionally made chart, flowchart, diagram, any needed map, scheme, plan as well as other drawings, depending on what field of the business activity you are involved in.

Example 1. Cross-Functional Flowcharts Solution
Thus, one of the solutions provided by the IT specialists of CS Odessa is the “Cross-Functional Flowcharts”, offering 45 graphical shapes as well as the pre-made and ready-to-use samples of the flowcharts, such as Cross-Functional ones. Having ConceptDraw DIAGRAM as well as the mentioned solution which can be downloaded from ConceptDraw STORE (and ConceptDraw STORE application can itself be downloaded from this site, as well as a ConceptDraw DIAGRAM one) means having an opportunity to make any needed flowchart, including the Cross-Functional one, mentioning all the needed data as well as its circulation within a particular system, such as a Stockbridge one.
Example 2. Stockbridge system flowchart example
"This is a flowchart of a data processing system combining manual and computerized processing to handle accounts receivable, billing, and general ledger." [Data processing system. Wikipedia]