Accounting Data Flow from the
Accounting Flowcharts Solution
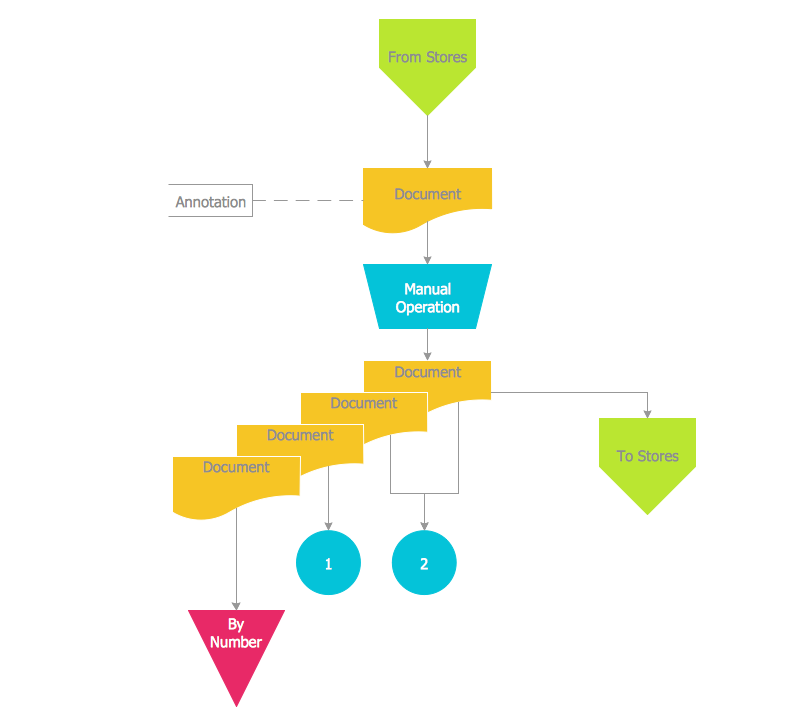
The Accounting Flowchart visually describes the financial accounting process, shows the accumulated information about transactions and events for creating the balance sheet and the final income statement.
ConceptDraw DIAGRAM provides you the incredibly useful feature — ConceptDraw STORE that gives you the possibility to navigate through ConceptDraw Solution Park, manage downloads and updates, take the access to libraries, templates and samples directly from it.
For designing the Accounting Data Flow from the ConceptDraw STORE you can choose the Accounting Flowcharts Solution from the Finance and Accounting Area.

Sample 1. Accounting Data Flow from the Accounting Flowcharts Solution
Use the predesigned vector objects from the Accounting Flowcharts library creating the Accounting Data Flow from the Accounting Flowcharts Solution.

Sample 2. Accounting Flowcharts Library
To draw the professional looking colorful Accounting Data Flow from the ConceptDraw DIAGRAM quick and easy: simply drag the desired accounting flowchart shapes from the Accounting Flowcharts library into your document, type the title and text, add the colors. You will get the best results in minutes.

Sample 3. Design Elements Accounting Flowcharts
Accounting Flowcharts Solution contains also a wide variety of templates and samples that you can use as the base for your own Accounting Flowcharts of any complexity.
Sample 4. Accounting Data Flow
Use the Accounting Flowcharts Solution to create your own professional Accounting Flowcharts and Accounting Data Flow from the ConceptDraw DIAGRAM quick and easy.
The Accounting Flowcharts produced with ConceptDraw DIAGRAM are vector graphic documents and are available for reviewing, modifying, and converting to a variety of formats (image, HTML, PDF file, MS PowerPoint Presentation, Adobe Flash or MS Visio).
TEN RELATED HOW TO's:
Do you like infographics and data visualization? Creating infographics is super-easy with ConceptDraw.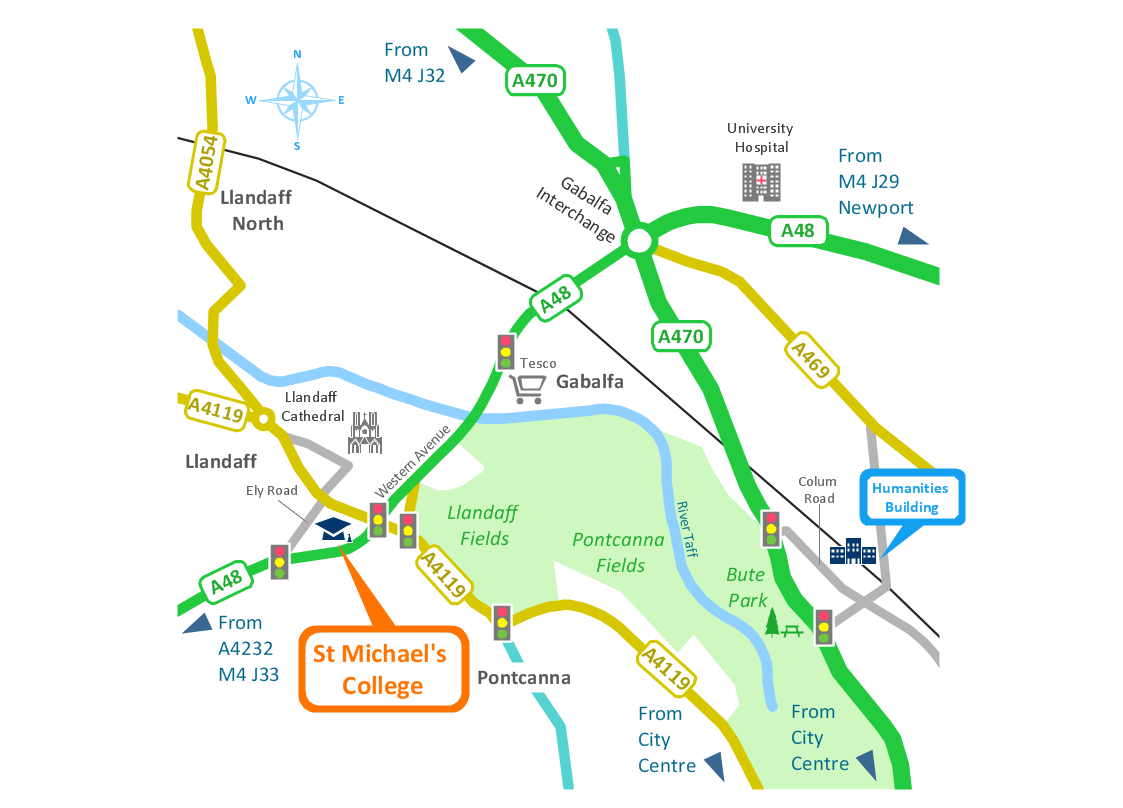
Picture: Spatial infographics Design Elements: Transport Map
To create an Audit Process FlowChart you only need Conceptdaw Software.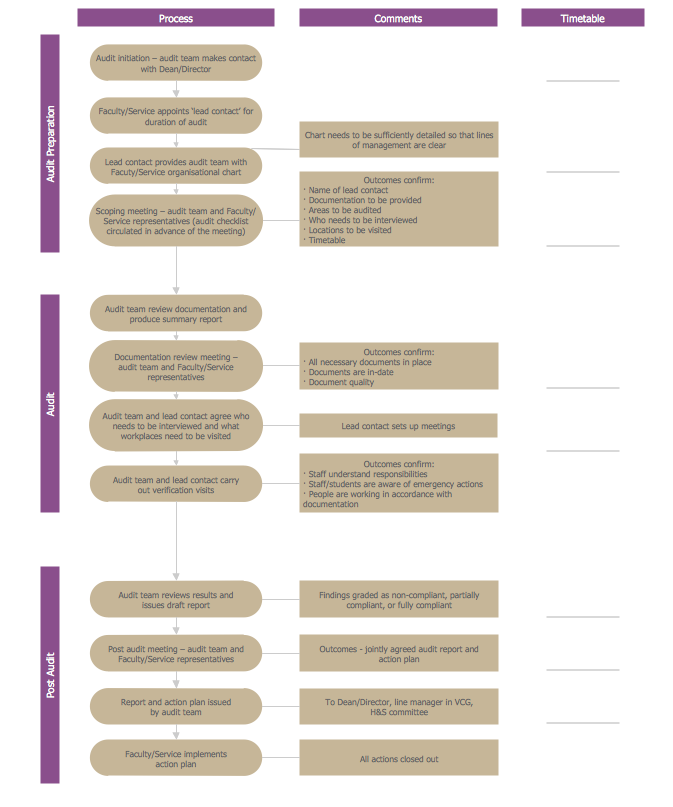
Picture: Basic Audit Flowchart. Flowchart Examples
Related Solution:
Choose which of business design elements you love best.
Design your own style with Business and Finance Solutions from ConceptDraw DIAGRAM.
We created a full set of elements, business samples, templates and libraries with vector clip art for drawing the Business Illustrations.
Mark your report or presentation, pay an attention of audience on your drawings with vector business design elements.
Picture: Business - Design Elements
Related Solution:
Software development flourishes nowadays. Students have tons of educational information and courses that would fit every taste. And it's no secret that knowing how to draw data flow diagrams is a useful skill for a future software architect. The diagrams help a lot in understanding how to storage data effectively and how data processes within a system.
This data flow diagram represents the model of small traditional production enterprise. It was created using Yourdon and Coad notation. The data flow diagram include four main objects: entity, process, data store and data flow. Yourdon and Coad notation uses circles to depict processes and parallel lines to represent data stores. Dataflows are shown as arrowed lines. They are labeled with the description of the data that move through them. Dataflow's role is to deliver the pieces of information. A process's function is to transform. the input data flow into output data flow. ConceptDraw Data Flow Diagrams solution contains the data flow diagram symbols of both Yourdon-Coad and Gane-Sarson notations and a set of handy templates to get started with DFD.
Picture: Data Flow Diagrams
Related Solution:
Visual information is easier to perceive. You can teach even a child to make diagrams with a good flowchart example that would be interesting for it. Flowcharts can be fun, it’s not about business processes or programming algorithms.
This flowchart shows step by step process of manufacturing of Nixtamal The product which is obtained by processing maize with calcium hydroxide. We must assume that the Aztecs were very fond of this product, if the recipe of its production came to our times. This flow chart was designed using ConceptDraw DIAGRAM with its solution for designing flowcharts of various types, sizes and purposes. ConceptDraw Flowcharts solution consists from the library of flowchart symbols, containing the set vector objects. Also there are a lot of diverse templates and samples of flow charts.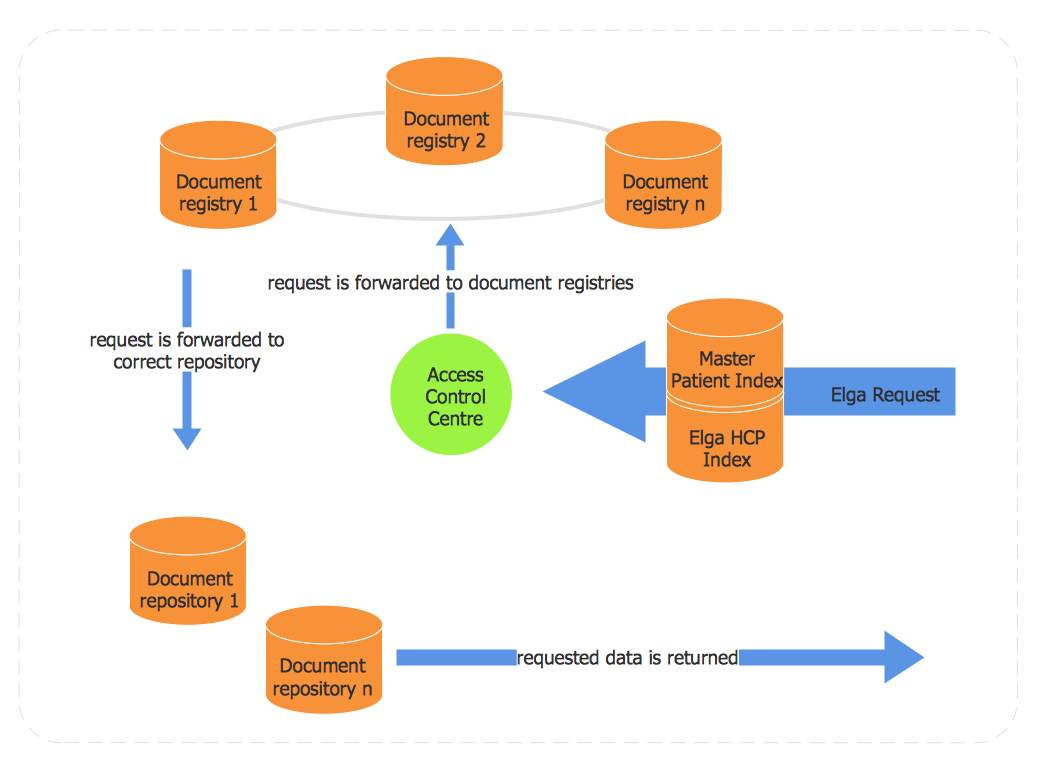
Picture: Flowchart Examples and Templates
Related Solution:
The steps of accounting cycle include the processes of identifying, collecting, analyzing documents, recording transactions, classifying, summarizing, posting, and preparing trial balance, making journal entries, closing the books and final reporting financial information of an organization.
Use the ConceptDraw DIAGRAM with Accounting Flowcharts Solution to create your own professional Accounting Flowcharts of any complexity quick and easy.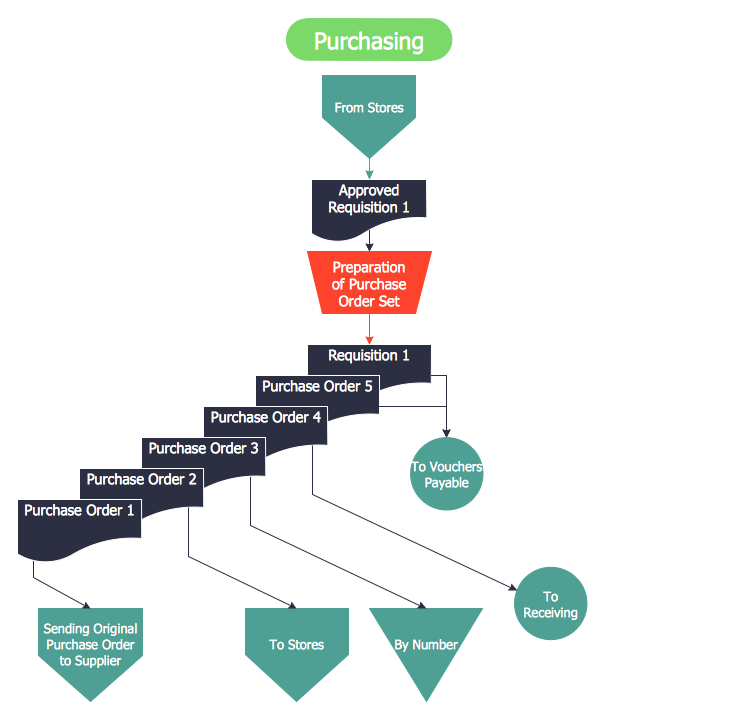
Picture: Steps of Accounting Cycle
Related Solution:
Account Flowchart Stockbridge System
Flowchart Examples →
Once you decide to create a flowchart mentioning all the processes , you can always use well as professionally software — ConceptDraw
Picture:
Account Flowchart Stockbridge System
Flowchart Examples
Related Solution:
ConceptDraw the easy flowchart software that gives users the ability to draw any type of flowcharts. Fast visualization of the structured data with the vector stencils from object libraries by using RapidDraw technology.
Picture: Easy Flowchart Software
Related Solution:
While creating flowcharts and process flow diagrams, you should use special objects to define different statements, so anyone aware of flowcharts can get your scheme right. There is a short and an extended list of basic flowchart symbols and their meaning. Basic flowchart symbols include terminator objects, rectangles for describing steps of a process, diamonds representing appearing conditions and questions and parallelograms to show incoming data.
This diagram gives a general review of the standard symbols that are used when creating flowcharts and process flow diagrams. The practice of using a set of standard flowchart symbols was admitted in order to make flowcharts and other process flow diagrams created by any person properly understandable by other people. The flowchart symbols depict different kinds of actions and phases in a process. The sequence of the actions, and the relationships between them are shown by special lines and arrows. There are a large number of flowchart symbols. Which of them can be used in the particular diagram depends on its type. For instance, some symbols used in data flow diagrams usually are not used in the process flowcharts. Business process system use exactly these flowchart symbols.
Picture: Flowchart Symbols: Meaning and Examples
Related Solution:
This sample shows the Pie Donut Chart. It was created in ConceptDraw DIAGRAM diagramming and vector drawing software using the ready-to-use object from the Pie Charts Solution from Graphs and Charts area of ConceptDraw Solution Park.
The Pie Donut Chart visualizes the percentage of parts of the whole and looks like as a ring divided into sectors. Pie Donut Charts are widely used in the business, statistics, analytics, mass media.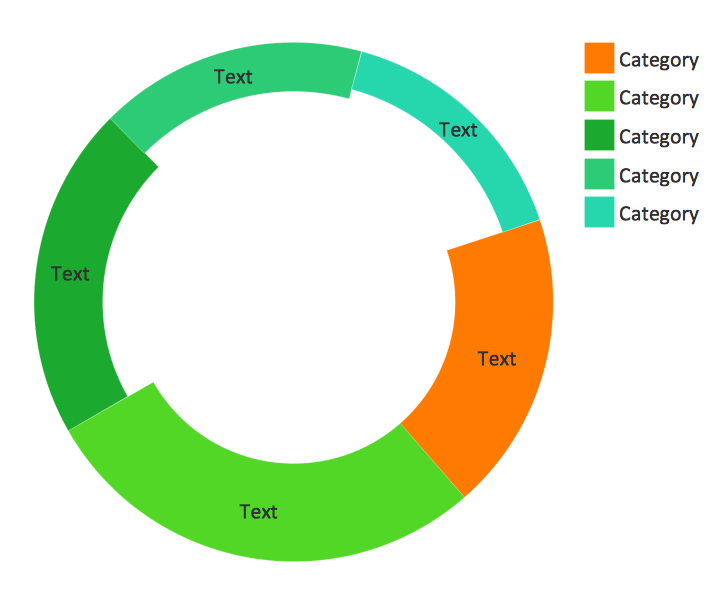
Picture: Pie Donut Chart. Pie Chart Examples
Related Solution:


