Workflow to Make a Purchase.
Accounting Flowchart Example
Flowchart
Accounting flowchart is a pictorial representation of the flow of transactions process in a specific area of the accounting and financial department.
- Analyzing complex processes
- Designing complex processes
- Documenting complex processes
- Managing complex processes
- Representing process operations
- Showing the steps
If you need to know how Purchasing Workflow Chart looks like, the Accounting Flowcharts Solution for ConceptDraw DIAGRAM software has a standardized symbols, samples and template of the flowcharts representing such processes like a receiving process, purchasing process, payment process, etc.

Example 1. Standardized Symbols Used in The Accounting Flowchart
You can start with sample and change it for your needs after the resulting document shows how well does purchasing process flow at the company.

Example 2. Accounting Flowchart Example
This sample flowchart shows a purchasing process flow. The accounting process consists of accounting cycles. What is an accounting cycle? It is a sequence of steps or stages that occur in the defined period of time during the accounting process. These steps of the accounting cycle lead to problems being solved, it's necessary to accurately follow them.

Example 3. Flowchart - purchasing
Accounting Flowcharts solution from ConceptDraw Solution Park provides templates, samples and library of vector shapes for drawing the Accounting Process Flowcharts.
Use ConceptDraw DIAGRAM with Accounting Flowcharts solution to document and communicate visually how accounting processes work, and how each operation is done.
TEN RELATED HOW TO's:
ConceptDraw MINDMAP extended with Presentation Exchange solution allows you to create a traditional PowerPoint Presentation from your mind maps.
Picture: Export from ConceptDraw MINDMAP to PowerPoint® Presentation
Create bar charts for visualizing problem solving in manufacturing and economics using the ConceptDraw DIAGRAM diagramming and vector drawing software extended with the Bar Graphs Solution from the Graphs and Charts area of ConceptDraw Solition Park.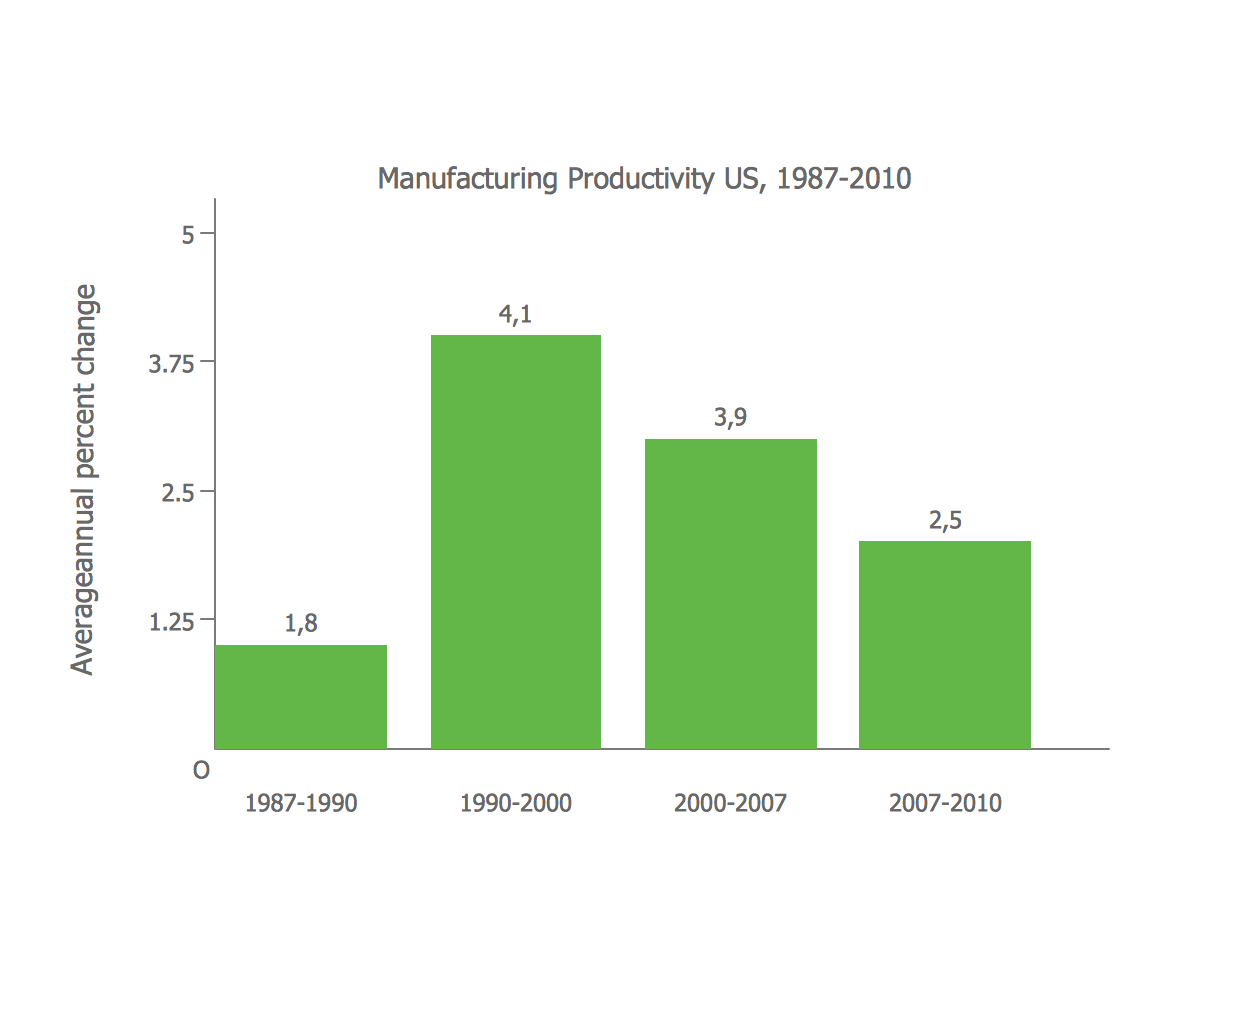
Picture: Bar Diagrams for Problem Solving. Create manufacturing and economics bar charts with Bar Graphs Solution
Related Solution:
Use ConceptDraw DIAGRAM diagramming and business graphics software to draw your own flowcharts of computer algorithms.
Picture: Process Flow app for macOS
Related Solution:
Process Flow Chart is a visual illustration of overall flow of activities in producing a product or service. How do you make a Process Flow Chart usually? Drawing process flow charts, diagrams and maps is quite complex and lengthy process, especially if you draw free-hand. But now thanks to the ConceptDraw DIAGRAM diagramming and vector drawing software extended with Flowcharts solution from the Diagrams area of ConceptDraw Solution Park this process became simple and fast. A confirmation of this can serve many Process Flow Chart examples included in Flowcharts solution.
Picture: Process Flow Chart Examples
Related Solution:
The vector stencils library Rail transport contains clipart of railway transport for ConceptDraw DIAGRAM diagramming and vector drawing software.
Use it to draw illustrations of trains and transportation of passengers and goods by railroads.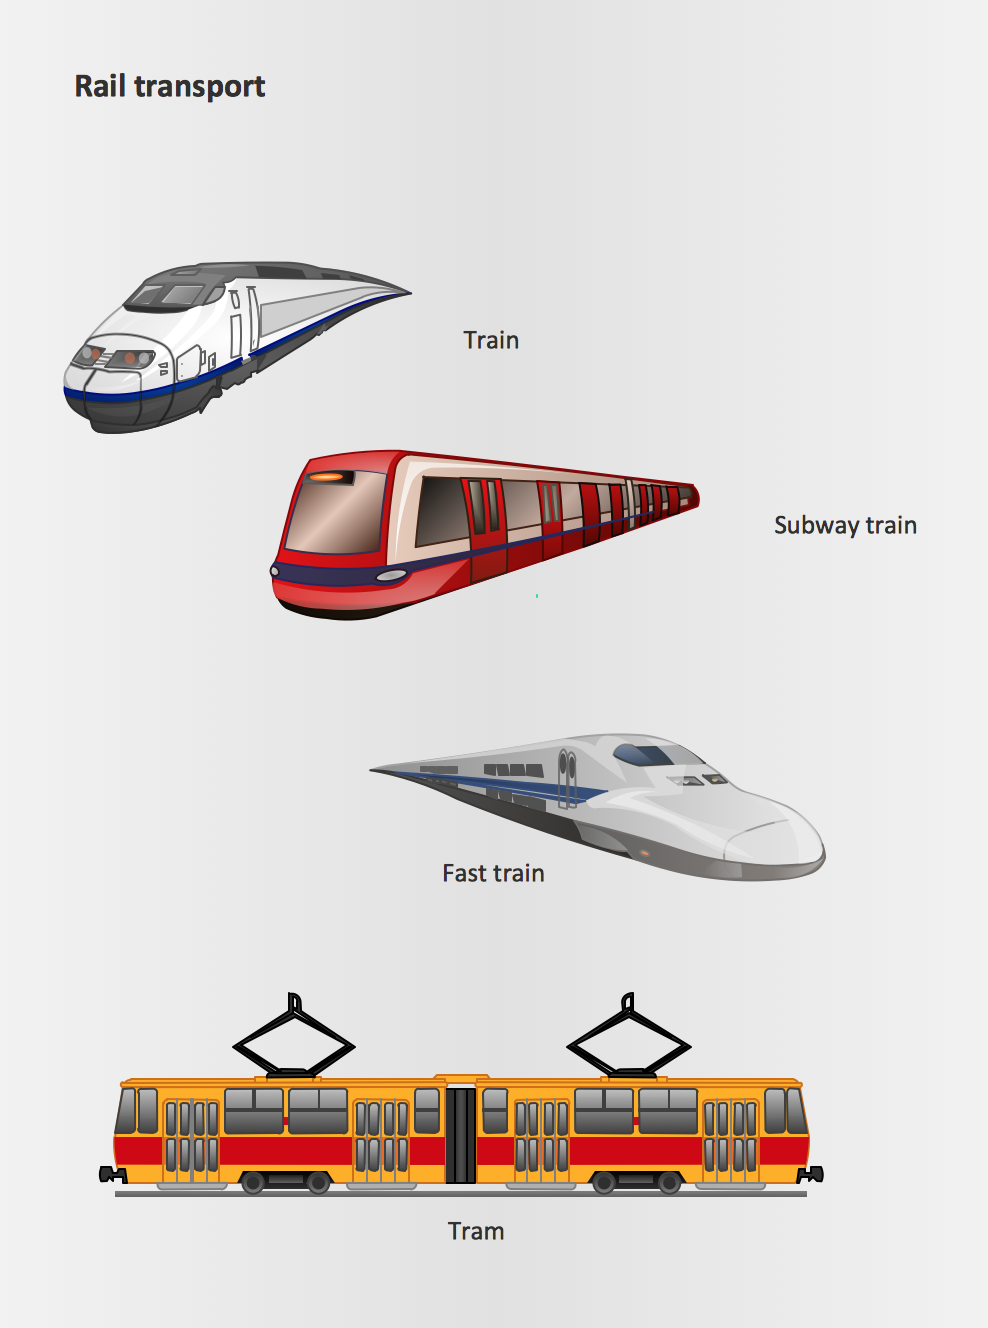
Picture: Rail transport - Design elements
Related Solution:
The Nature Solution addition to ConceptDraw Solution Park for ConceptDraw DIAGRAM includes new libraries that provide a wide range nature objects and it can be used in many areas.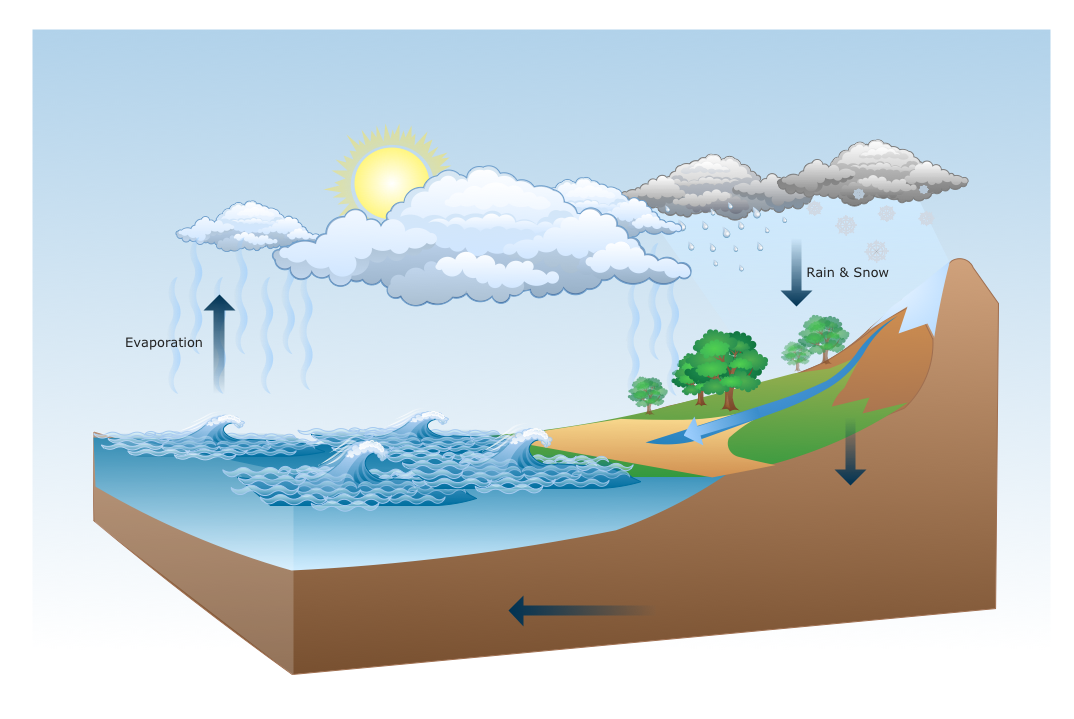
Picture: Drawing Illustration
UML for Bank - This sample was created in ConceptDraw DIAGRAM diagramming and vector drawing software using the UML Class Diagram library of the Rapid UML Solution from the Software Development area of ConceptDraw Solution Park.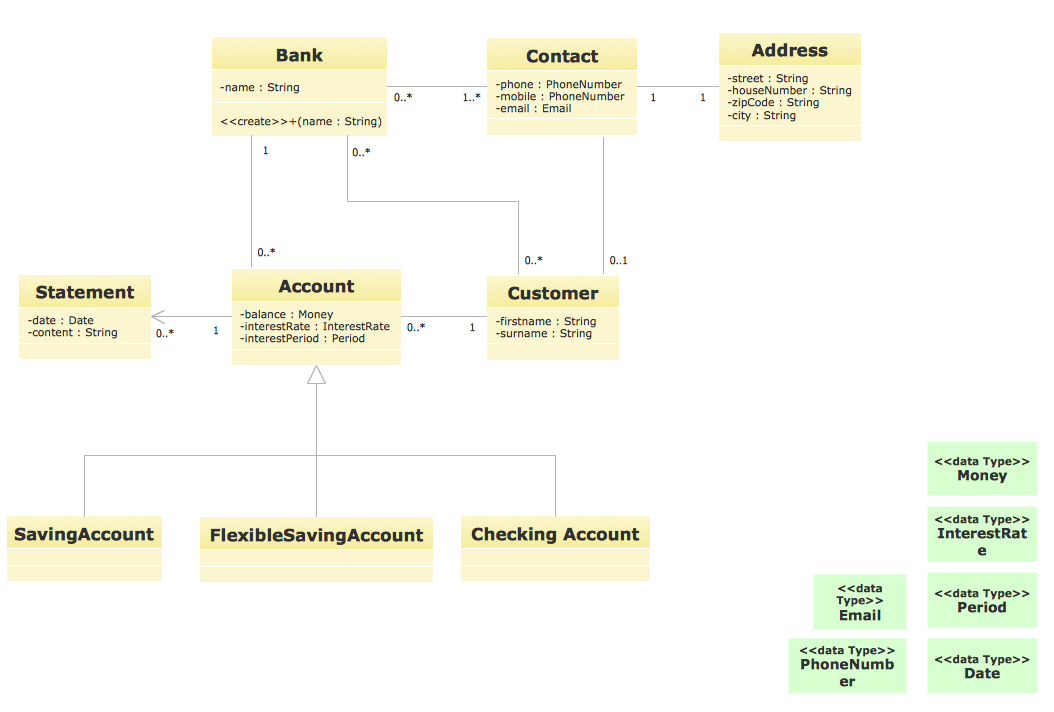
Picture: UML for Bank
Related Solution:
ConceptDraw RapidDraw DIAGRAM helps create visually document and communicate Business Process (BPMN 2.0) information.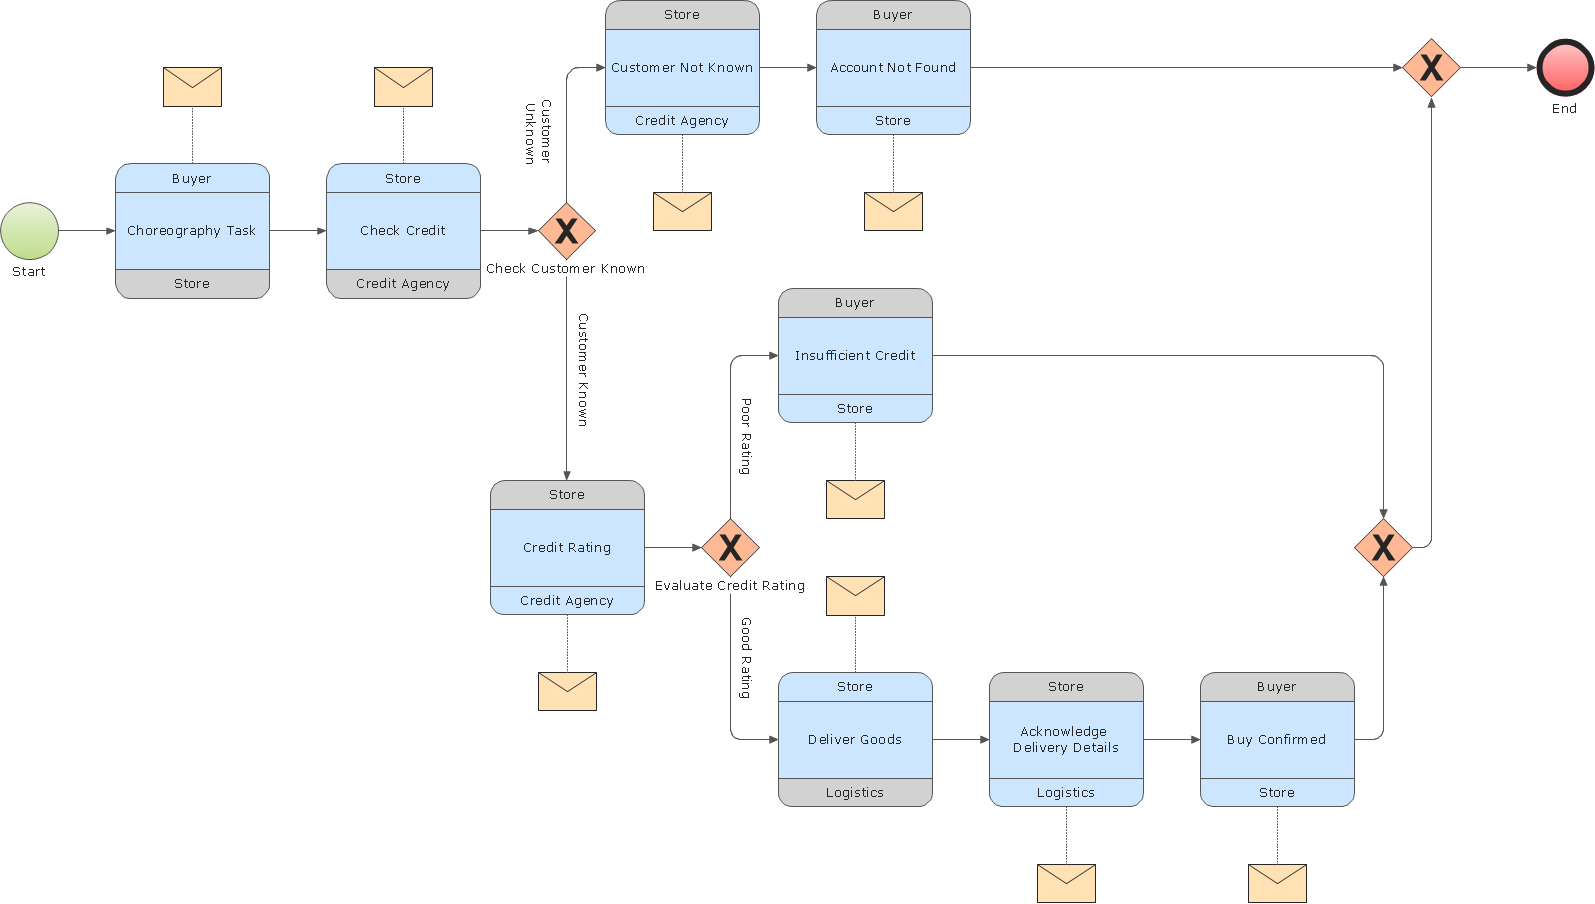
Picture: Business Process Modeling
Create your own flow charts of settlement processes using the ConceptDraw DIAGRAM diagramming and vector drawing software extended with the Cross-Functional Flowcharts solution from the Business Processes area of ConceptDraw Solution Park.
Download easy flowchart software to create settlement process flowcharts show steps of monthly settlement with your business quickly and easily.
Picture: Settlement Process Flowchart. Flowchart Examples
Related Solution:
Structured-systems analysis and design method uses data flow diagrams to represent the process of data flowing through a system. Talking about this might be useless without a proper example of DFD for online store (Data Flow Diagram). This DFD example shows all the distinctness that a diagram can bring into a scattered data structure.
Data flow diagrams are used to show how data is processed within some business processes. Making DFD is a common practice for business process modeling and analysis. This diagram represents the online store business flow. It describes inputs and outputs within online selling process and depicts the interactions between its participants. This DF diagram can be used by system analysts to create an overview of a business, to study and discover its inherent strengths and weak points.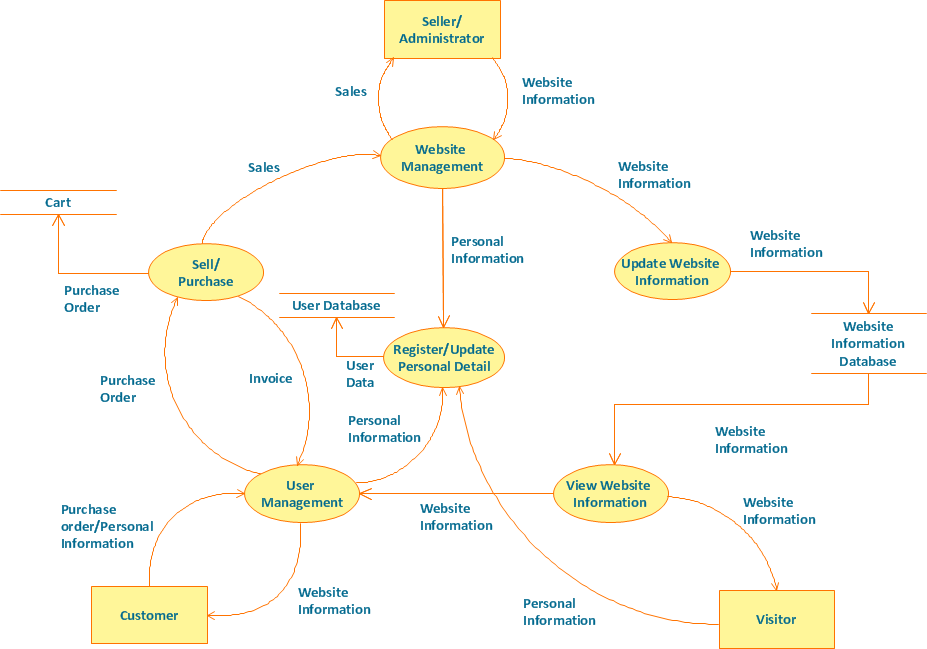
Picture: Example of DFD for Online Store (Data Flow Diagram)
Related Solution:

