Android GUI
Android is an operating system based on the Linux kernel and developed by Google for smartphones, tablet computers, electronic books, netbooks, smartbooks, digital players, watches, game consoles, TV and other devices.
ConceptDraw DIAGRAM extended with Android User Interface Solution from the Software Development Area is a powerful software with extensive drawing tools which can help you to build the intelligible, attractive and easy for perception Android GUI for your application.

Example 1. Android GUI - Android 5.0 App Drawer
The components which compose the graphic user interface are specific for each operating system, and Android is not exception. Android has many own features that make it diverse from iOS and other mobile platforms. Android User Interface Solution provides 30 libraries with 1088 Android GUI vector objects.
These 30 libraries contains all objects needed for drawing unique Android GUI - app icons, wallpapers, menu items, buttons, switches, sliders, text fields, dialogs, and more other Android GUI design elements.

Example 3. Android GUI - Android 5.0 Lock Screen Notifications
The Android GUI samples you see on this page were created in ConceptDraw DIAGRAM using the tools of Android User Interface Solution. These samples demonstrate solution's capabilities and the professional results you can achieve. An experienced user spent 10 minutes creating each of them.
Use Android User Interface solution for designing your own Android GUI quick, easy and effective.
All source documents are vector graphic documents. They are available for reviewing, modifying, or converting to a variety of formats (PDF file, MS PowerPoint, MS Visio, and many other graphic formats) from the ConceptDraw STORE. The Android User Interface Solution is available for all ConceptDraw DIAGRAM or later users.
TEN RELATED HOW TO's:
Create a Pie Chart with ConceptDraw software quickly and easily. The simple tutorial helps you learn how to create a pie chart.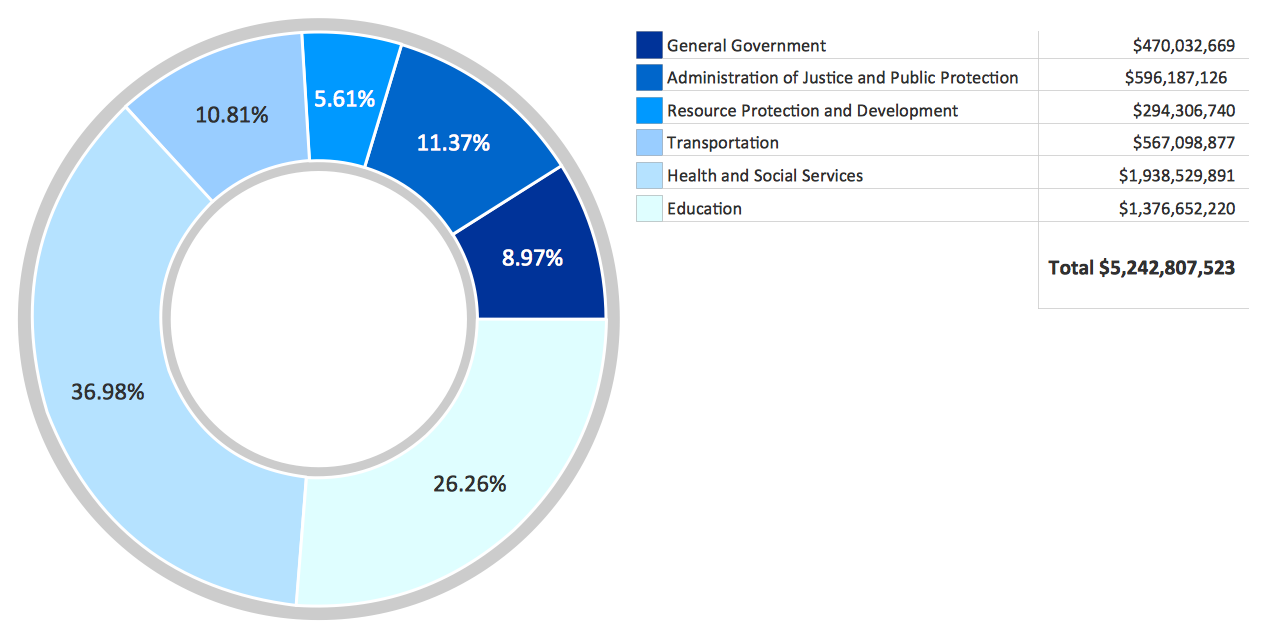
Picture: How to Create a Pie Chart
Related Solution:
Computer networks nowadays are spread all across the world. The large number of parameters, such as geographic scale or communication protocols, can divide networks. One of the most common types of networks is called local area network (LAN). It convenient to represent network examples by means of diagrams.
This local area network (LAN) diagram provides an easy way to see the way the devices in a local network are interacted. The diagram uses a library containing specific symbols to represent network equipment , media and the end-user devices such as computers (PC, mac, laptop) , network printer, hubs, server and finally a modem. There are two types of network topologies: physical and logical. The current diagram represents precisely a physical type of LAN topology because it refers to the physical layout of a local network equipment.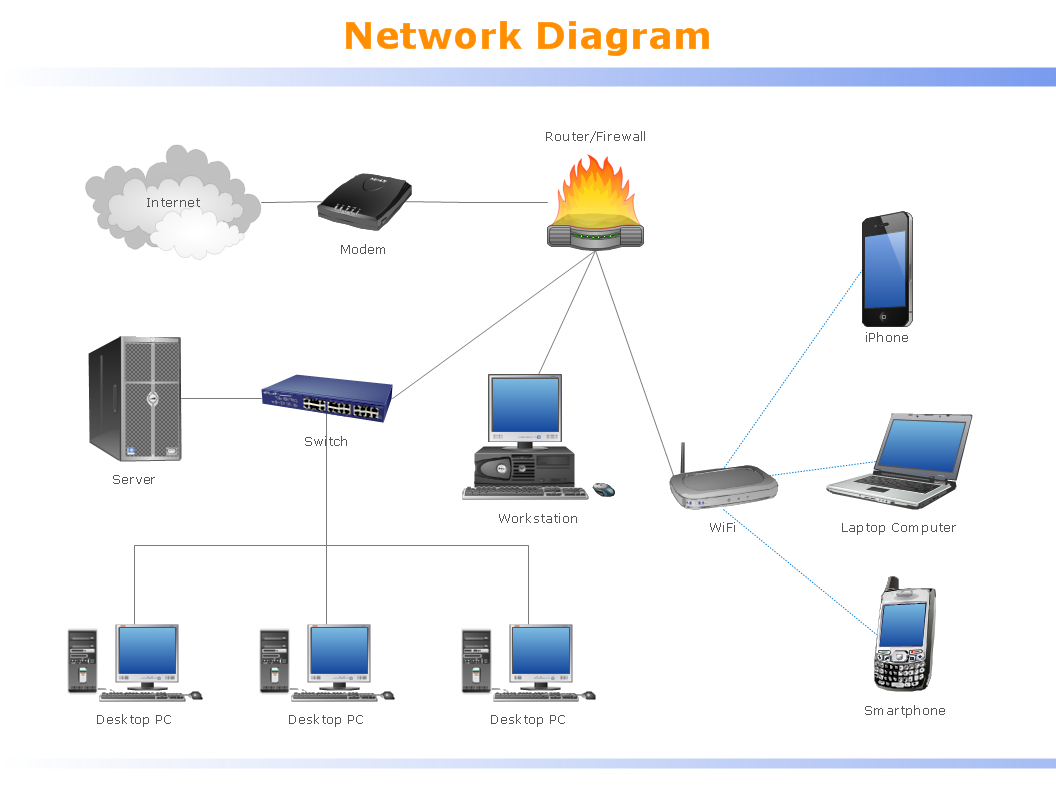
Picture:
What is a Local Area Network?
Examples of LAN Diagrams
Related Solution:
Basketball is a popular sport played by two teams of five players with a ball. The game takes place on a rectangular court. The team goal is to score a ball into the basket of the opponent team. The team with the most points wins the game.
ConceptDraw DIAGRAM diagramming and vector drawing software extended with Basketball solution from the Sport area of ConceptDraw Solution Park is a very useful tool for designing the basketball-related diagrams of any complexity.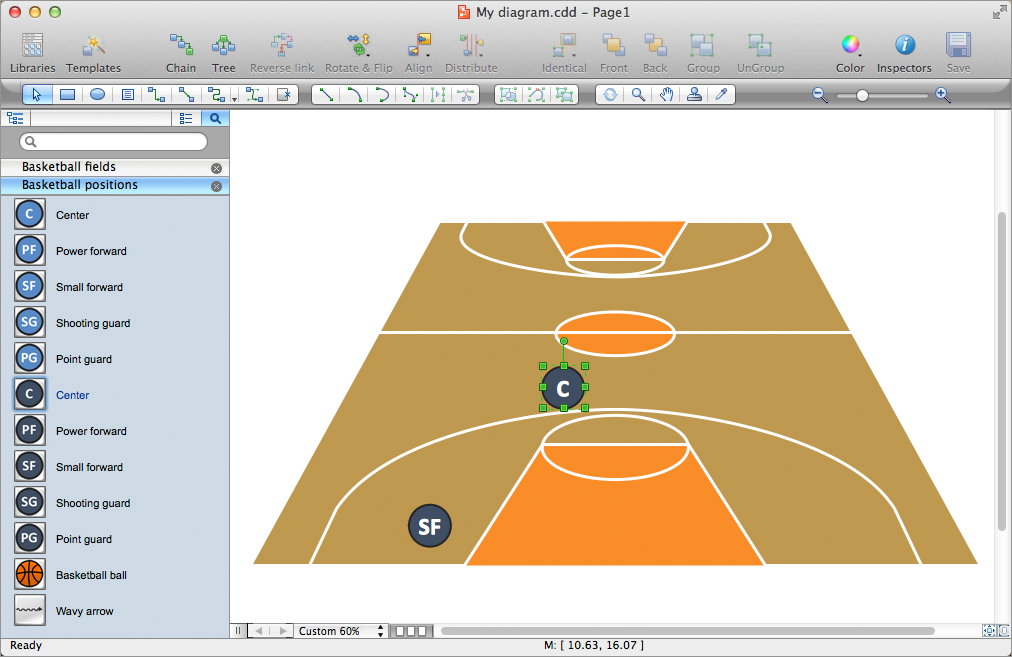
Picture: Basketball Plays Software
Related Solution:
How To Draw an iPhone? It's very fast and easy to draw an iPhone and design iPhone user interface using the tools of ConceptDraw DIAGRAM extended with iPhone User Interface Solution. iPhone User Interface Solution offers you the incredibly large quantity of predesigned objects that are grouped to 9 libraries: Apps Icons, Bars, Content Views, Controls, iMessage, iPhone 6 Mockup, Tab Bar Icons, Temporary Views, Toolbar and Navigation Bar Buttons.
Picture: How To Draw an iPhone?
Related Solution:
The Accounting flowchart shows how information flows from source documents through the accounting records. The are based on the accounting procedures or processes.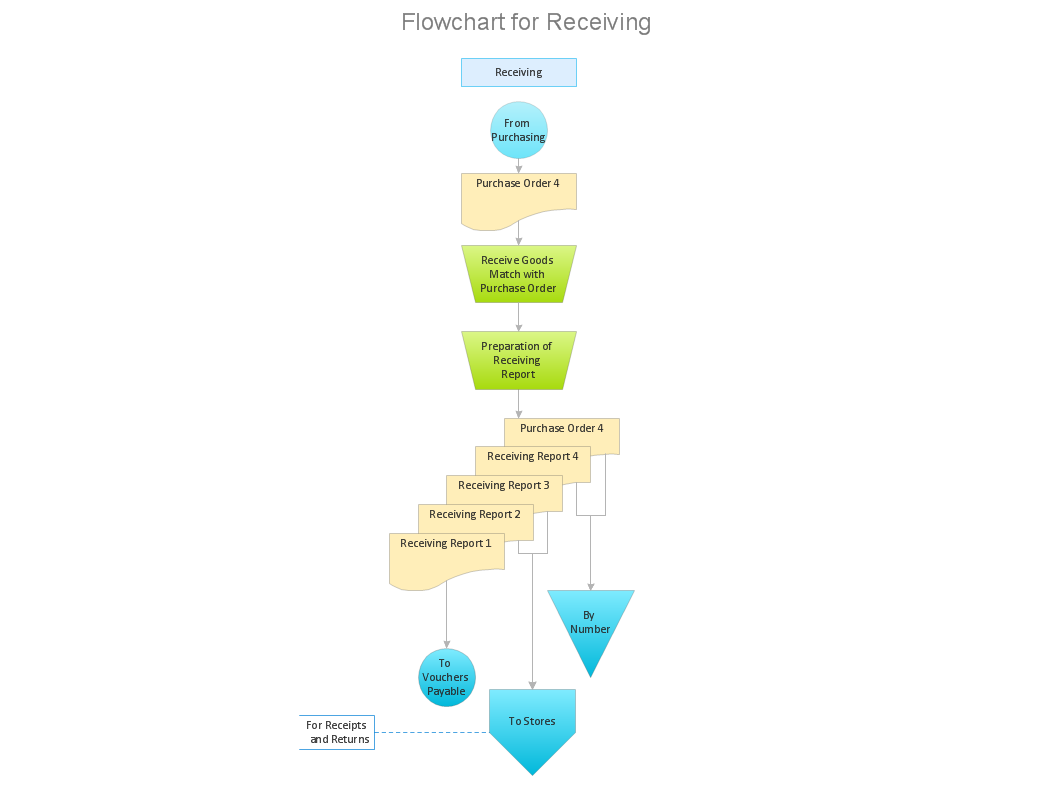
Picture: What process should be essentially adopted.Accounting Flowchart Example
Related Solution:
Representation of healthy food ideas and designing illustrations for healthy food recipes, decoration healthy diet plan and drawing healthy foods images has never been easier than now thanks to the ConceptDraw DIAGRAM diagramming and vector drawing software enhanced with Health Food solution from the Food and Beverage area of ConceptDraw Solution Park.
Picture: Healthy Food Ideas
Related Solution:
Digital electronics or digital (electronic) circuits are electronics that handle digital signals – discrete bands of analog levels – rather than by continuous ranges (as used in analogue electronics). All levels within a band of values represent the same numeric value. Because of this discretization, relatively small changes to the analog signal levels due to manufacturing tolerance, signal attenuation or parasitic noise do not leave the discrete envelope, and as a result are ignored by signal state sensing circuitry.
26 libraries of the Electrical Engineering Solution of ConceptDraw DIAGRAM make your electrical diagramming simple, efficient, and effective. You can simply and quickly drop the ready-to-use objects from libraries into your document to create the electrical diagram.
Picture: Electrical Symbols — Analog and Digital Logic
Related Solution:
While creating flowcharts and process flow diagrams, you should use special objects to define different statements, so anyone aware of flowcharts can get your scheme right. There is a short and an extended list of basic flowchart symbols and their meaning. Basic flowchart symbols include terminator objects, rectangles for describing steps of a process, diamonds representing appearing conditions and questions and parallelograms to show incoming data.
This diagram gives a general review of the standard symbols that are used when creating flowcharts and process flow diagrams. The practice of using a set of standard flowchart symbols was admitted in order to make flowcharts and other process flow diagrams created by any person properly understandable by other people. The flowchart symbols depict different kinds of actions and phases in a process. The sequence of the actions, and the relationships between them are shown by special lines and arrows. There are a large number of flowchart symbols. Which of them can be used in the particular diagram depends on its type. For instance, some symbols used in data flow diagrams usually are not used in the process flowcharts. Business process system use exactly these flowchart symbols.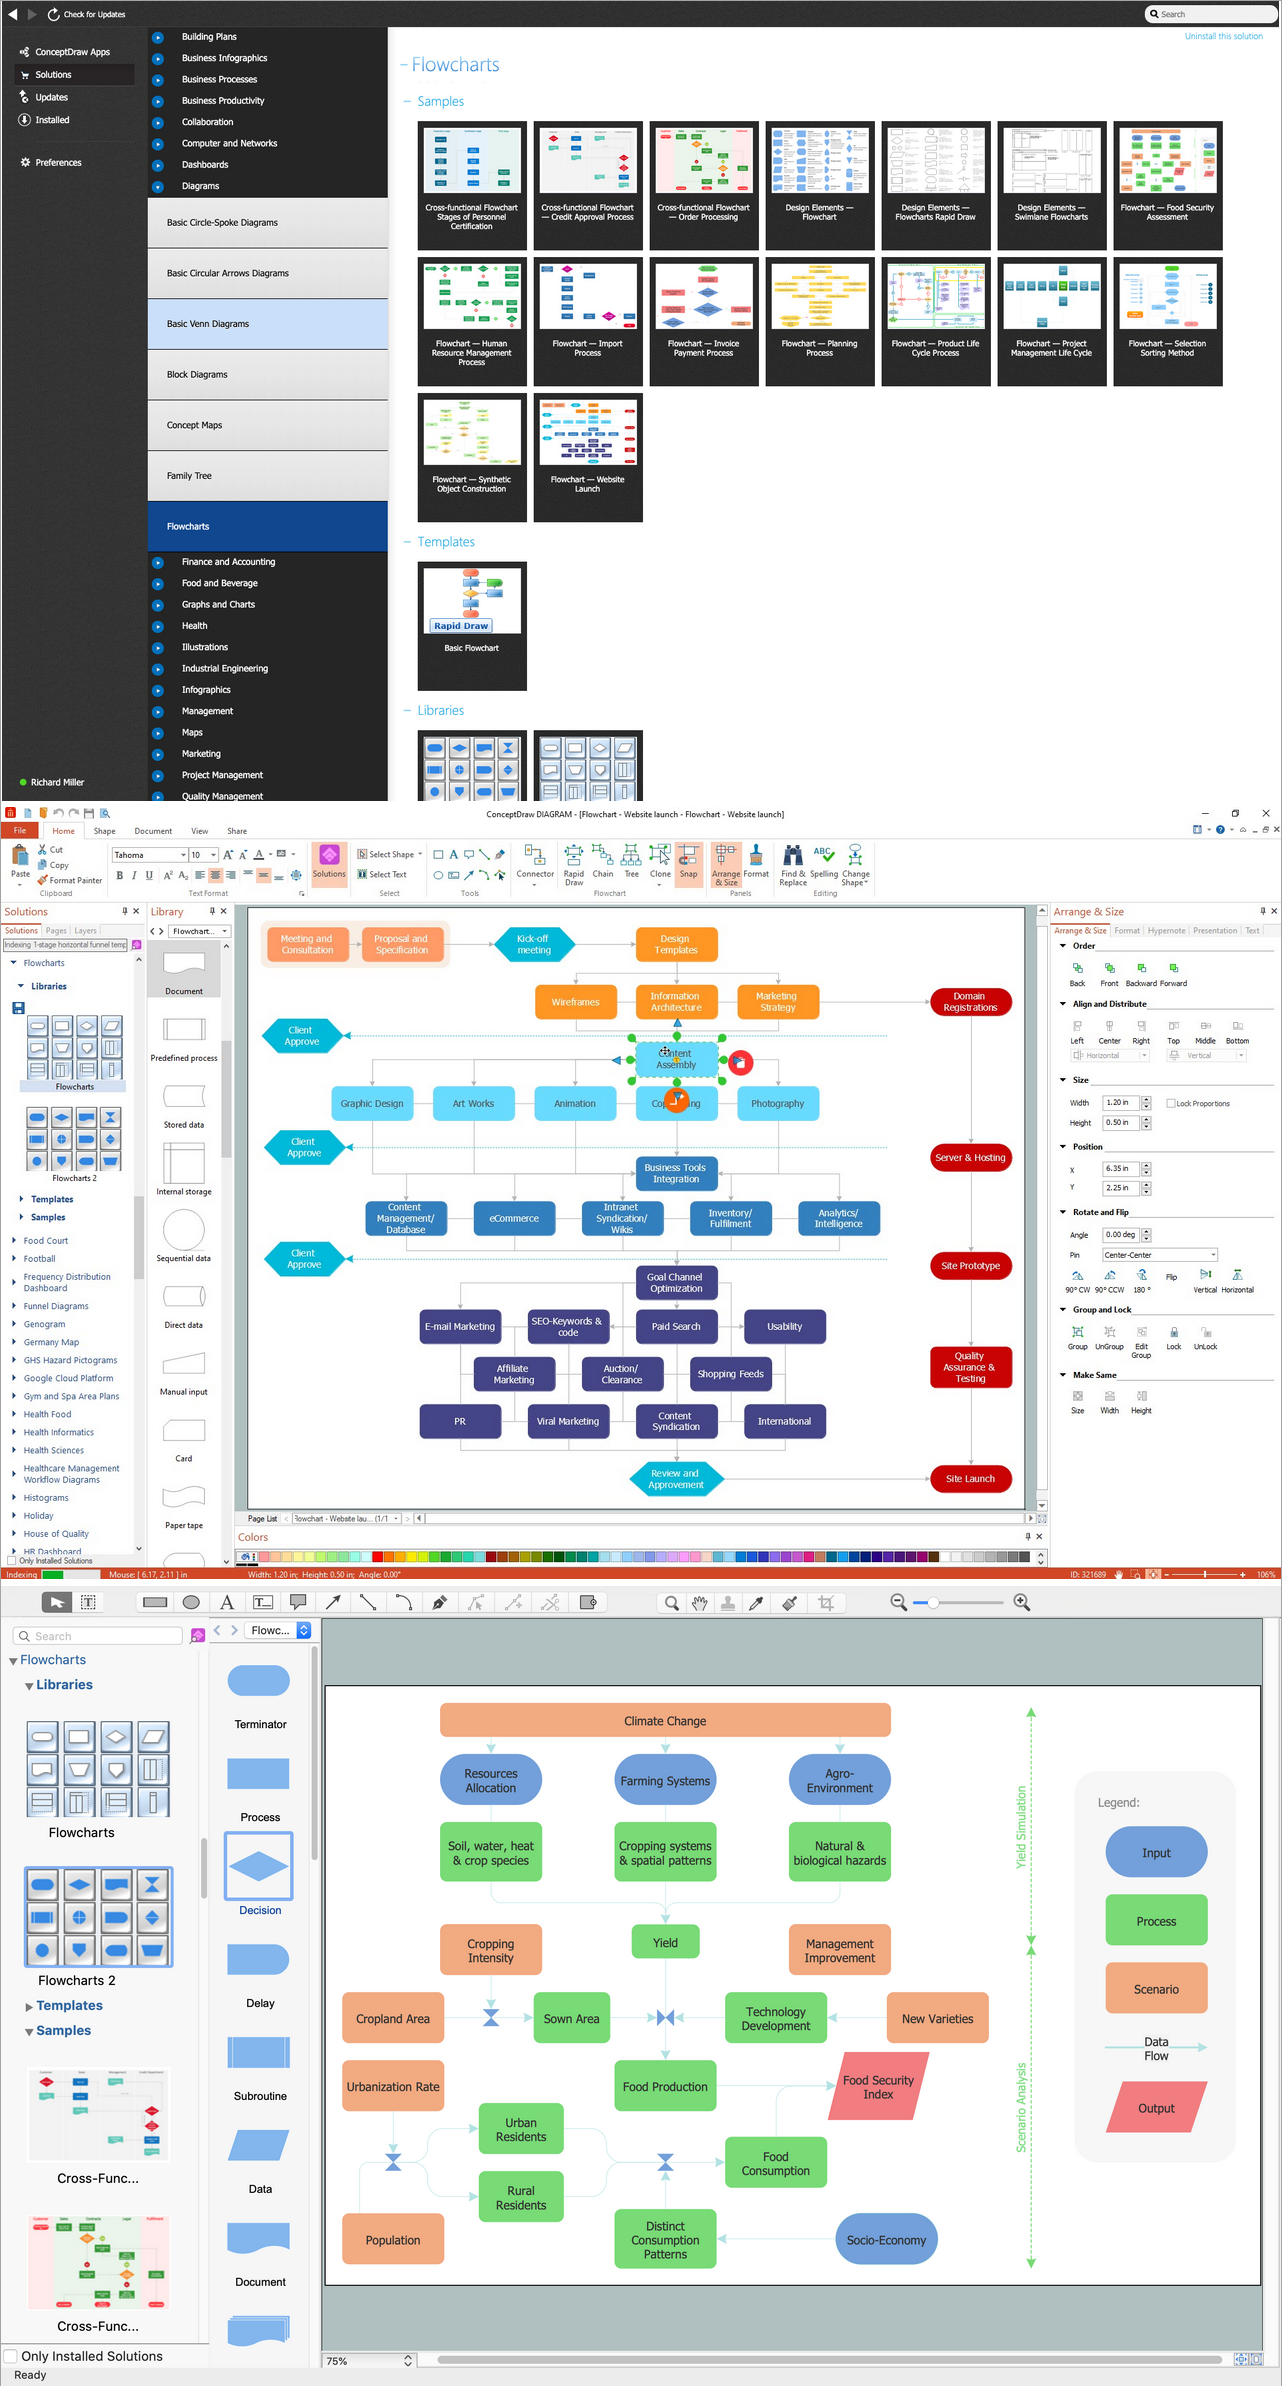
Picture: Basic of Flowchart: Meaning and Symbols
Related Solution:


