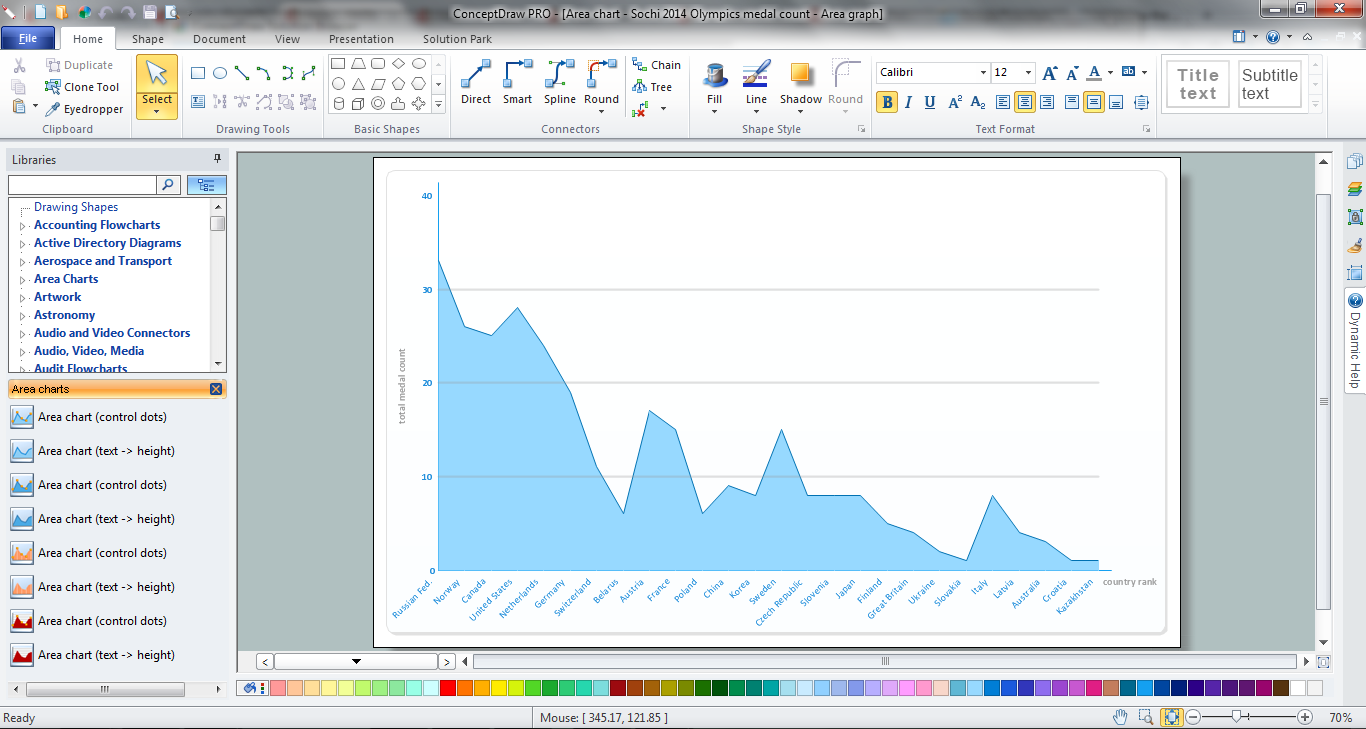
Example 1. Area Chart in ConceptDraw DIAGRAM
How is it easy create the Area Chart in ConceptDraw DIAGRAM Just a few movements - drag the predesigned graph object from the Area Charts library to your document and simply set your values. And professional looking, visual and clear Area Chart will be completed.

Example 2. Area Charts Library — Design Elements
Area Charts Solution provides also wide variety of templates and samples of professional looking Area Charts. They are represented in ConceptDraw STORE.

Example 3. Area Charts Solution in ConceptDraw STORE
You can choose the any favourite Area Chart from the ConceptDraw STORE. All they are available for opening, viewing and editing.

Example 3. Area Chart — San Francisco CA Population Growth
This Area Chart was created in ConceptDraw DIAGRAM using the Area Charts solution from Graphs and Charts area and shows how a population in San Francisco grew over the time. An experienced user spent 15 minutes creating this sample.
The Area Chart designed with ConceptDraw DIAGRAM is vector graphic documents and is available for reviewing, modifying, converting to a variety of formats (image, HTML, PDF file, MS PowerPoint Presentation, Adobe Flash or MS Visio), printing and send via e-mail in one moment.
EIGHT RELATED HOW TO's:
A Picture Graph is a popular and widely used type of a bar graph, which represents data in various categories using the pictures.
Picture: Picture Graph
Related Solution:
It's one of the most useful way which allows explain the information, statistical data in a visual form using the pictures.
Picture: What Is a Picture Graph?
Related Solution:
When thinking about data visualization, one of the first tools that comes to mind is a flowchart design. You can find flowchart symbols, shapes, stencils and icons easily on the Internet, but it might take time to systematize this information. Nevertheless, once you start flowcharting, you’ll love its simplicity and efficiency.
This diagram consists from standard flowchart symbols, approved by ANSI (American National Standard Institute) for drawing flowcharts. A flowchart is a diagram that represents a step-by-step algorithm of any process, displaying the process stages as boxes that are connected with arrows. Flowchart design makes it clear and readable.
Flowchart designed using ConceptDraw DIAGRAM flowchart software allows to make attractive and clear process presentation, it makes interpretation of the business process flow fresh and versatile. Great flowchart design view is a big advantage over the diagram created manually on a paper.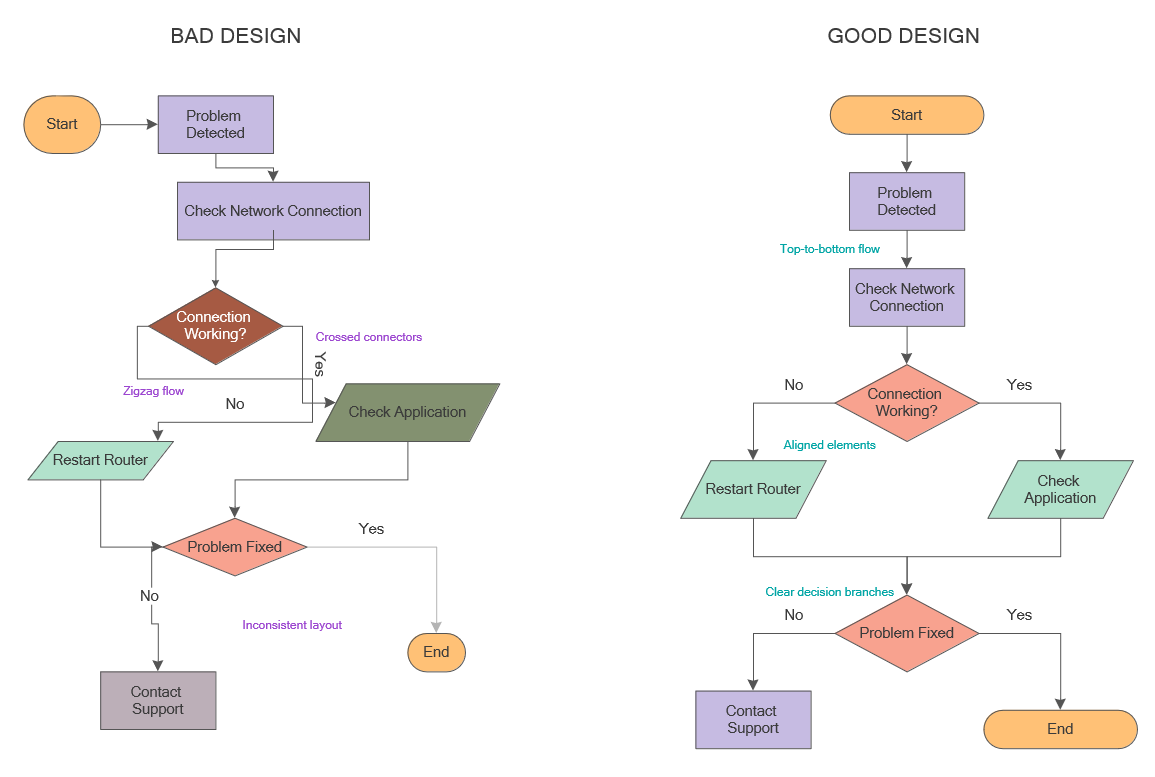
Picture: Flowchart Design: Principles, Layout, Symbols and Best Practices
Related Solution:
Infographic is a visual way of representing various information, data, knowledge in statistics, geography, journalism, education, and much more areas. ConceptDraw DIAGRAM supplied with Pictorial Infographics Solution from the “Infographics” Area, provides a set of powerful pictorial infographics tools. Thanks to them it is the best Infographic Maker.
Picture: Infographic Maker
Related Solution:
The Saarland is one of the sixteen federal states (or Bundesländer) of Germany. The capital city is Saarbrücken.
Despite the fact that the maps surround us everywhere in our life, usually the process of their drawing is sufficienly complex and labor-intensive. But now, thanks to the ConceptDraw DIAGRAM diagramming and vector drawing software extended with Germany Map Solution from the Maps Area of ConceptDraw Solution Park, we have the possibility to make easier this process. Design fast and easy your own pictorial maps of Germany, map of Germany with cities, and thematic Germany maps in ConceptDraw DIAGRAM!
Picture: Map of Germany — Saarland State
Related Solution:
The Line Graphs solution from Graphs and Charts area of ConceptDraw Solution Park contains a set of examples, templates and design elements library of line and scatter charts. Use it to draw line and scatter graphs using ConceptDraw DIAGRAM diagramming and vector drawing software for illustrating your documents, presentations and websites.
Picture: Line Chart Examples
Related Solution:
ConceptDraw DIAGRAM software extended with Picture Graphs solution is the best choice for making professional looking pictures of graphs and colorful picture graphs.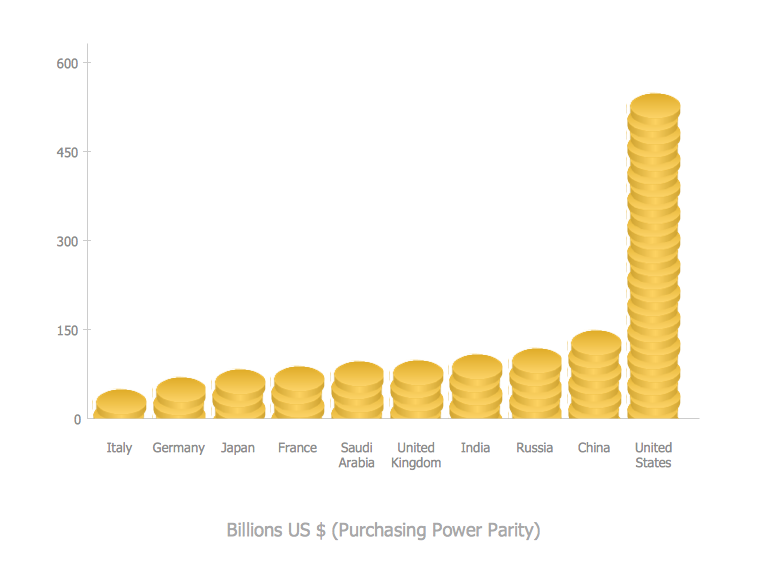
Picture: Pictures of Graphs
Related Solution:
Charting Software allows you to create diagrams, charts, graphs, flowcharts, and other business graphics. ConceptDraw DIAGRAM include simple shape drawing tools, examples, templates, and symbol libraries.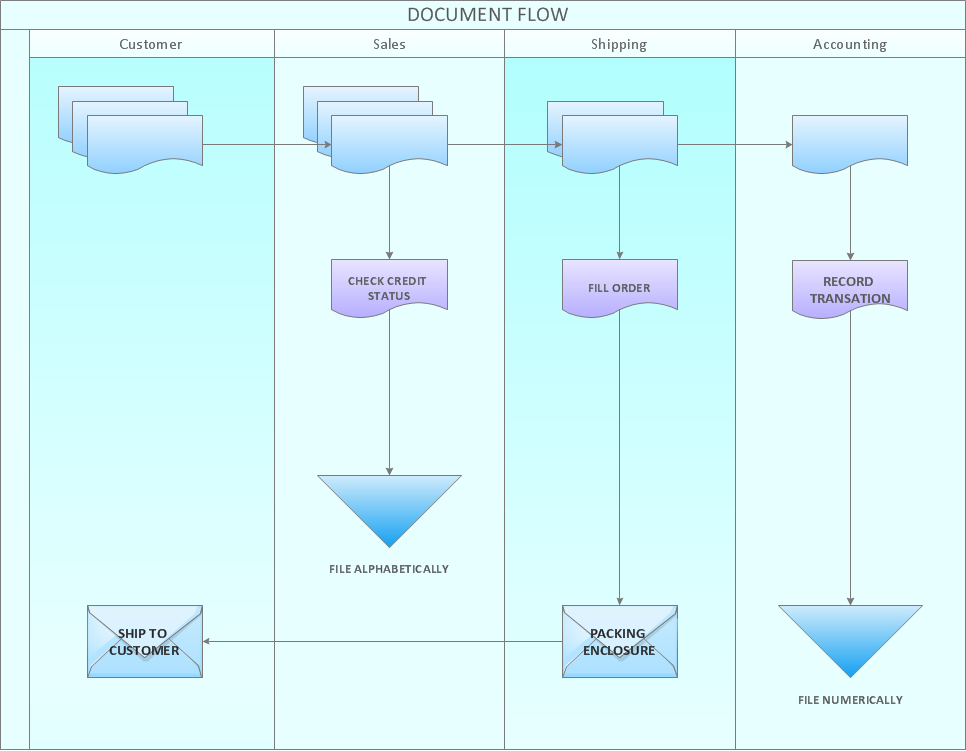
Picture: Create Graphs and Charts
Related Solution:


