
Sample 2. Astronomy Pictures — Natural Hierarchy Rearranged
The library objects are scalable vector images that can be easily exported to PDF format, Microsoft PowerPoint, Microsoft Visio, graphic image file, or HTML.

Sample 3. Astronomy Pictures — Phases of the Moon
The samples you see on this page are astronomy pictures. They were created in ConceptDraw DIAGRAM software using the Astronomy Solution for ConceptDraw DIAGRAM An experienced user spent 10 minutes creating every of these samples.
Use the Astronomy Solution from the Science and Education area to design your own astronomy and astrology illustrations of any complexity quick, easy and effective.
All source documents are vector graphic documents. They are available for reviewing, modifying, or converting to a variety of formats (PDF file, MS PowerPoint, MS Visio, and many other graphic formats) from the ConceptDraw STORE. The Astronomy Solution is available for all ConceptDraw DIAGRAM or later users.
TEN RELATED HOW TO's:
The reliability is a cornerstone for any corporate computer network. If you want to provide a high fault tolerance, a mesh network topology would be the solution. The main advantage of this network is that every node can work as a commutator, although it’s not easy to set up this kind of network.
A mesh network topology may be full, or partial. Full mesh network means that each node of the network (computer, workstation or other equipment) is connected directly to each of the other nodes. A partial mesh topology means that a part of nodes are connected with a whole network, and the other part of nodes are only connected to those equipment, they exchange the majority of data. This illustration shows schematic diagram of a partial mesh network containing six nodes. Each node is represented as a circles and connections are drawn as straight lines. The connections may be both wired and wireless. This scheme can be used to make the specific logical or physical network diagrams by means the ConceptDraw Computer and Networks solution.
Picture: Mesh Network Topology Diagram
Related Solution:
Professional Mind Mapping. ConceptDraw MINDMAP professional software to create documents. Mac and PC compatible. MS Office Exchange Solutions. Skype Collaboration. Presentation Tools.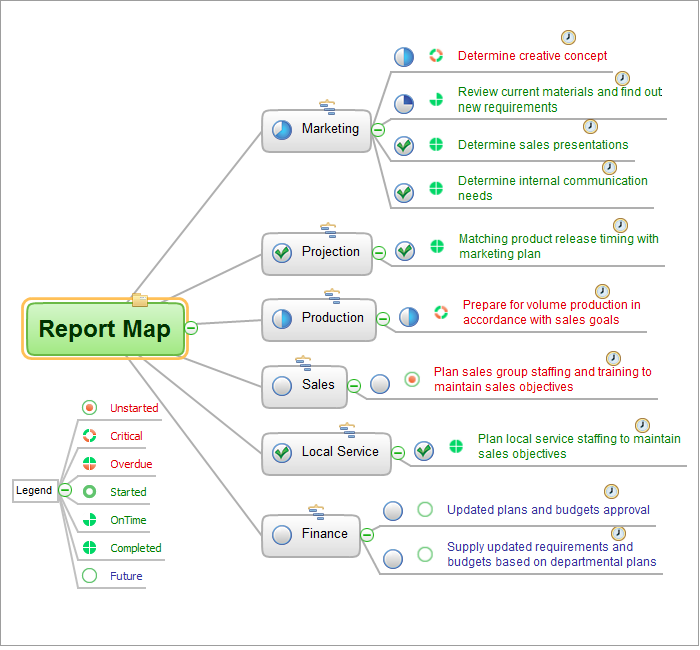
Picture: One formula of professional mind mapping :input data + output data + make great presentation
Related Solution:
The best Entity Relationship Diagram tool for Mac - ConceptDraw DIAGRAM, extebded with the professional ERD drawing solution. The vector graphic diagrams can be drawn by everybody.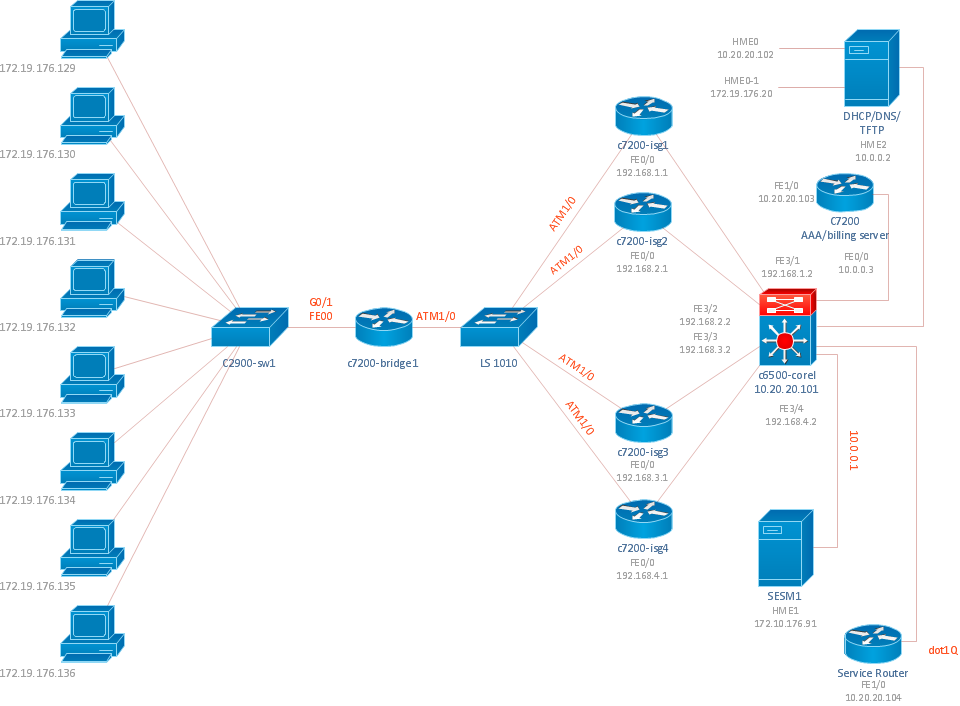
Picture: Diagramming Tool Mac
Astronomy and astrology require from the specialists permanent drawing wide variety of illustrations, sketches. It’s convenient for astronomers and astrologers to have software that will help design them quick and easy. ConceptDraw DIAGRAM diagramming and vector drawing software extended with Astronomy solution from the Science and Education area is exactly what they need.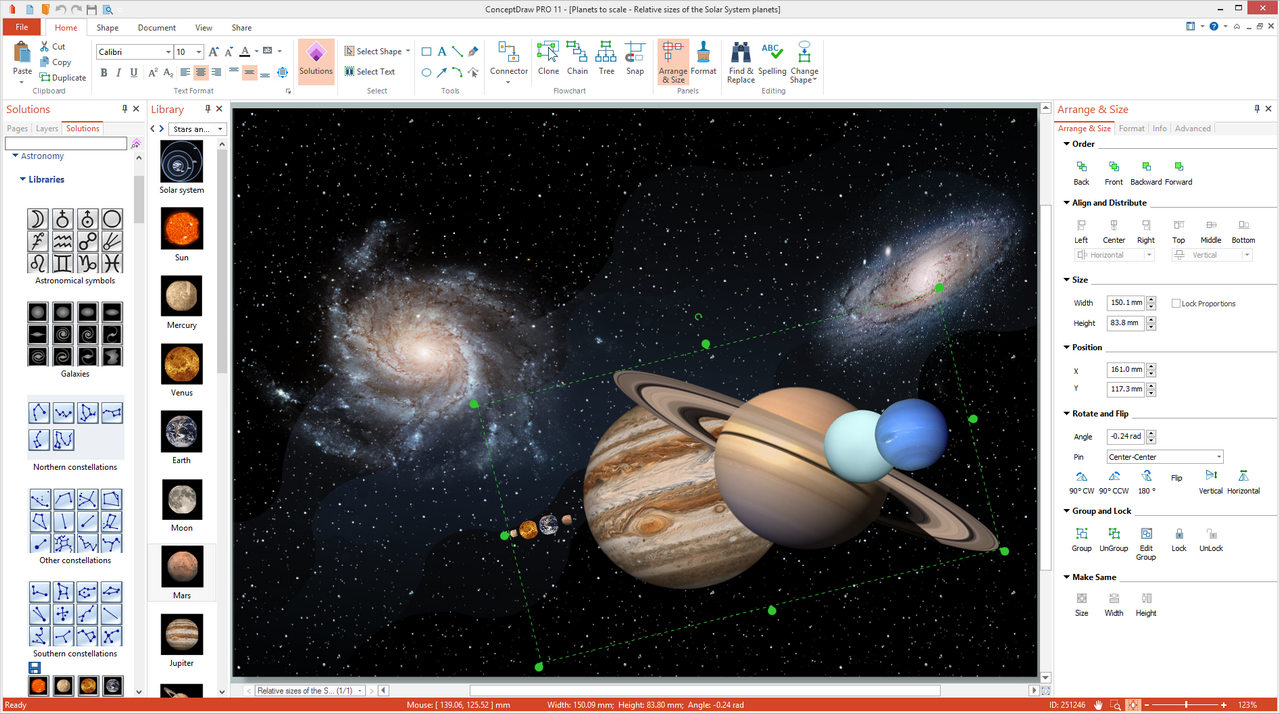
Picture: Astronomy and Astrology
Related Solution:
No science can't exist without illustrations, and especially astronomy! Illustrations help to visualize knowledge, natural phenomenons which are studied by astronomy, they equally effective help in work, during the learning process and on the conferences.
Now we have professional astronomy illustration software - ConceptDraw DIAGRAM illustration and sketching software with templates, samples and libraries of a variety of astronomy symbols, including constellations, galaxies, stars, and planet vector shapes; a whole host of celestial bodies. When drawing scientific and educational astronomy illustrations, astronomy pictures and diagrams, can help you reach for the stars!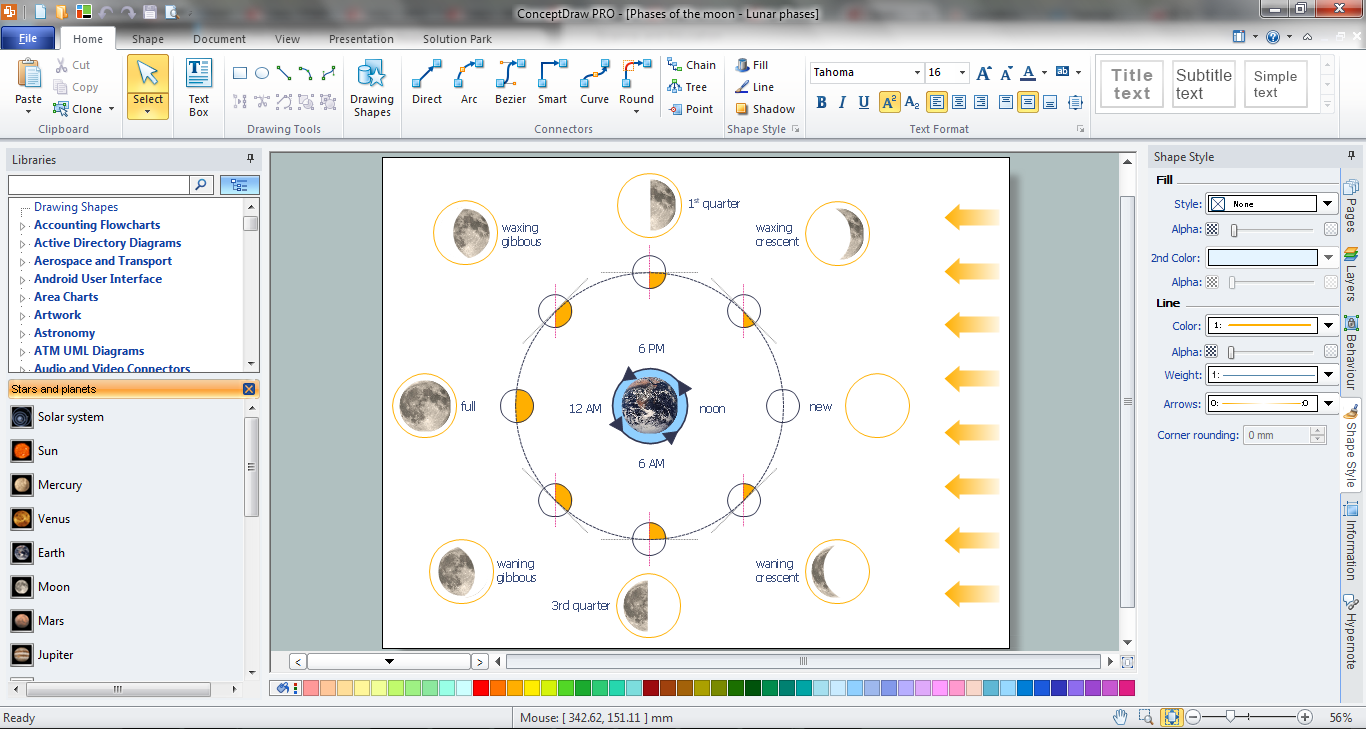
Picture: Illustration Software
Related Solution:
ConceptDraw software has been developed for drawing any type of flowchart. Use RapidDraw - thi is flowchart maker technology for adding new objects to a flowchart quickly. This is technology of fast drawing technique focused on making great-looking flowcharts quickly. To get started using it download flowchart maker ConceptDraw DIAGRAM.
Picture: Flowchart Program Mac
Related Solution:
When thinking about data visualization, one of the first tools that comes to mind is a flowchart design. You can find flowchart symbols, shapes, stencils and icons easily on the Internet, but it might take time to systematize this information. Nevertheless, once you start flowcharting, you’ll love its simplicity and efficiency.
This diagram consists from standard flowchart symbols, approved by ANSI (American National Standard Institute) for drawing flowcharts. A flowchart is a diagram that represents a step-by-step algorithm of any process, displaying the process stages as boxes that are connected with arrows. Flowchart design makes it clear and readable.
Flowchart designed using ConceptDraw DIAGRAM flowchart software allows to make attractive and clear process presentation, it makes interpretation of the business process flow fresh and versatile. Great flowchart design view is a big advantage over the diagram created manually on a paper.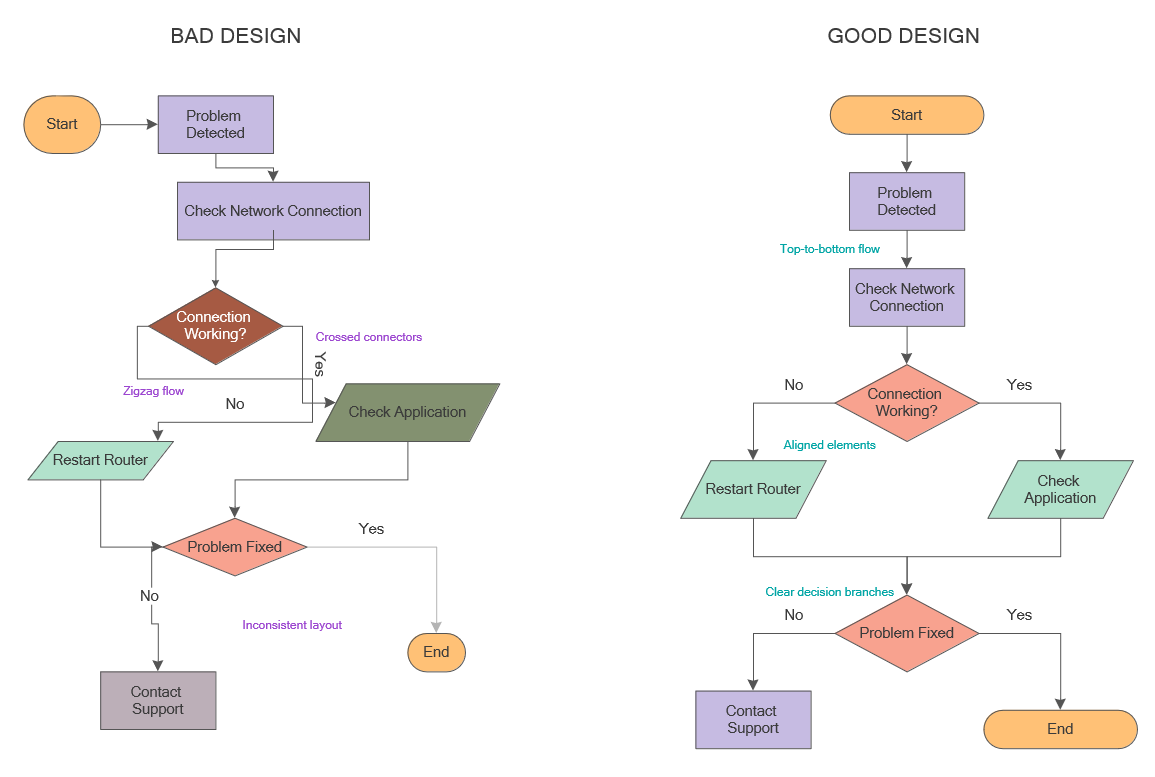
Picture: Flowchart Design: Principles, Layout, Symbols and Best Practices
Related Solution:
ConceptDraw DIAGRAM diagramming and vector drawing software extended with Flowcharts Solution from the 'Diagrams' area of ConceptDraw Solution Park is a powerful tool for drawing Flow Charts of any complexity you need. Irrespective of whether you want to draw a Simple Flow Chart or large complex Flow Diagram, you estimate to do it without efforts thanks to the extensive drawing tools of Flowcharts solution, there are professional flowchart symbols and basic flowchart symbols. This sample shows the Gravitational Search Algorithm (GSA) that is the optimization algorithm.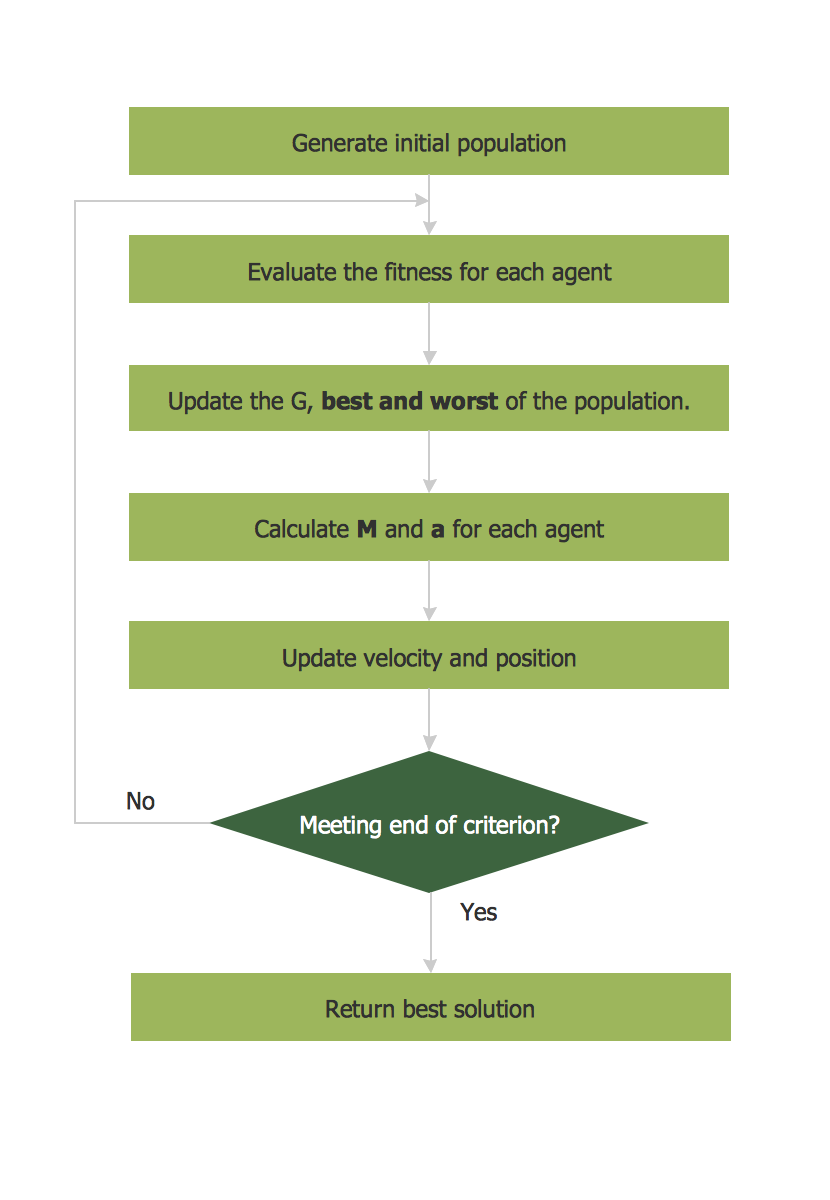
Picture: Simple Flow Chart
Related Solution:
Starting producing workflow diagram from template you save time and avoid the blank page syndrome. At first, the workflow template is set of rules for a workflow. The workflow symbols used in the specific case are part of workflow template. This is the subset of large standard collections of workflow symbols. The first part of workflow template is identification of symbols allowed in use in your specific case. The best way would be to collect them in your customized drawing collection of workflow symbols which used in your specific cases of workflow diagrams. Another way to create business process documents is using business process flow diagram which have similar purposes and have different visual notation.
ConceptDraw DIAGRAM is professional workflow diagram software with the rich extentions from ConceptDraw Solution Park. The basic solution for workflow diagramming is Workflow Diagrams Solution. It delivers a rich set of workflow diagram templates and samples help you draw diagrams e
Picture: Workflow Diagram Template
Related Solution:
Visio Files and ConceptDraw. ConceptDraw DIAGRAM is compatible with MS Visio.VDX formatted files.VDX is Visio’s open XML file format, and it can be easily imported and exported by ConceptDraw DIAGRAM.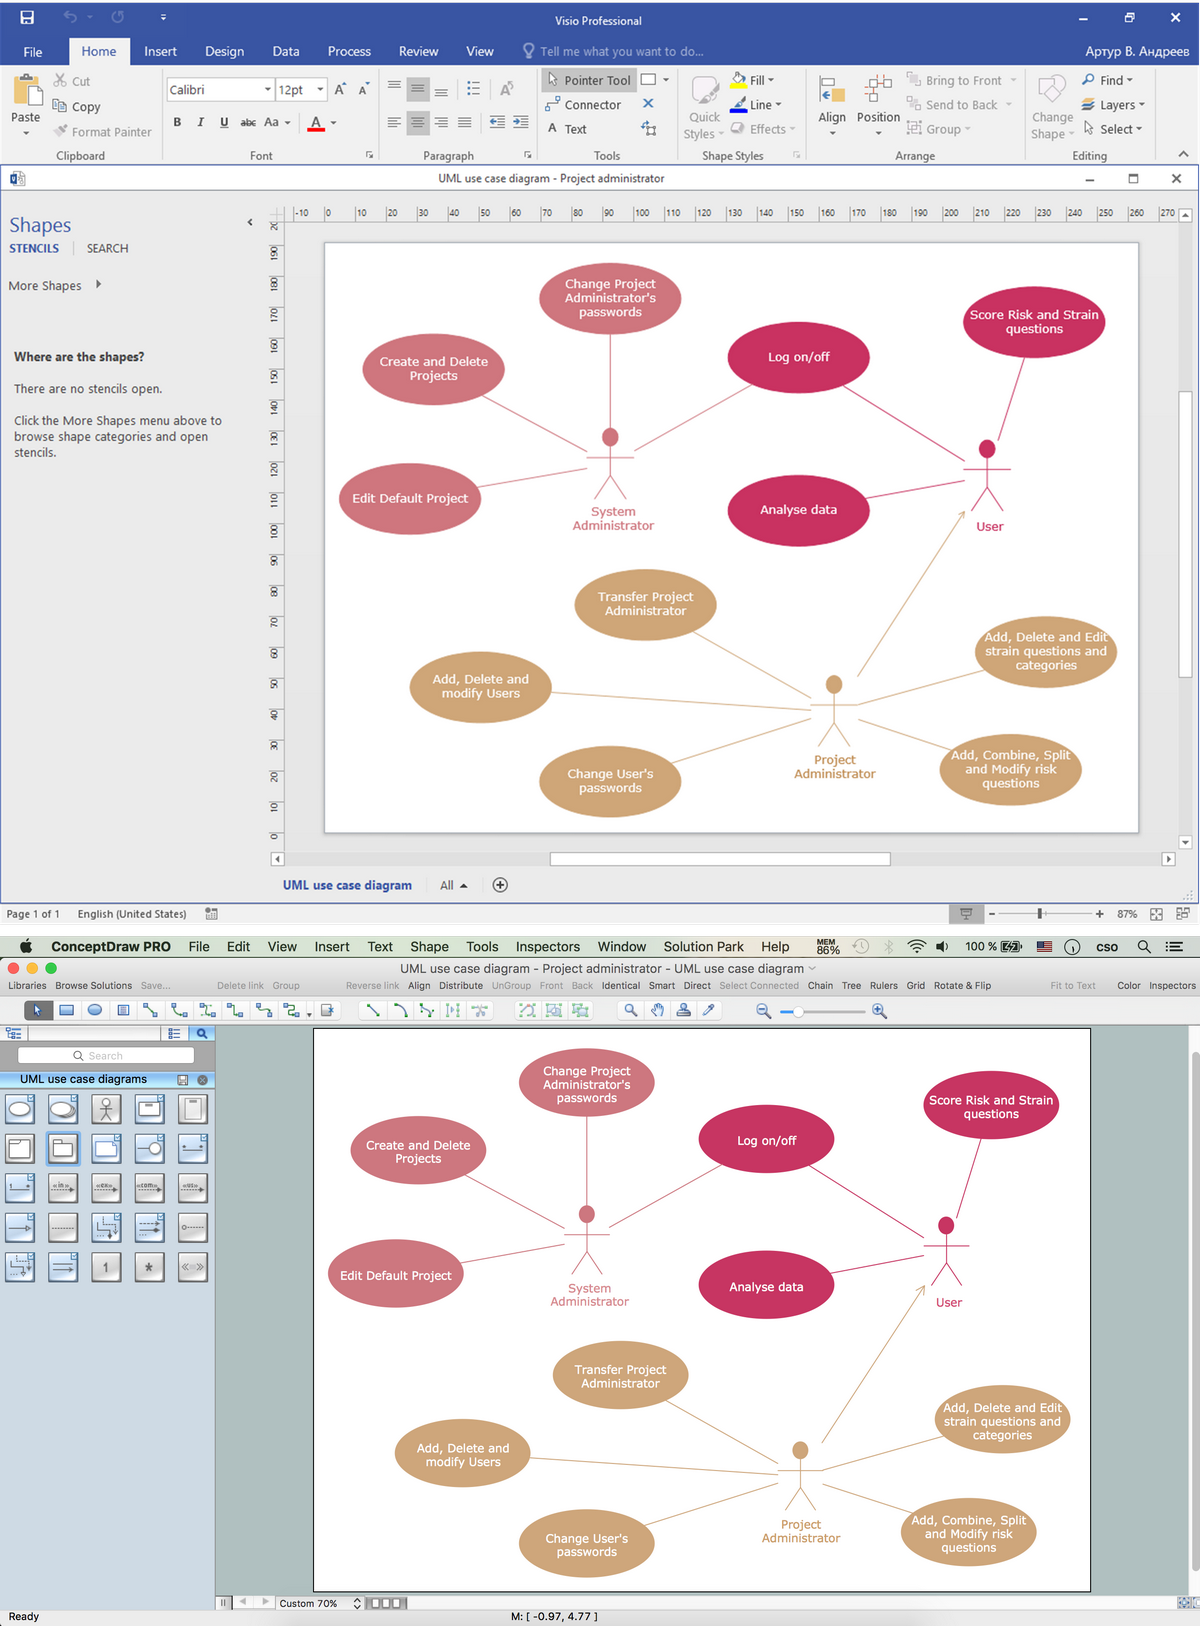
Picture: Visio Files and ConceptDraw

