Bar Chart
“A bar chart or bar graph is a chart with rectangular bars with lengths proportional to the values that they represent. The bars can be plotted vertically or horizontally. A vertical bar chart is sometimes called a column bar chart.” [from Wikipedia]
ConceptDraw DIAGRAM extended with Bar Graphs solution from Graphs and Charts area of ConceptDraw Solution Park is ideal software for quick and simple drawing the Bar Chart of any complexity.

Example 1. Bar Chart in ConceptDraw DIAGRAM
Bar Graphs Solution provides collection of predesigned templates and samples which you can see in ConceptDraw STORE. They were designed specially for ConceptDraw DIAGRAM users and are available for viewing and editing.

Example 2. Bar Graphs solution in ConceptDraw STORE
Bar Graphs solution also includes the Bar Graphs library with predesigned vector objects which will help you create fast and easy your own professional looking bar chart.

Example 3. Bar Chart - The most spoken languages of the world
This sample was created in ConceptDraw DIAGRAM using the Bar Graphs solution from the Graphs and Charts area of ConceptDraw Solution Park. It shows the Bar Chart displaying quantities of speakers of various world languages. An experienced user spent 5 minutes creating this sample.
The Bar Chart produced with ConceptDraw DIAGRAM is vector graphic documents and is available for reviewing, modifying, converting to a variety of formats (image, HTML, PDF file, MS PowerPoint Presentation, Adobe Flash or MS Visio), printing and send via e-mail in one moment.
TEN RELATED HOW TO's:
The Pie Chart visualizes the data as the proportional parts of a whole and looks like a disk divided into sectors. The pie chart is type of graph, pie chart looks as circle devided into sectors. Pie Charts are widely used in the business, statistics, analytics, mass media. It’s very effective way of displaying relative sizes of parts, the proportion of the whole thing.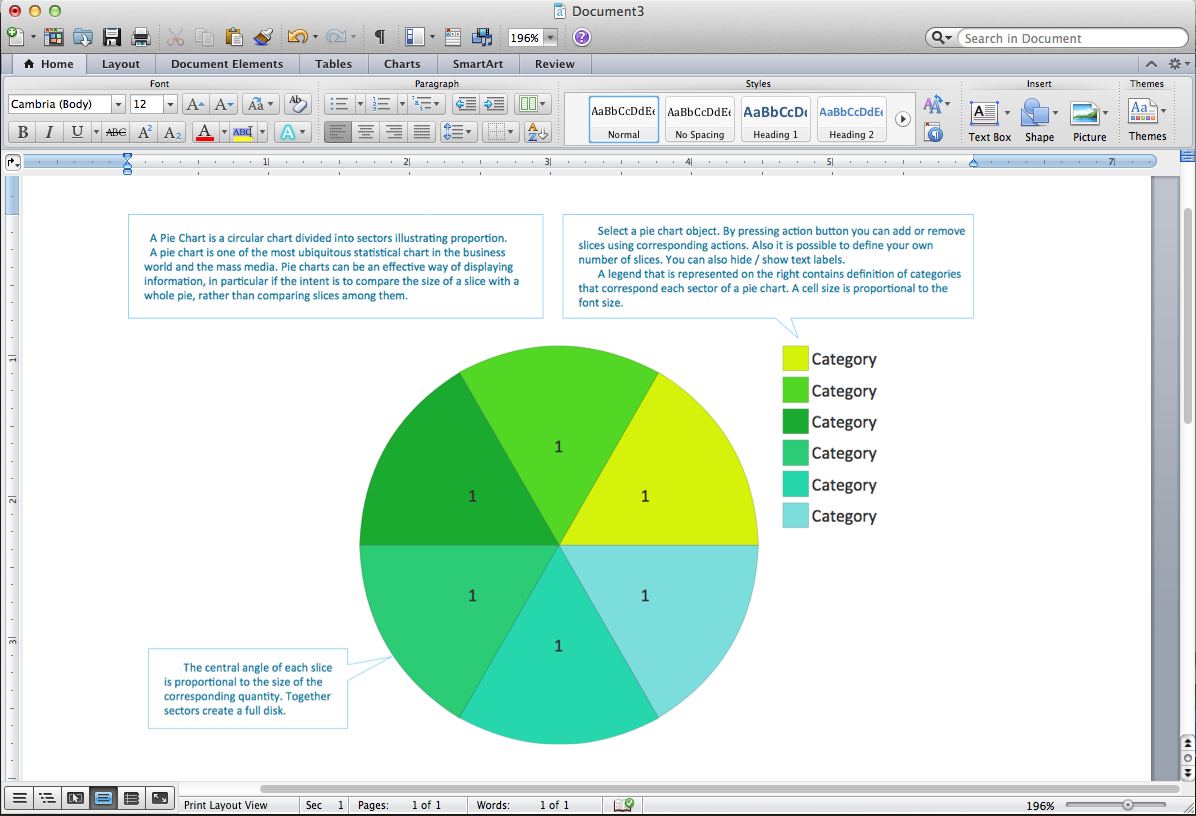
Picture: Pie Chart Word Template. Pie Chart Examples
Related Solution:
Social media is a popular view of mass communication which allows people, companies and organizations create, share, discover, modify, access, comment, discuss and exchange information through the Internet. Social Media Response solution for ConceptDraw DIAGRAM provides collection of 10 libraries with diversity of predesigned vector social media flowchart symbols for fast and easy creating interactive Social Media Flowcharts, Response Charts and Action Mind Maps.
Picture: Social Media Flowchart Symbols
Related Solution:
If you want to find a way to understand complex things in minutes, you should try to visualize data. One of the most useful tool for this is creating a flowchart, which is a diagram representing stages of some process in sequential order. There are so many possible uses of flowcharts and you can find tons of flow charts examples and predesigned templates on the Internet. Warehouse flowchart is often used for describing workflow and business process mapping. Using your imagination, you can simplify your job or daily routine with flowcharts.
Warehouse flowcharts are used to document product and information flow between sources of supply and consumers. The flowchart provides the staged guidance on how to manage each aspect of warehousing and describes such aspects as receiving of supplies; control of quality; shipment and storage and corresponding document flow. Warehouse flowchart, being actual is a good source of information. It indicates the stepwise way to complete the warehouse and inventory management process flow. Also it can be very useful for an inventory and audit procedures.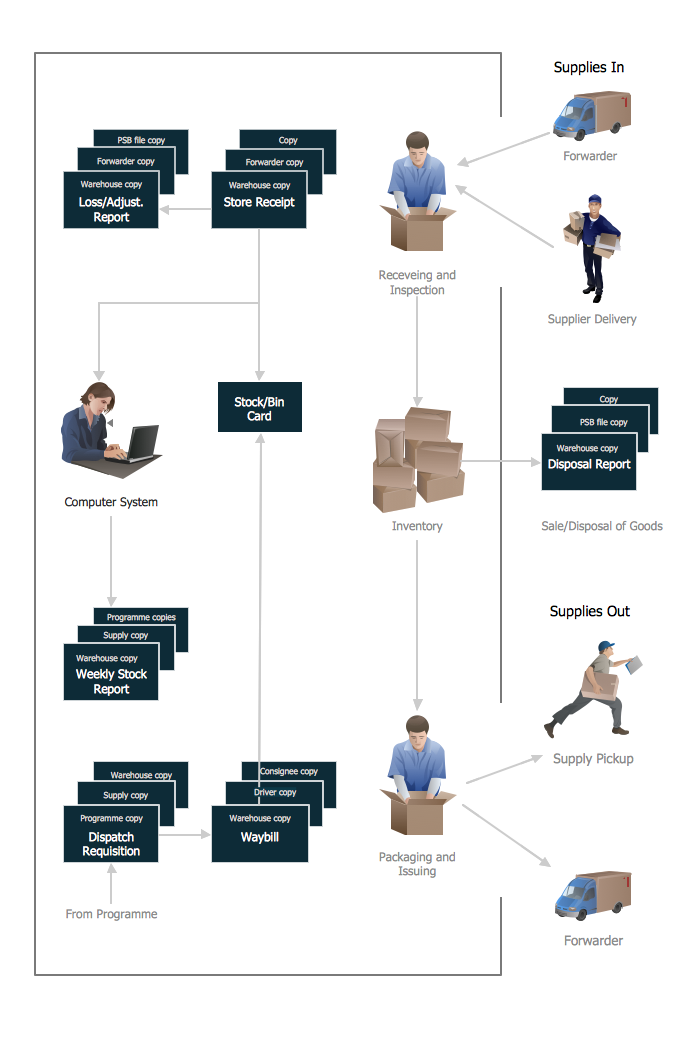
Picture:
Flow chart Example
Warehouse Flowchart
Related Solution:
While creating flowcharts and process flow diagrams, you should use special objects to define different statements, so anyone aware of flowcharts can get your scheme right. There is a short and an extended list of basic flowchart symbols and their meaning. Basic flowchart symbols include terminator objects, rectangles for describing steps of a process, diamonds representing appearing conditions and questions and parallelograms to show incoming data.
This diagram gives a general review of the standard symbols that are used when creating flowcharts and process flow diagrams. The practice of using a set of standard flowchart symbols was admitted in order to make flowcharts and other process flow diagrams created by any person properly understandable by other people. The flowchart symbols depict different kinds of actions and phases in a process. The sequence of the actions, and the relationships between them are shown by special lines and arrows. There are a large number of flowchart symbols. Which of them can be used in the particular diagram depends on its type. For instance, some symbols used in data flow diagrams usually are not used in the process flowcharts. Business process system use exactly these flowchart symbols.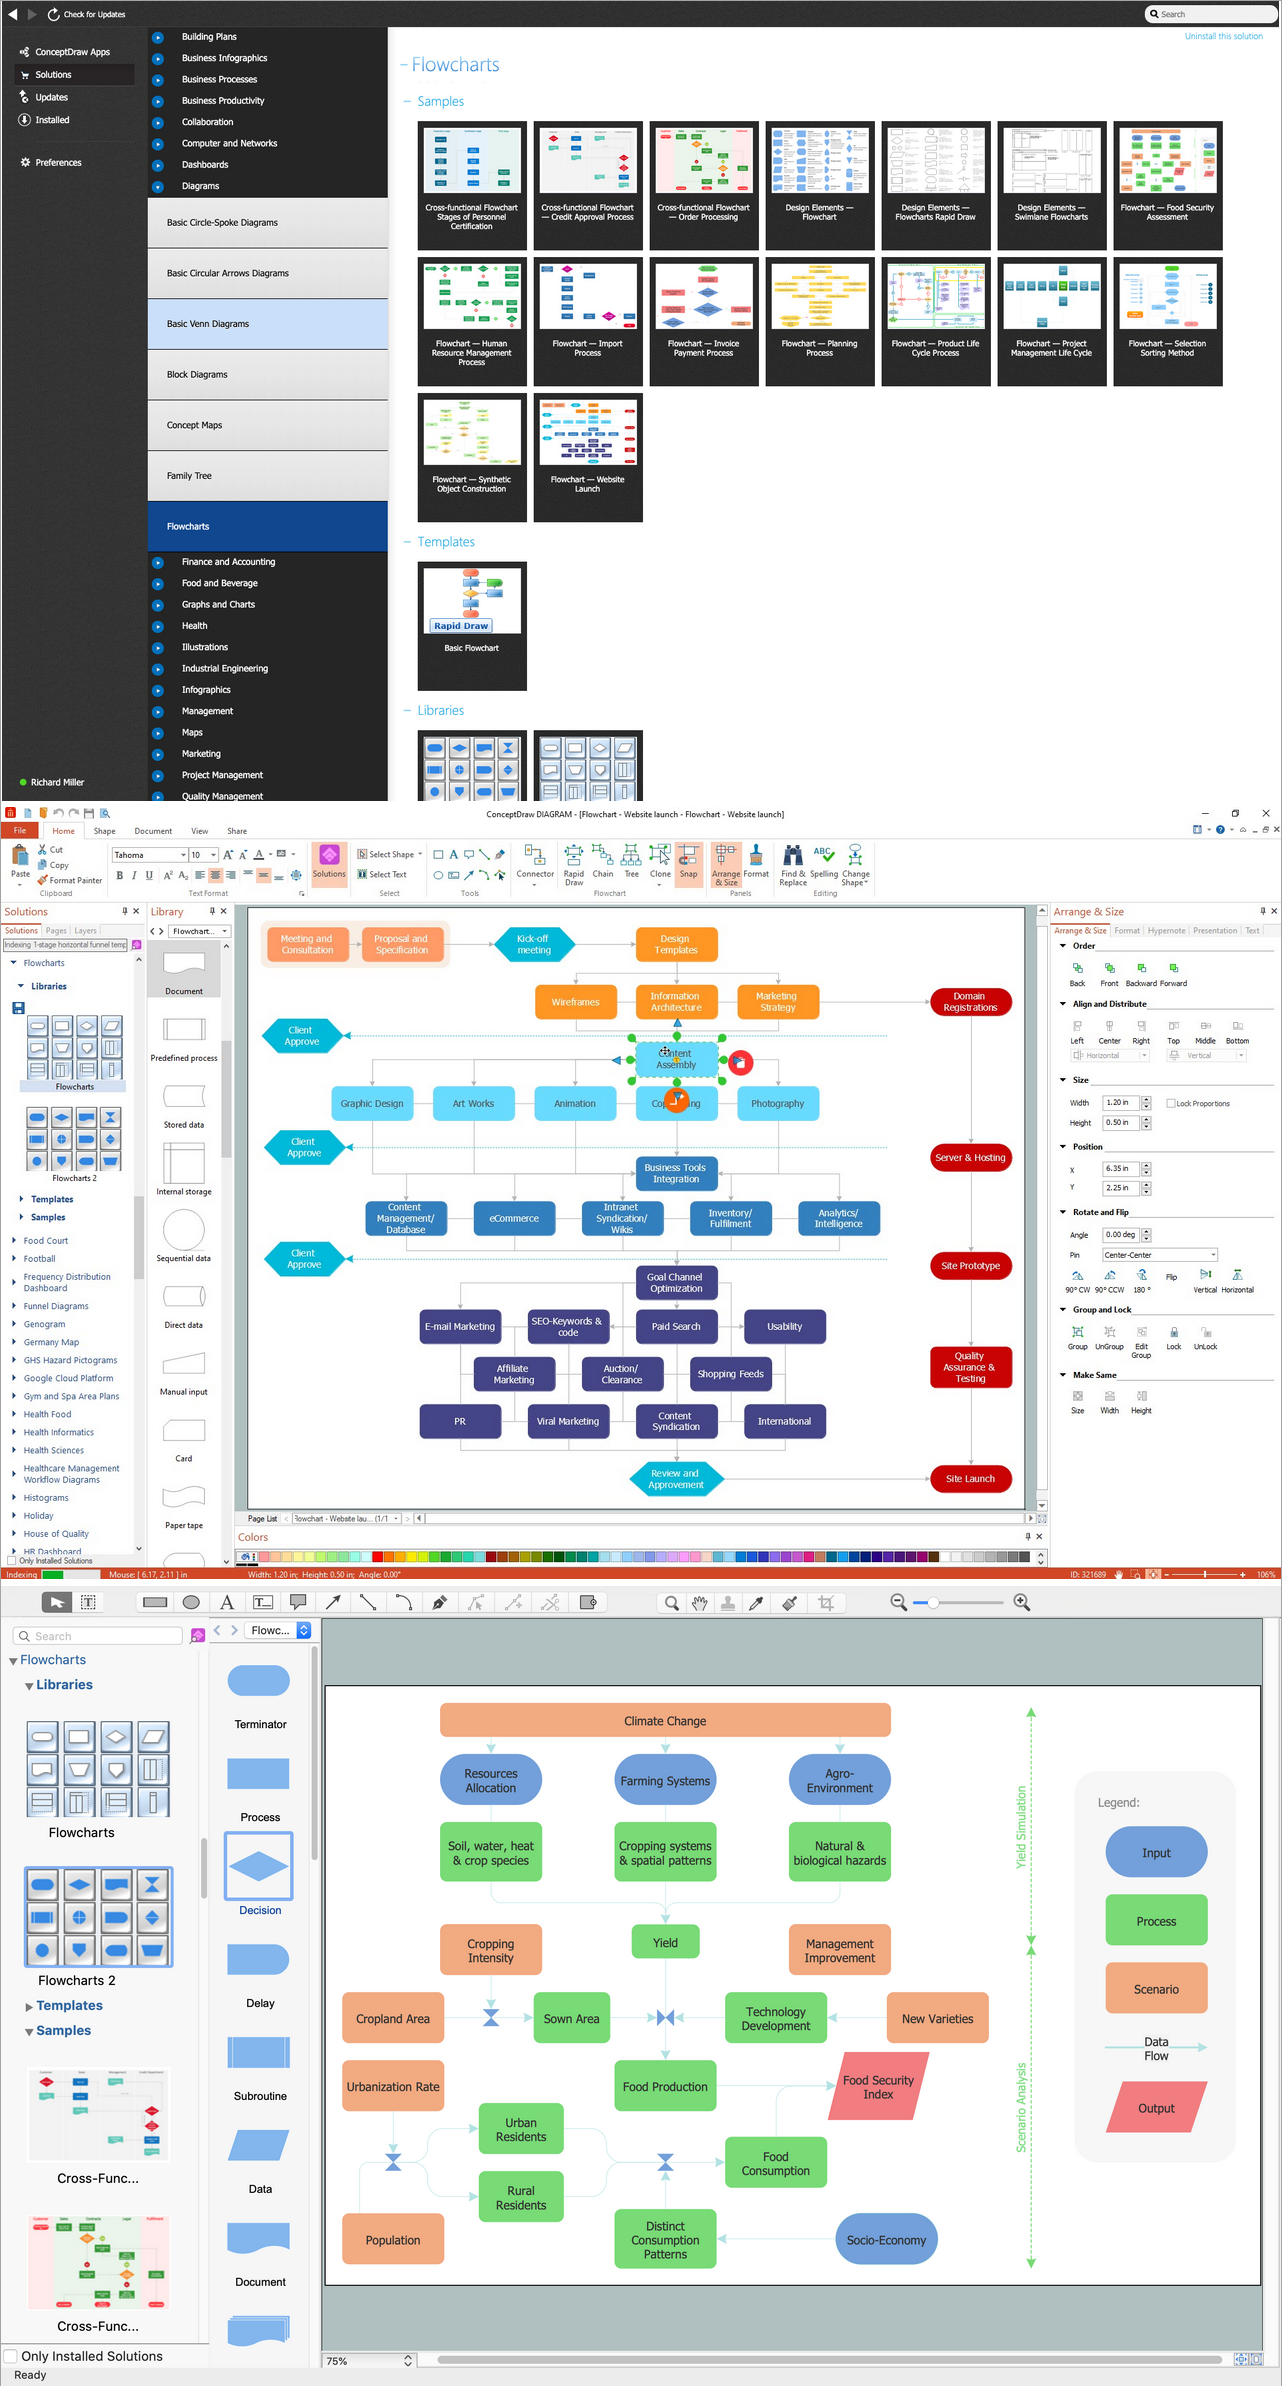
Picture: Basic of Flowchart: Meaning and Symbols
Related Solution:
ConceptDraw DIAGRAM software offers the Electric and Telecom Plans Solution which provides the extensive tools for drawing attractive Electric Visual plans.
Picture: Electric Visual
Related Solution:
In the course of recent decades data visualization went through significant development and has become an indispensable tool of journalism, business intelligence and science. The way visual information may be conveyed is not limited simply to static or dynamic representation, it can also be interactive. Infographics can be conditionally divided into several general levels. Primarily, this is level of visualization of information, its interpretation and association on any ground. Second level can be defined as a visualization of knowledge, depiction of thoughts and ideas in the form of images or diagrams. Finally, the level of data visualization, which processes data arrays in charts, enabling the information to be more clearly perceived. You can also identify the main approaches to the creation of infographics: exploratory and narrative. Exploratory method insists on minimalist design in favor of data precision without unnecessary details and is common for scientific researches and ana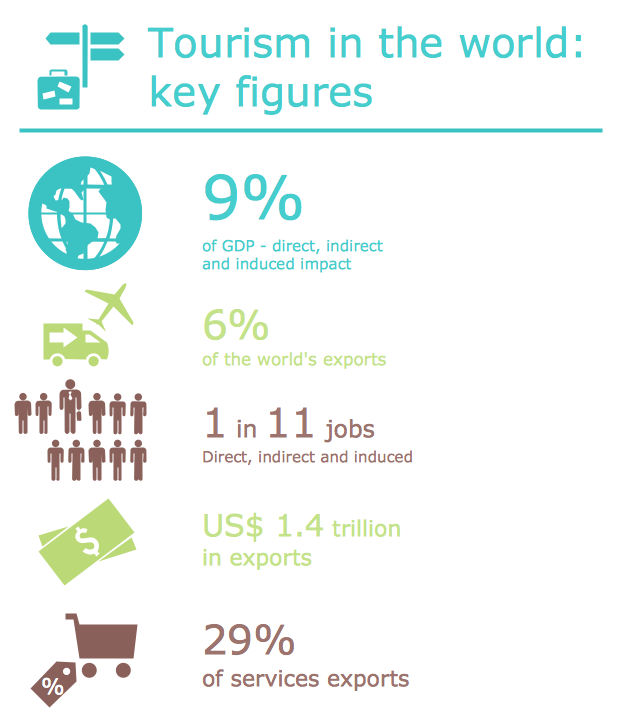
Picture: Design Pictorial Infographics. Design Infographics
Related Solution:
All these bar chart templates are included in the Bar Graphs solution.
You can quickly rework these bar graph templates into your own charts by simply changing displayed data, title and legend texts.
Picture: Bar Chart Template for Word
Related Solution:
When trying to figure out the nature of the problems occurring within a project, there are many ways to develop such understanding. One of the most common ways to document processes for further improvement is to draw a process flowchart, which depicts the activities of the process arranged in sequential order — this is business process management. ConceptDraw DIAGRAM is business process mapping software with impressive range of productivity features for business process management and classic project management. This business process management software is helpful for many purposes from different payment processes, or manufacturing processes to chemical processes. Business process mapping flowcharts helps clarify the actual workflow of different people engaged in the same process. This samples were made with ConceptDraw DIAGRAM — business process mapping software for flowcharting and used as classic visio alternative because its briefly named "visio for mac" and for windows, this sort of software named the business process management tools.
This flowchart diagram shows a process flow of project management. The diagram that is presented here depicts the project life cycle that is basic for the most of project management methods. Breaking a project into phases allows to track it in the proper manner. Through separation on phases, the total workflow of a project is divided into some foreseeable components, thus making it easier to follow the project status. A project life cycle commonly includes: initiation, definition, design, development and implementation phases. Distinguished method to show parallel and interdependent processes, as well as project life cycle relationships. A flowchart diagram is often used as visual guide to project. For instance, it used by marketing project management software for visualizing stages of marketing activities or as project management workflow tools. Created with ConceptDraw DIAGRAM — business process mapping software which is flowcharting visio alternative or shortly its visio for mac, this sort of software platform often named the business process management tools.
Picture: Process Flowchart
Related Solution:
Using the Business Diagrams Solution you can create your own professional-looking Venn Diagrams quick and easy.
Picture: 3 Circle Venn Diagram. Venn Diagram Example
Related Solution:
A pie chart or a circle graph is a circular chart divided into sectors, illustrating numerical proportion. In a pie chart, the arc length of each sector and consequently its central angle and area, is proportional to the quantity it represents.
Pie chart examples and templates created using ConceptDraw DIAGRAM software helps you get closer with pie charts and find pie chart examples suite your needs.
Picture: Pie Chart Examples and Templates
Related Solution:

