Rainfall Bar Chart
This sample was created in ConceptDraw DIAGRAM diagramming and vector drawing software using the Bar Graphs Solution from the Graphs and Charts area of ConceptDraw Solution Park.
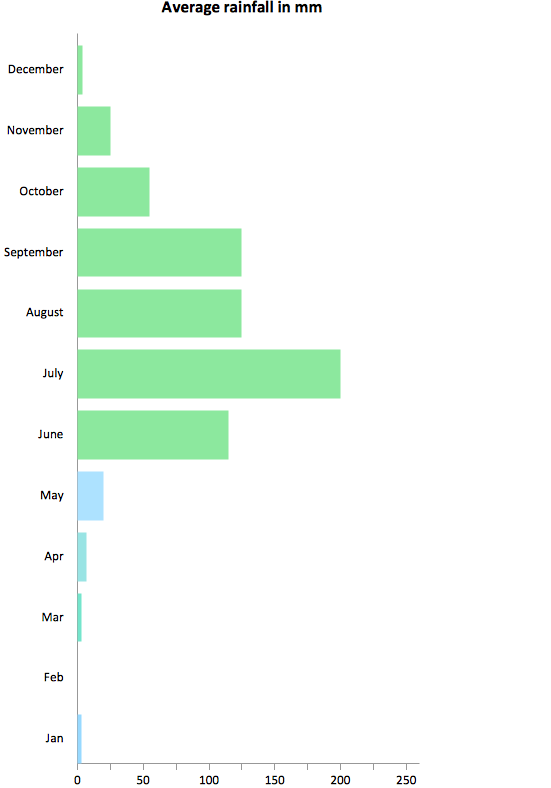
Pic. 1. Rainfall bar chart.
This sample shows the Horizontal Bar Chart of the average monthly rainfalls.
Using the predesigned vector stencils, templates and samples from the Bar Graphs Solution for ConceptDraw DIAGRAM you can create your own professional looking Bar Charts quick and easy.
The Bar Charts created with ConceptDraw DIAGRAM are vector graphic documents and are available for reviewing, modifying, and converting to a variety of formats (image, HTML, PDF file, MS PowerPoint Presentation, Adobe Flash or MS Visio).
More Related Diagrams:
- Bar Chart Software
- Line Graph Charting Software
- Pie Chart Software
- Pyramid Diagram and Pyramid Chart
- Scatter Graph Charting Software
TEN RELATED HOW TO's:
When we think of an hierarchy, we intuitively imagine a pyramid. Thus, a lot of management tools use pyramid charts as examples or illustrations of various documents or models. You can create any type of triangle diagram using ConceptDraw DIAGRAM.
A triangle (pyramid) diagram is often used in marketing to show the data hierarchy. This pyramid diagram represents the Top Brand Model. It illustrate the model of rebranding strategy. It can be used by marketing agency dealing with rebranding strategies development. It’s critical for marketing diagrams to be both clear and eye catching. ConceptDraw Pyramid diagrams solution meet all these requirements and can be successfully applied for creating and presenting various marketing pyramidal diagrams.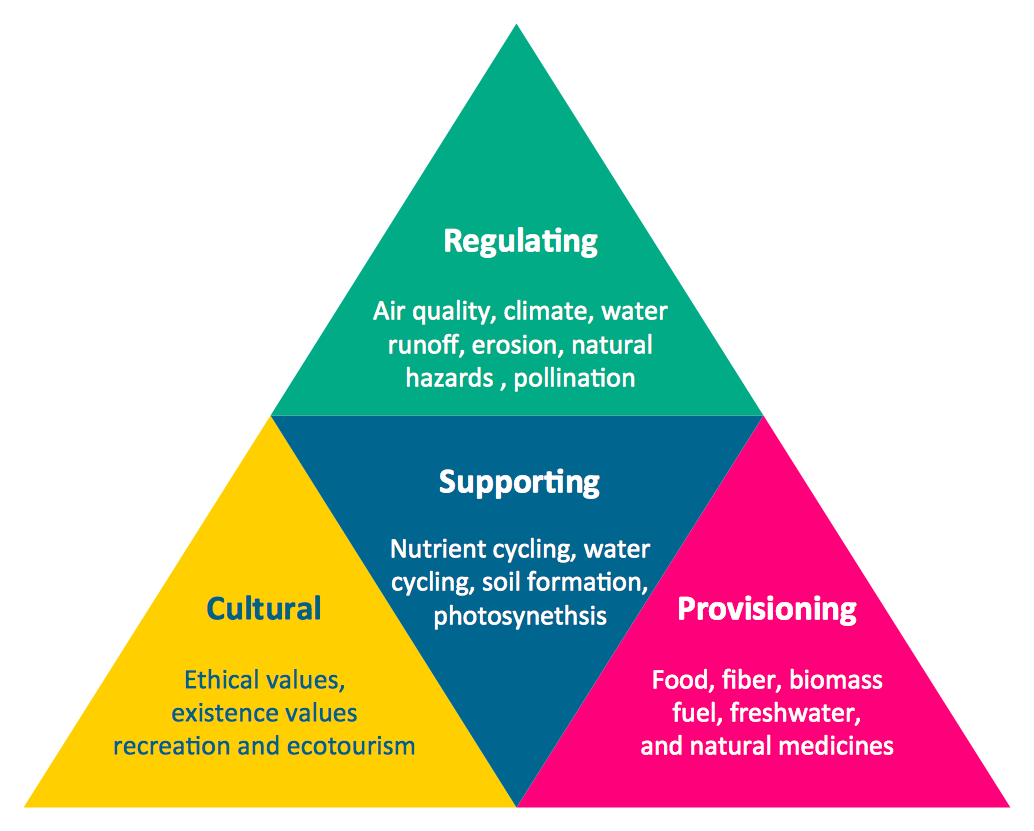
Picture: Pyramid Chart Examples
Related Solutions:
The ConceptDraw DIAGRAM is a best flow chart tool for the job. The samples and templates included in the basic set allows users to draw any type of a flowchart. The vector stencils created by designers give ability to draw great-looking flowchart. Flowcharts give to users the ability to represent structural data visually.
Picture: Use the Best FlowChart Tool for the Job
Related Solution:
ConceptDraw DIAGRAM is a business flowchart software includes the wide flowchart examples package.
Picture: Basic Flowchart Examples
Related Solution:
This sample was created in ConceptDraw DIAGRAM diagramming and vector drawing software using the Line Graphs Solution from Graphs and Charts area of ConceptDraw Solution Park.
This sample shows the Line Chart of annual percentage change. The Line Chart allows you to clearly see the changes of data over the time.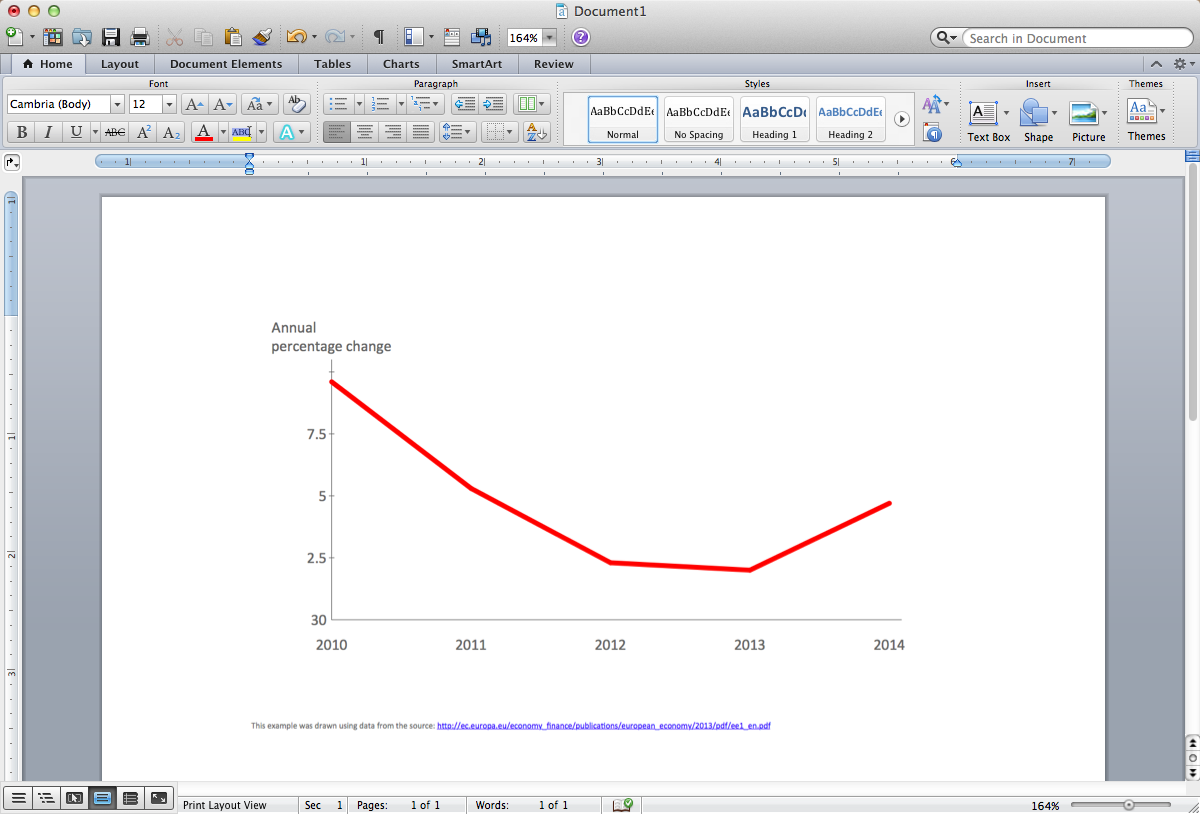
Picture: Line Chart Template for Word
Related Solution:
When deciding to start your own business, you have to take into account a bunch of different aspects. One of the ways to get inspired is to look through various restaurant floor plans samples or interior photos of already known establishments. This will help you, but keep in mind that a really unforgettable establishment must be unique.
This restaurant floor plan diagram was designed using ConceptDraw Cafe and Restaurant Floor Plan solution. It can be used as a sample while considering a custom restaurant design. With the help of this example you can estimate the amount of furniture best for a dining room or kitchen of the restaurant. In addition, this plan would be useful as a check list when you will consider a list of the furniture and equipment needed for all areas of the future restaurant.
Picture: Restaurant Floor Plans Samples
Related Solution:
During the planning, discussing and execution of a project you may need to prepare a presentation using project views such as the Gantt Chart, Multiproject Dashboard or Resource Usage View. It’s easy do with ConceptDraw PROJECT!
Picture: How to Create Presentation of Your Project Gantt Chart
The question how to create a column chart have a simple answer. Use ConceptDraw tips to find out how to create a column chart depicts your data the best way.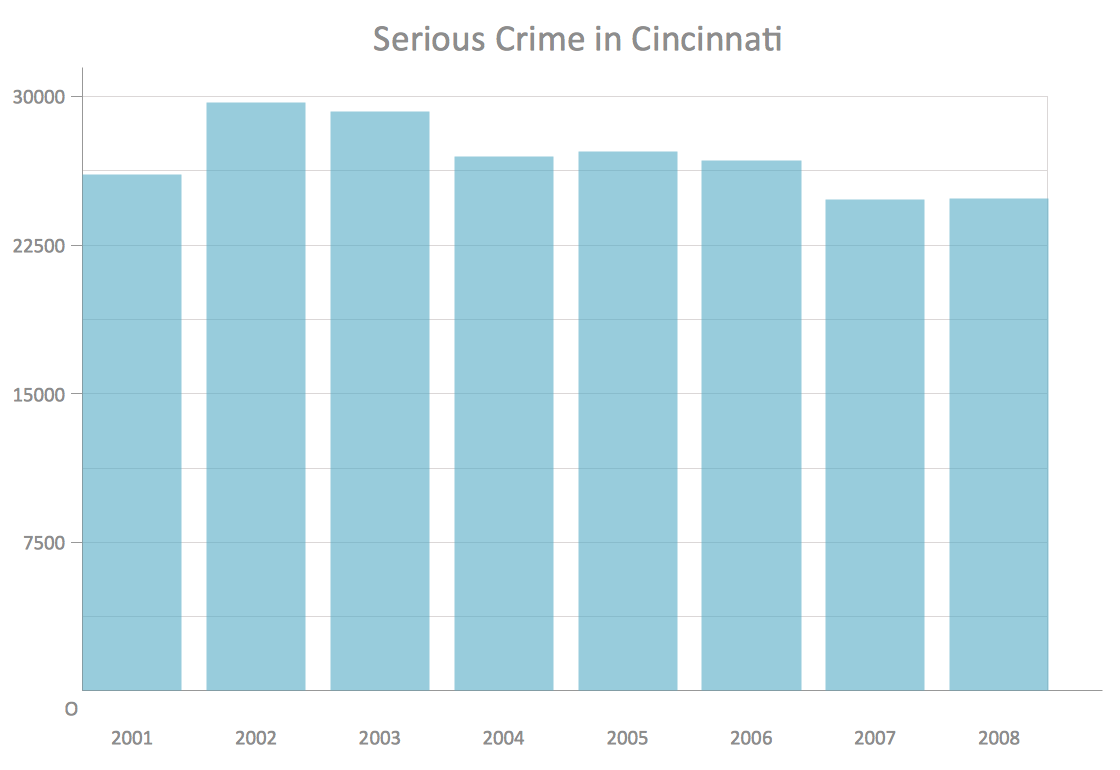
Picture: How to Create a Column Chart
Related Solution:
Software development flourishes nowadays. Students have tons of educational information and courses that would fit every taste. And it's no secret that knowing how to draw data flow diagrams is a useful skill for a future software architect. The diagrams help a lot in understanding how to storage data effectively and how data processes within a system.
This data flow diagram represents the model of small traditional production enterprise. It was created using Yourdon and Coad notation. The data flow diagram include four main objects: entity, process, data store and data flow. Yourdon and Coad notation uses circles to depict processes and parallel lines to represent data stores. Dataflows are shown as arrowed lines. They are labeled with the description of the data that move through them. Dataflow's role is to deliver the pieces of information. A process's function is to transform. the input data flow into output data flow. ConceptDraw Data Flow Diagrams solution contains the data flow diagram symbols of both Yourdon-Coad and Gane-Sarson notations and a set of handy templates to get started with DFD.
Picture: Data Flow Diagrams
Related Solution:
ConceptDraw DIAGRAM extended with Divided Bar Diagrams solution from Graphs and Charts area of ConceptDraw Solution Park is the best software for quick and simple drawing the Divided Bar Diagrams and Bar Diagram Math.
Picture: Bar Diagram Math
Related Solution:
ConceptDraw DIAGRAM charting and vector drawing software offers the Circle Spoke Diagram Template included to the Business Diagrams Solution from the Management Area. The use of ready template is the easiest way of drawing professional-looking Circle-Spoke Diagrams.
Picture: Circle Spoke Diagram Template
Related Solution:
ConceptDraw
DIAGRAM 18