
Pic. 1. Waterfall bar chart.
This sample shows the waterfall bar chart of the company profit and loss. The values of the figures describe the company profit.
Use the predesigned vector stencils, templates and samples from the Bar Graphs Solution for ConceptDraw DIAGRAM to create your own Waterfall Charts quick and easy.
The Waterfall charts produced with ConceptDraw DIAGRAM are vector graphic documents and are available for reviewing, modifying, and converting to a variety of formats (image, HTML, PDF file, MS PowerPoint Presentation, Adobe Flash or MS Visio).
More Related Diagrams:
TEN RELATED HOW TO's:
The ConceptDraw DIAGRAM is a good flow chart app for Mac. Numerous vector stencils, samples and templates created by designers allows you to draw any type of flowchart.
Picture: Good Flow Chart app for Mac
Related Solution:
A causal model is an abstract concept, that describes the causal mechanisms of a system, by noting certain variables and their influence on each other, in an effort to discover the cause of a certain problem or flaw. This model is presented in diagram form by using a fishbone diagram.
ConceptDraw DIAGRAM diagramming and vector drawing software enhanced with Fishbone Diagrams solution helps you create business productivity diagrams from Fishbone diagram templates and examples, that provide to start using of the graphic method for the analysis of problem causes. Each predesigned Fishbone Diagram template is ready to use and useful for instantly drawing your own Fishbone Diagram.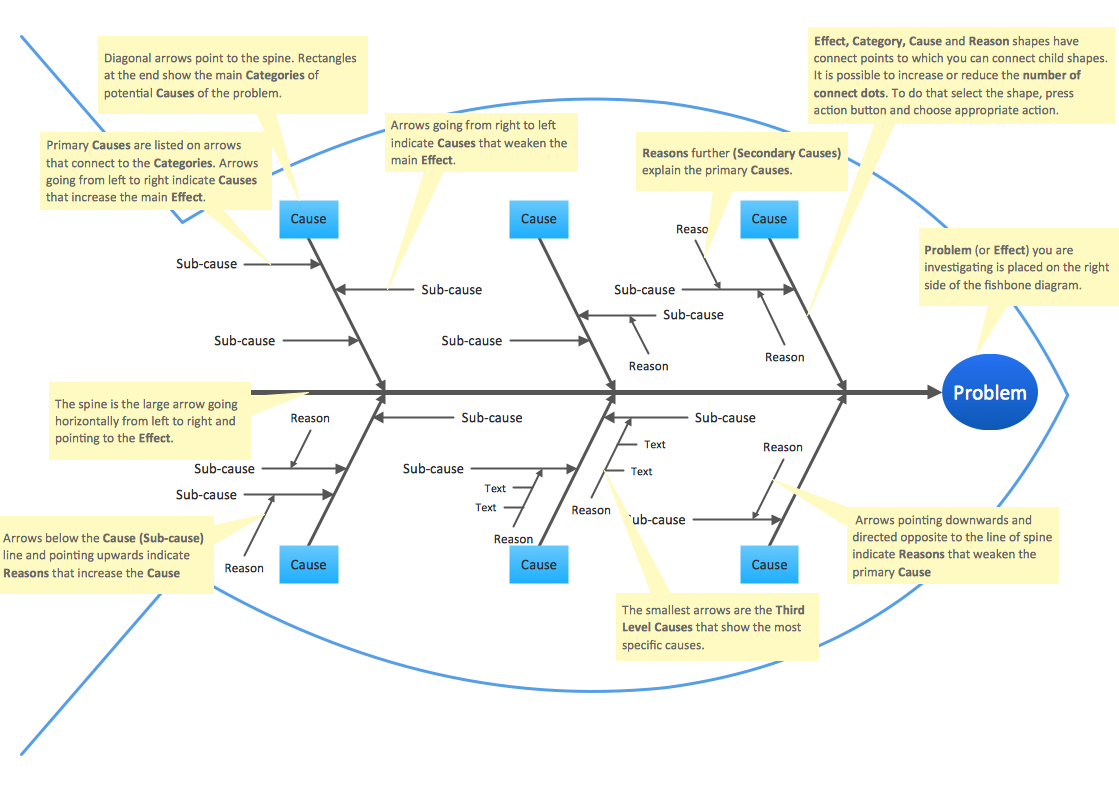
Picture: Fishbone Diagram Template
Related Solution:
Architectural drawing allows to show the location of a building or ensemble of buildings on the ground, indicating the cardinal points. For centuries, people had been studying architecture in universities to learn how to draw building plans and now everyone can do it easily just using appropriate software. While developing the building plan, its graphic part, you can display the part of the floor or the entire floor of a building with an indication of the exact location of the drawn premise.
Small-sized apartments does not restrict the advanced interior design opportunities. Here is a detailed and precise floor plan of a pretty small apartment. A furniture objects are added to show possible interior of this home. This plan can be used to help somebody with a floor layout and furniture arrangement. Having this floor plan in a pocket while shopping would be useful to check if there is enough rooms for a new furniture.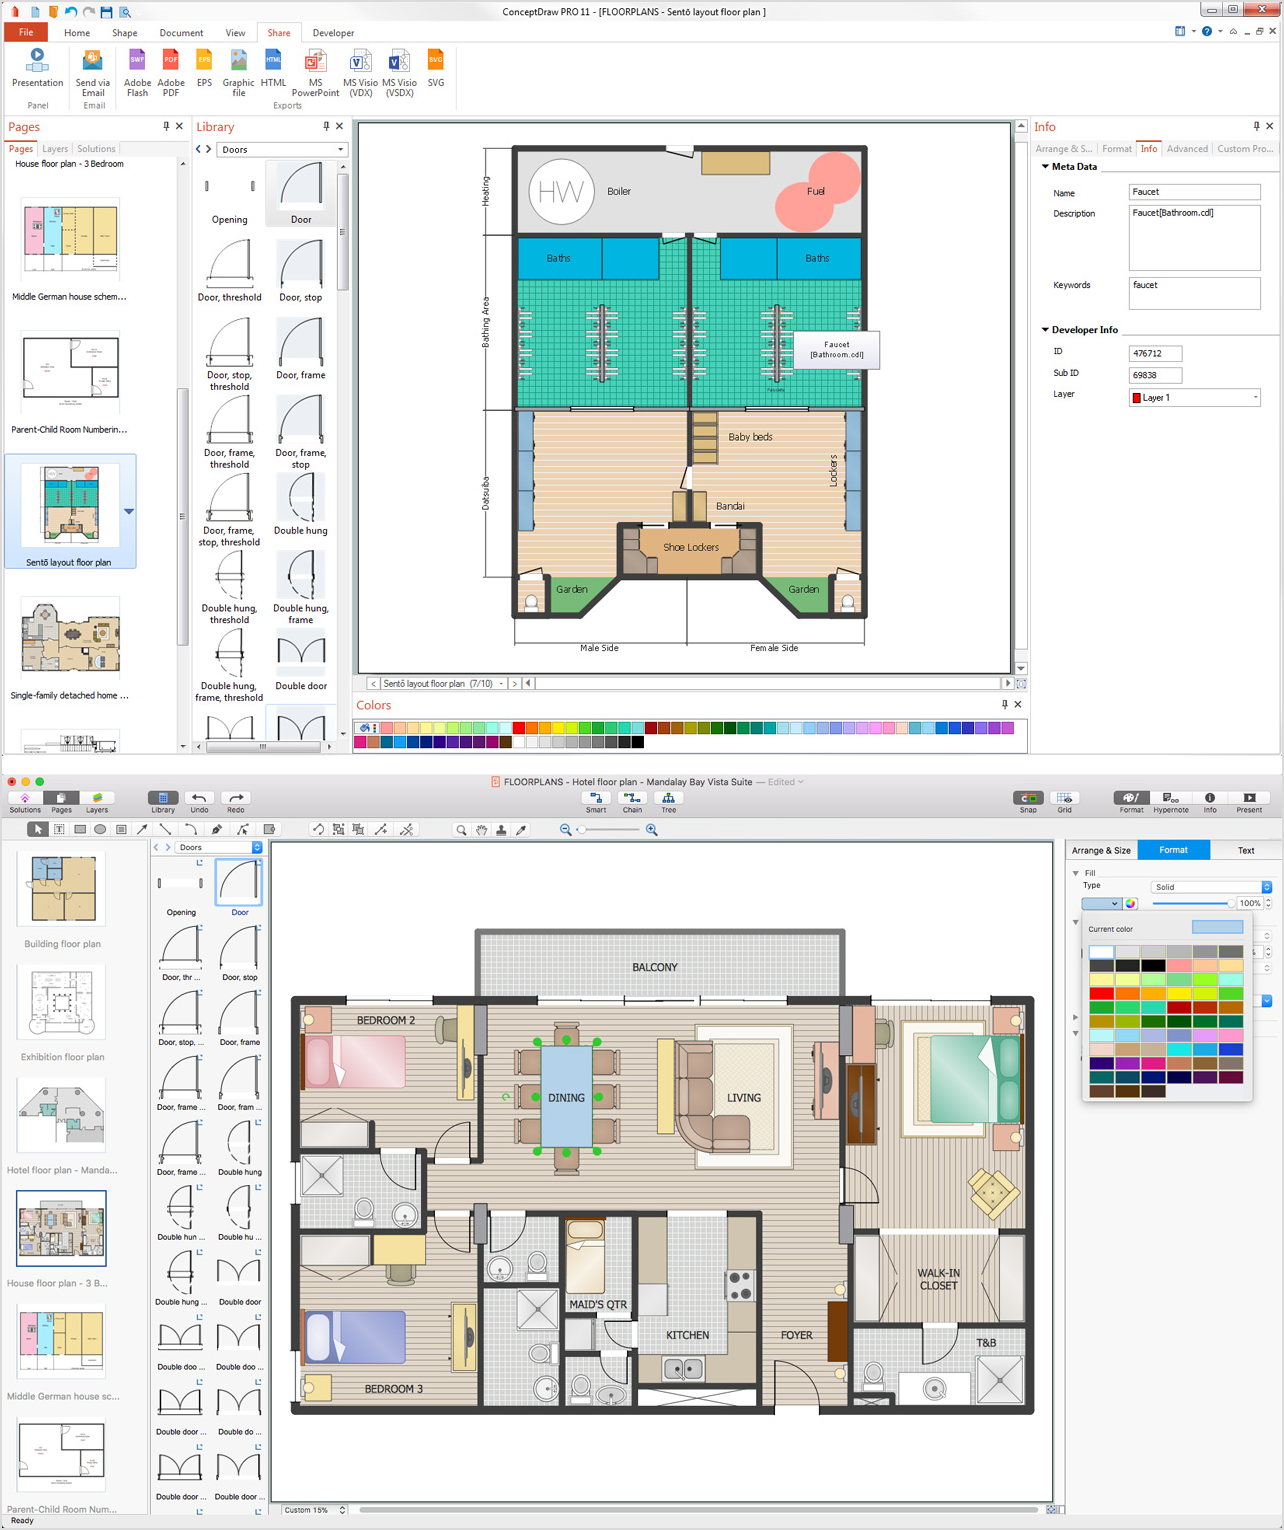
Picture: How To Draw Building Plans
Related Solution:
ConceptDraw DIAGRAM is a powerful intelligent vector graphics tool for drawing flowcharts.
Picture: Basic Diagramming Flowchart Software
Related Solution:
The Gantt Chart is the main interface in ConceptDraw PROJECT. It summarizes the tasks in your project and presents them graphically so you can easily view your progress.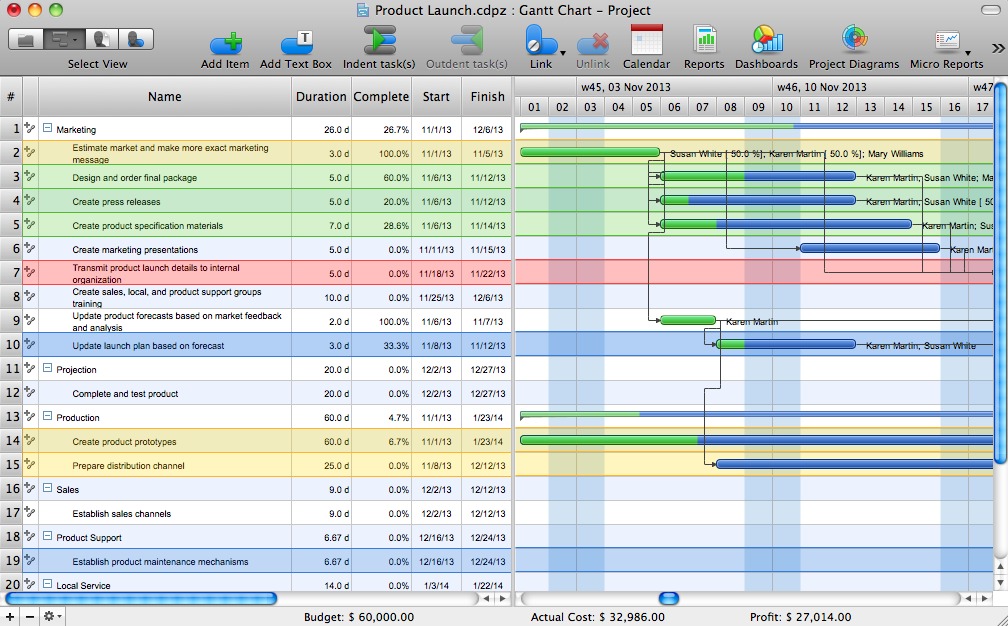
Picture: Gantt Chart Software
ConceptDraw DIAGRAM diagramming and vector drawing software extended with Specification and Description Language (SDL) Solution from the Industrial Engineering Area of ConceptDraw Solution Park provides powerful drawing tools for quick and easy creating well-designed FSM diagrams.
Picture: FSM — Finite-state Machine
Related Solution:
When deciding to start your own business, you have to take into account a bunch of different aspects. One of the ways to get inspired is to look through various restaurant floor plans samples or interior photos of already known establishments. This will help you, but keep in mind that a really unforgettable establishment must be unique.
This restaurant floor plan diagram was designed using ConceptDraw Cafe and Restaurant Floor Plan solution. It can be used as a sample while considering a custom restaurant design. With the help of this example you can estimate the amount of furniture best for a dining room or kitchen of the restaurant. In addition, this plan would be useful as a check list when you will consider a list of the furniture and equipment needed for all areas of the future restaurant.
Picture: Restaurant Floor Plans Samples
Related Solution:
Do you need to draw a check order process flowchart?
Use the intuitive product - ConceptDraw.
Picture: Check Order Process Flowchart. Flowchart Examples
Related Solution:
ConceptDraw gives the ability to draw simple diagrams like flowcharts, block diagrams, bar charts, histograms, pie charts, divided bar diagrams, line graphs, area charts, scatter plots, circular arrows diagrams, Venn diagrams, bubble diagrams, concept maps, and others.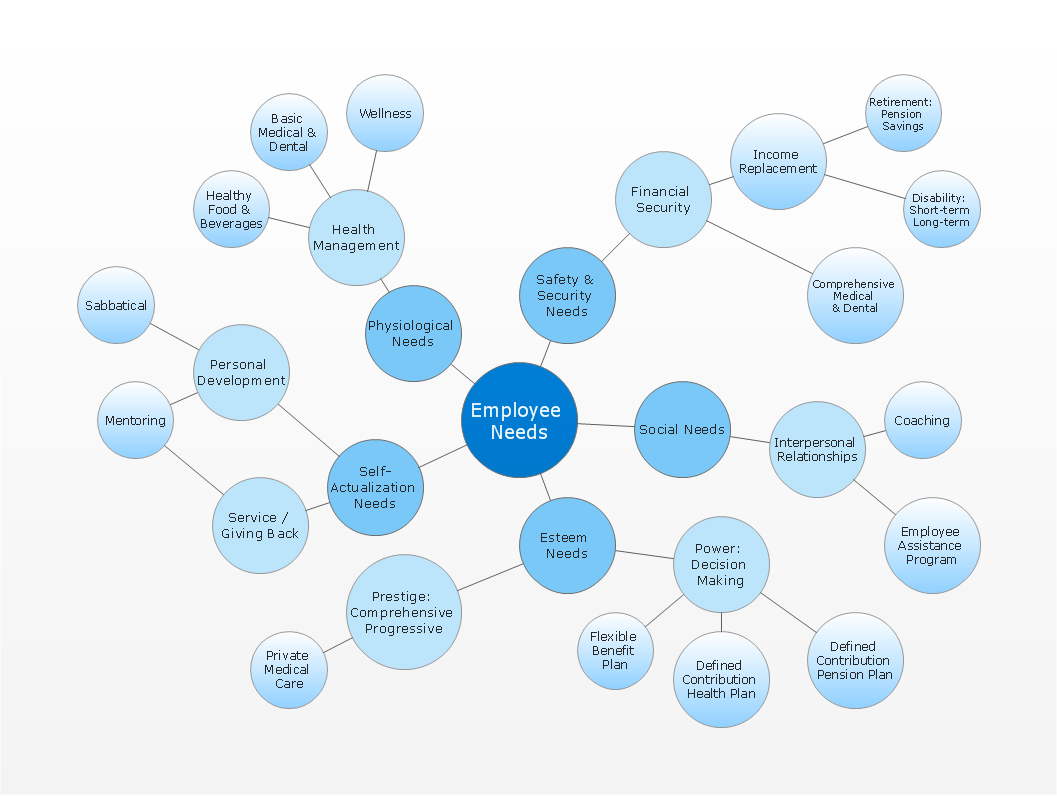
Picture: Simple Drawing Applications for Mac
Related Solution:
Four lessons explaining how to manage your task list in a Gantt chart. You will learn how to adjust your Gantt chart view, how to add/delete tasks or subtasks, how to change tasks hierarchy, how to show/hide subtasks.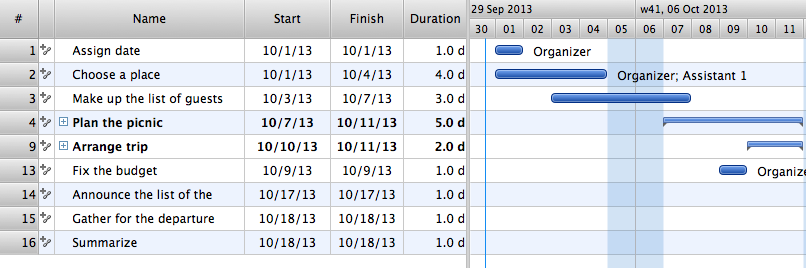
Picture: Managing the task list