Bar Diagrams for Problem Solving.
Create business management bar charts with Bar Graphs Solution
Create bar charts for business management problem solving and data comparison using the ConceptDraw DIAGRAM diagramming and vector drawing software extended with the Bar Graphs Solution from the Graphs and Charts area of ConceptDraw Solition Park.

Example 1. Software for create Bar Charts, Graphs and Diagrams
Free Download Bar Chart Software and View All Examples

Example 1. Vertical bar chart example - External Executives: Time-to-Productivity.
"The above chart depicts the amount of time that can be be needed if the new leader is coming from outside of the organization or group. The analysis emphasizes two points; first that the amount of time for an external candidate to adapt to their new environment can be considerable and second that planned leadership changes can be the most successful in preparing both the new leader and the team by allotting more time and resources to create a successful transition.
The most crucial time in the integration process is labeled the transition phase. During this period both the team leader and team members should focus on activities related to structuring the team, planning the team’s work, and evaluating the team’s performance such that the team will ultimately be able to achieve its goal or objective in order to establish the structures and processes that will enable future effectiveness."
[en.wikibooks.org/wiki/Managing_Groups_and_Teams/What_should_a_New_Leader_do_when_entering_into_an_existing_team%3F]
This bar chart was redesigned using the ConceptDraw DIAGRAM from the Wikimedia Commons file: Chart 3- time to productivity.jpg.
[commons.wikimedia.org/wiki/File:Chart_3-_time_to_productivity.jpg]
See Also:
TEN RELATED HOW TO's:
This sample shows the Influence Diagram. It was created in ConceptDraw DIAGRAM diagramming and vector drawing software using the Basic Diagramming Solution from the Universal Diagramming area of ConceptDraw Solution Park.
Influence diagram represents the directed acyclic graph with three types of nodes and three types of arcs that connect the nodes. Decision node is drawn as a rectangle, Uncertainty node is drawn as an oval, Value node is drawn as an octagon.
Picture: Influence Diagram
Related Solution:
Problems are obstacles and challenges that one should overcome to reach the goal. They are an inseparable part of any business, and the success of an enterprise often depends on ability to solve all problems effectively. The process of problem solving often uses rational approach, helping to find a suitable solution.
Using Fishbone Diagrams for Problem Solving is a productive and illustrative tool to identify the most important factors causing the trouble. ConceptDraw DIAGRAM extended with Fishbone Diagrams solution from the Management area of ConceptDraw Solution Park is a powerful tool for problem solving with Fishbone Ishikawa diagram graphic method.
Picture: Using Fishbone Diagrams for Problem Solving
Related Solution:
You need to draw the Bar Graph? The automated tool can be useful for you. ConceptDraw DIAGRAM diagramming and vector drawing software extended with Bar Graphs solution from Graphs and Charts area of ConceptDraw Solution Park will help you create any Bar Graph.
Picture: Bar Graph
Related Solution:
Pie Graph is very popular kind of charts which is widely used in various fields of science and life activities. ConceptDraw DIAGRAM extended with Pie Charts Solution from the Graphs and Charts area is the best software for drawing the Pie Graph Worksheets.
Picture: Pie Graph Worksheets
Related Solution:
The Total Quality Management Diagram solution helps you and your organization visualize business and industrial processes. Create Total Quality Management diagrams for business process with ConceptDraw software.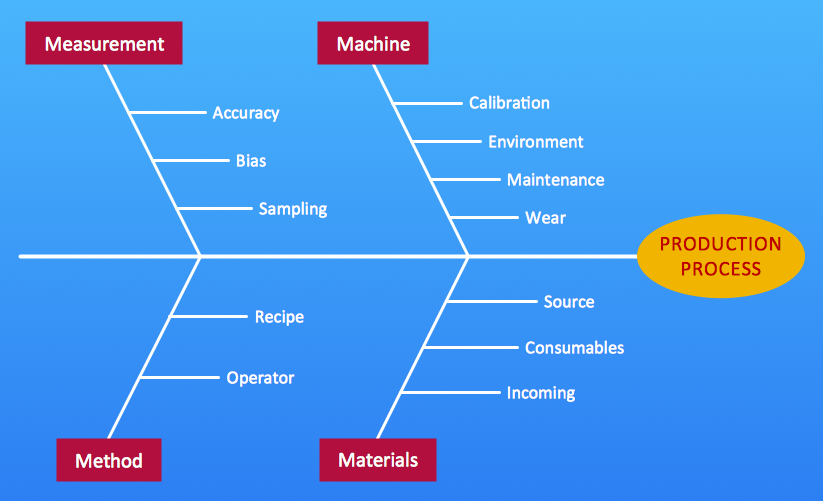
Picture: Total Quality Management Value
Related Solution:
The Total Quality Management Diagram solution helps you and your organization visualize business and industrial processes. Create Total Quality Management diagrams for business process with ConceptDraw software.
Picture: TQM Diagram Example
Related Solution:
The Venn diagram example below shows sustainable development at the confluence of three constituent parts.
Create your Venn diagrams for problem solving in environmental social science using the ConceptDraw DIAGRAM software.
Picture:
Venn Diagram Examples for Problem Solving
Environmental Social Science
Human Sustainability Confluence
Related Solution:
