Bar Diagrams for Problem Solving.
Create space science bar charts with Bar Graphs Solution
Create bar graphs for visual solving your scientific problems and data comparison using the ConceptDraw DIAGRAM diagramming and vector drawing software extended with the Bar Graphs Solution from the Graphs and Charts area of ConceptDraw Solition Park.

Example 1. Software for create Bar Charts, Graphs and Diagrams
Free Download Bar Chart Software and View All Examples
Bar charts represent data in different categories or groups. In a Vertical Bar Graph, a bar’s height represents the numerical value for a data series. Bar graphs are used to compare data for several individual items or events.

Example 2. Vertical bar graph - Composition of lunar soil.
"The term lunar soil is often used interchangeably with "lunar regolith" but typically refers to only the finer fraction of regolith, that which is composed of grains one cm in diameter or less. Lunar dust generally connotes even finer materials than lunar soil. There is no official definition of what size fraction constitutes "dust", some place the cutoff at less than 50 micrometres in diameter, others at less than 10. ...
Lunar soil is composed of various types of particles including rock fragments, mono-mineralic fragments, and various kinds of glasses including agglutinate particles and volcanic and impact spherules. The agglutinates form at the lunar surface by micrometeorite impacts that cause small-scale melting which fuses adjacent materials together with tiny specks of metallic iron (Fe0) embedded in each dust particle’s glassy shell.
Over time, material is mixed both vertically and horizontally (a process known as "gardening") by impact processes. However, the contribution of material from great distances is relatively minor, such that the soil composition at any given location largely reflects the local bedrock composition.
There are two profound differences in the chemistry of lunar regolith and soil from terrestrial materials. The first is that the Moon is very dry. As a result, those minerals with water as part of their structure such as clay, mica, and amphiboles are totally absent from the Moon. The second difference is that lunar regolith and crust are chemically reduced, rather than being significantly oxidized like the Earth's crust. In the case of the regolith, this is due in part to the constant bombardment of the lunar surface with hydrogen (H) from the solar wind. One consequence is that iron on the Moon is found in the metallic 0 and +2 oxidation state, whereas on Earth iron is found primarily in the +2 and +3 oxidation state."
[Lunar soil. Wikipedia]
This bar chart was redesigned using the ConceptDraw DIAGRAM from the Wikimedia Commons file: Composition of lunar soil.svg.[commons.wikimedia.org]
See Also:
TEN RELATED HOW TO's:
Any business process consists from a number of tasks carrying out the certain business goal. It is useful to diagram business processes to ensure that they are as foolproof, logical and sequential as possible. This business process diagram describes a typical booking process flow by the example of a cab booking process. It can be used as a roadmap for any booking system implementation. Diagramming a business process allows you to look at the entire project and take into account all types of possible scenarios. Business process diagram helps you investigate and clarify the process thoroughly so that you can find out how it can be improved. Business process diagram supports team communications by ensuring that each process element is clear and everyone in the team is on the same page.
Sometimes your company brings you less profit than you expect it to be, and it’s difficult to reveal the causes. Maybe it’s time to learn new technologies, because business diagram are easily developed by means of special software, so you won’t make any extra effort. In return, you will increase your productivity and get more done in a less time.
Picture: Business Diagram Software
Related Solutions:
Venn Diagrams visualize all possible logical intersections between several sets and are widely used in mathematics, logic, statistics, marketing, sociology, philosophy, etc.
Using the ConceptDraw DIAGRAM you can create your own professional looking Venn Diagrams quick and easy.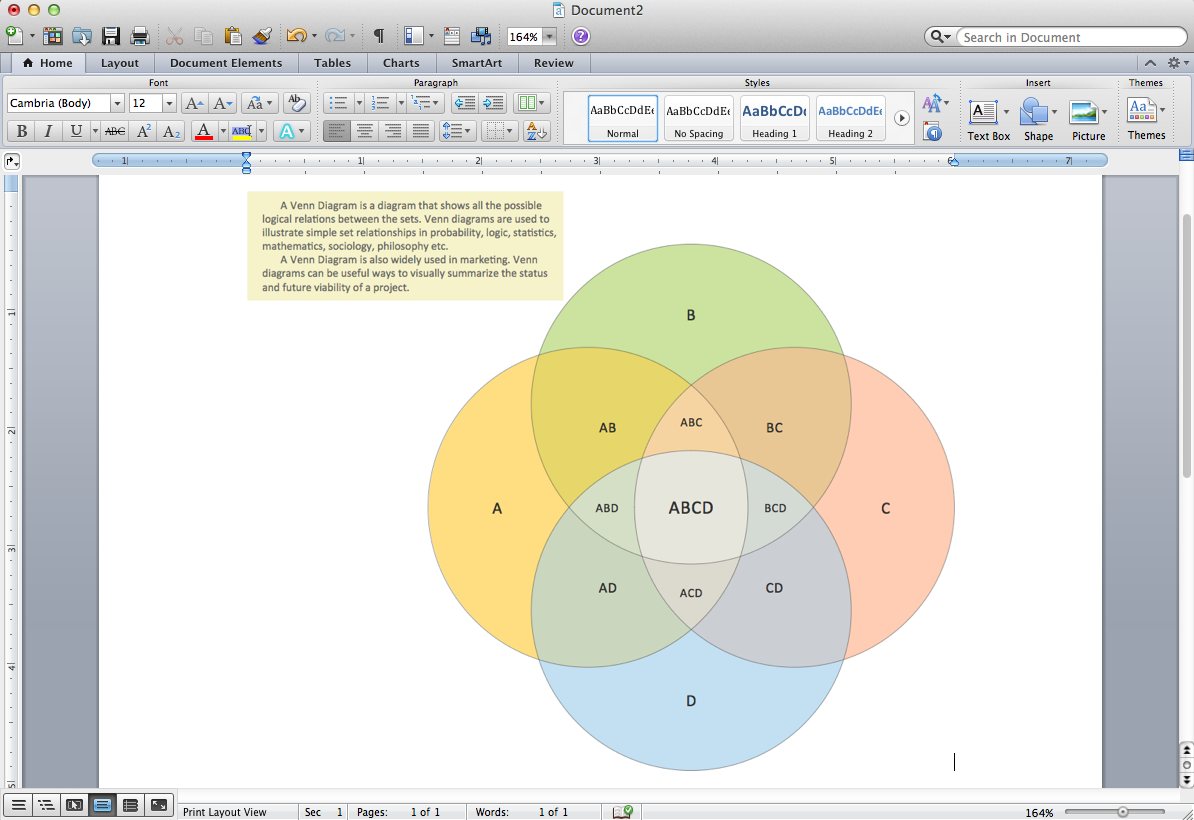
Picture: Venn Diagram Template for Word
Related Solution:
ConceptDraw Column Chart software allows drawing column charts using predesigned objects or drawing tools. In ConceptDraw Column Chart software you can find a complete set of column chart tools and objects.
Picture: Column Chart Software
Related Solution:
When trying to figure out the nature of the problems occurring within a project, there are many ways to develop such understanding. One of the most common ways to document processes for further improvement is to draw a process flowchart, which depicts the activities of the process arranged in sequential order — this is business process management. ConceptDraw DIAGRAM is business process mapping software with impressive range of productivity features for business process management and classic project management. This business process management software is helpful for many purposes from different payment processes, or manufacturing processes to chemical processes. Business process mapping flowcharts helps clarify the actual workflow of different people engaged in the same process. This samples were made with ConceptDraw DIAGRAM — business process mapping software for flowcharting and used as classic visio alternative because its briefly named "visio for mac" and for windows, this sort of software named the business process management tools.
This flowchart diagram shows a process flow of project management. The diagram that is presented here depicts the project life cycle that is basic for the most of project management methods. Breaking a project into phases allows to track it in the proper manner. Through separation on phases, the total workflow of a project is divided into some foreseeable components, thus making it easier to follow the project status. A project life cycle commonly includes: initiation, definition, design, development and implementation phases. Distinguished method to show parallel and interdependent processes, as well as project life cycle relationships. A flowchart diagram is often used as visual guide to project. For instance, it used by marketing project management software for visualizing stages of marketing activities or as project management workflow tools. Created with ConceptDraw DIAGRAM — business process mapping software which is flowcharting visio alternative or shortly its visio for mac, this sort of software platform often named the business process management tools.
Picture: Process Flowchart
Related Solution:
As restaurant industry is growing rapidly nowadays, researches show that almost half of the adults have worked in a restaurant or a cafe. Moreover, many of them dream to start their own someday. Unfortunately, it takes a lot of time to write a business plan and to find a great location, although some know how to create a restaurant floor plan in minutes or how to plan budget effortlessly. Hiring employees can also cause a lot of headache, but this is crucial for further success, because every guest comes to restaurant for a good service and delicious food. It is also worth noting that restaurant concept is also important, because it defines target audience and influences the menu.
This diagram represents the floor plan of an ongoing sports-theme establishment - restaurant, cafe, or other food service. A number of widescreen monitors installed along the perimeter provide visitors the opportunity to follow the course of a match from anywhere in the dining room of restaurant or cafe. The most of sports fans believe that food and alcohol is a big part of any sports show. That is why the dining room takes the most space - almost 60% of the total establishment space. Nearly all sports fans consume beverages while watching sports - beer, soda or water at least. Thus, the restaurant floor plan designers added a large lavatory there. Moreover, project developers considered unnecessary the gender division of such delicate place - perhaps they guess that only men are watching football, or believe that alcohol will eliminate the most of gender differences.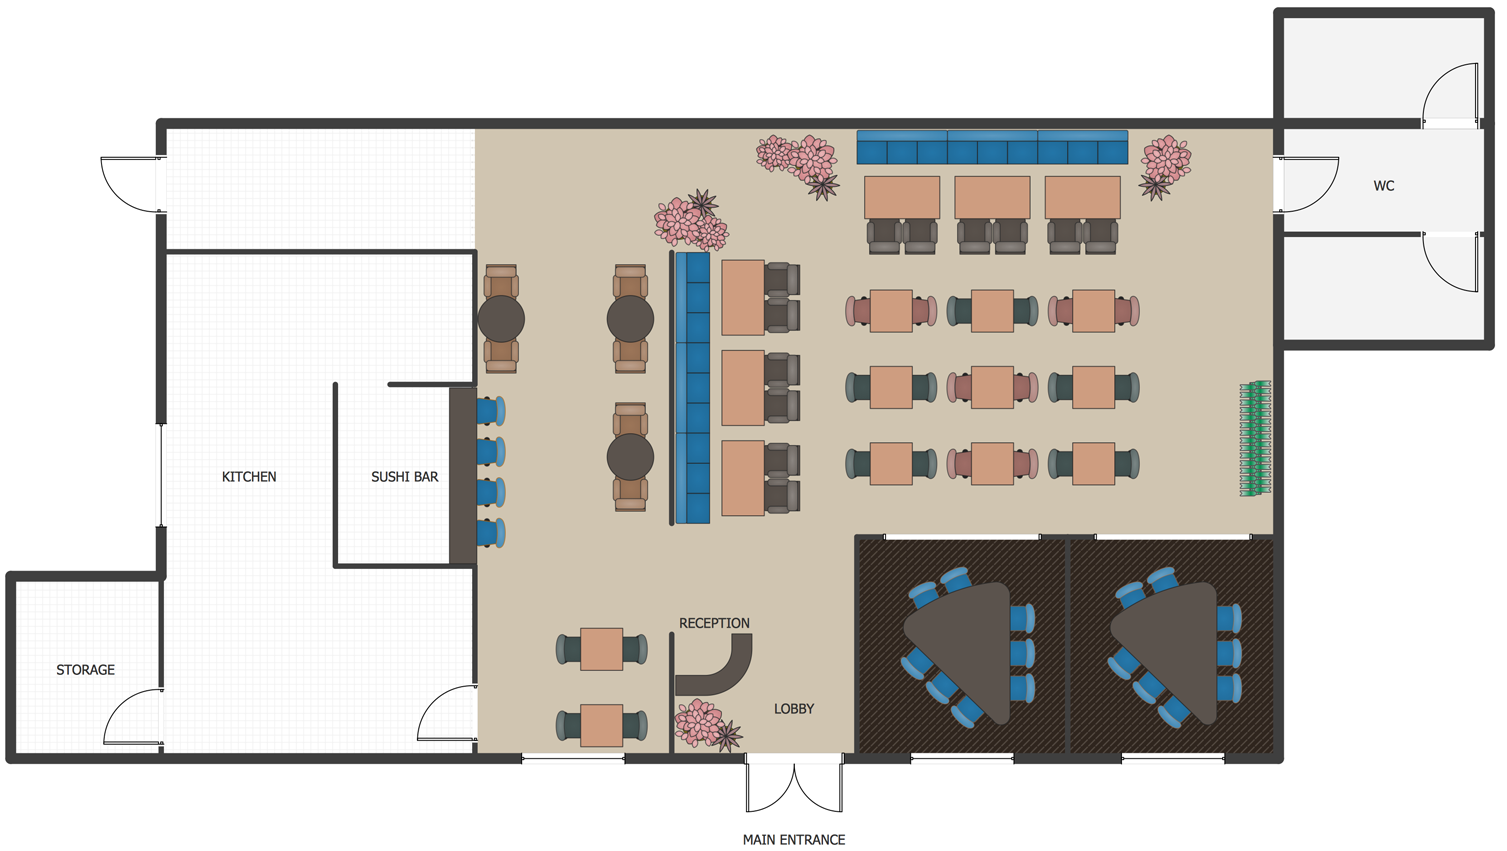
Picture: How To Create Restaurant Floor Plan in Minutes
Related Solution:
The best bar chart software ever is ConceptDraw. ConceptDraw bar chart software provides an interactive bar charting tool and complete set of predesigned bar chart objects.
Picture: Bar Chart Software
Related Solution:
Create bar charts for visualizing problem solving in manufacturing and economics using the ConceptDraw DIAGRAM diagramming and vector drawing software extended with the Bar Graphs Solution from the Graphs and Charts area of ConceptDraw Solition Park.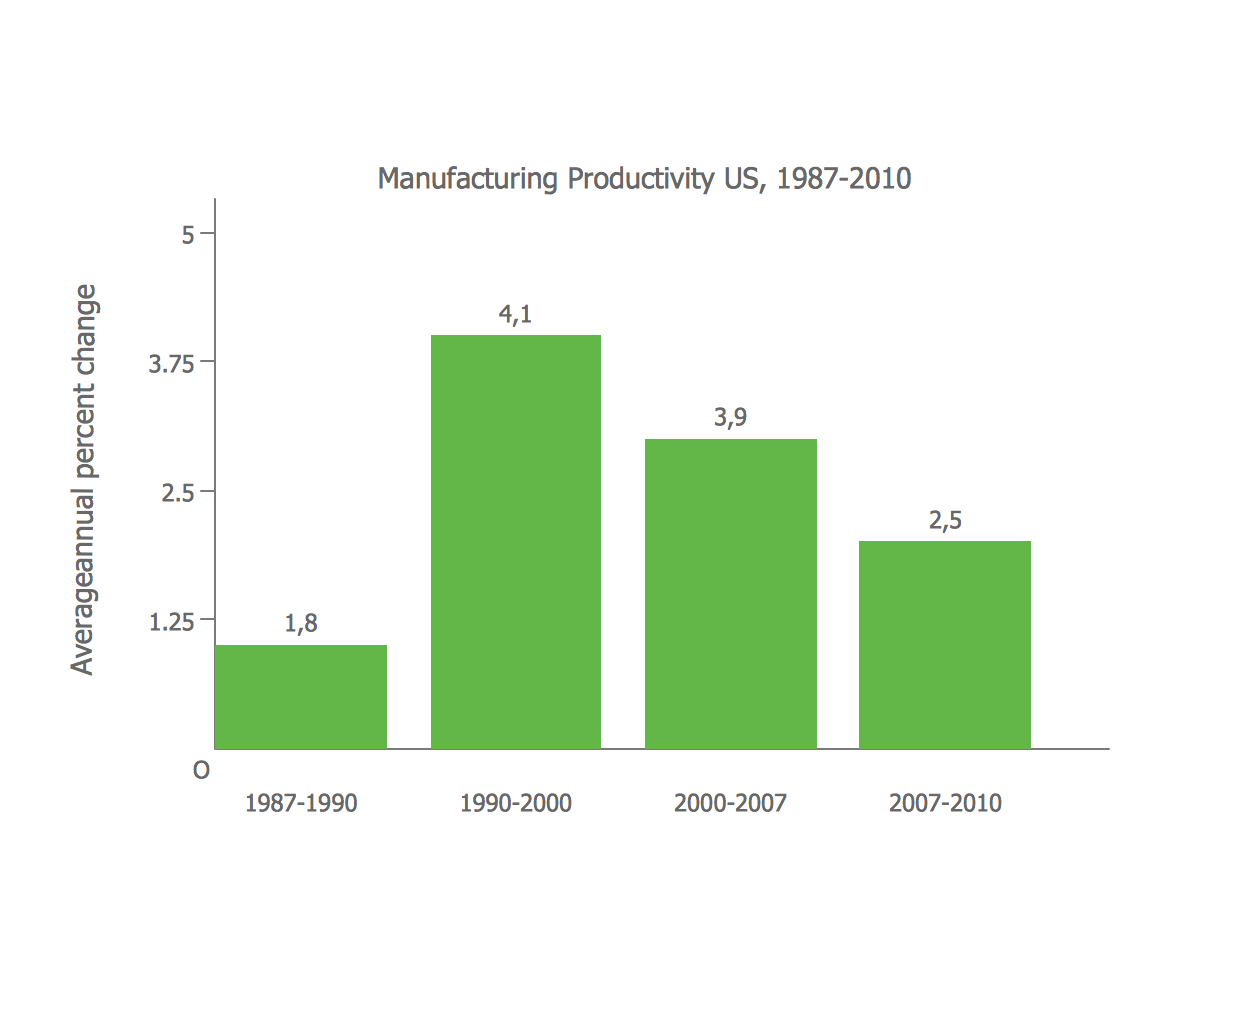
Picture: Bar Diagrams for Problem Solving. Create manufacturing and economics bar charts with Bar Graphs Solution
Related Solution:
Teams working with Scrum methodology use the product backlog items (PBIs), bug work item types (WITs), reports and dashboards. SCRUM Workflow solution for ConceptDraw DIAGRAM software offers collection of samples, variety of predesigned objects, clipart and graphic elements, a set of Scrum process work items and workflow which are developed for agile teams working using Scrum.
Picture: Scrum process work items and workflow
Related Solution:
Electrical plan is a document that is developed during the first stage of the building design. This scheme is composed of conventional images or symbols of components that operate by means of electric energy. To simplify the creation of these schemes you can use house electrical plan software, which will not require a long additional training to understand how to use it. You only need to install the necessary software ant it’s libraries and you’ll have one less problem during the building projection.
Any building contains a number of electrical systems, including switches, fixtures, outlets and other lightening equipment. All these should be depicted in a building electrical plans and included to general building documentation. This home electrical plan displays electrical and telecommunication devices placed to a home floor plan. On the plan, each electrical device is referenced with the proper symbol. Electrical symbols are used for universal recognition of the building plan by different persons who will be working on the construction. Not all possible electric symbols used on a certain plan, so the symbols used in the current home plan are included to a legend. The electrical home plan may be added as a separate document to a complete set of building plans.
Picture: How To use House Electrical Plan Software
Related Solution:
The Total Quality Management Diagram solution helps you and your organization visualize business and industrial processes. Create Total Quality Management diagrams for business process with ConceptDraw software.
Picture: TQM Diagram Example
Related Solution:

![[commons.wikimedia.org]](commons.wikimedia.org/wiki/File:Composition_of_lunar_soil.svg)