Basic Network Diagram
How To Draw Basic Network Diagram
ConceptDraw has 10+ templates and 30+ examples of the basic network diagrams for drawing:
- 10Base-T Star Network Topology
- Bus Topology Diagram
- Common Network Diagram
- Common Network Topologies
- Communication Network
- Regional Cable Head-End Diagram
- System Design
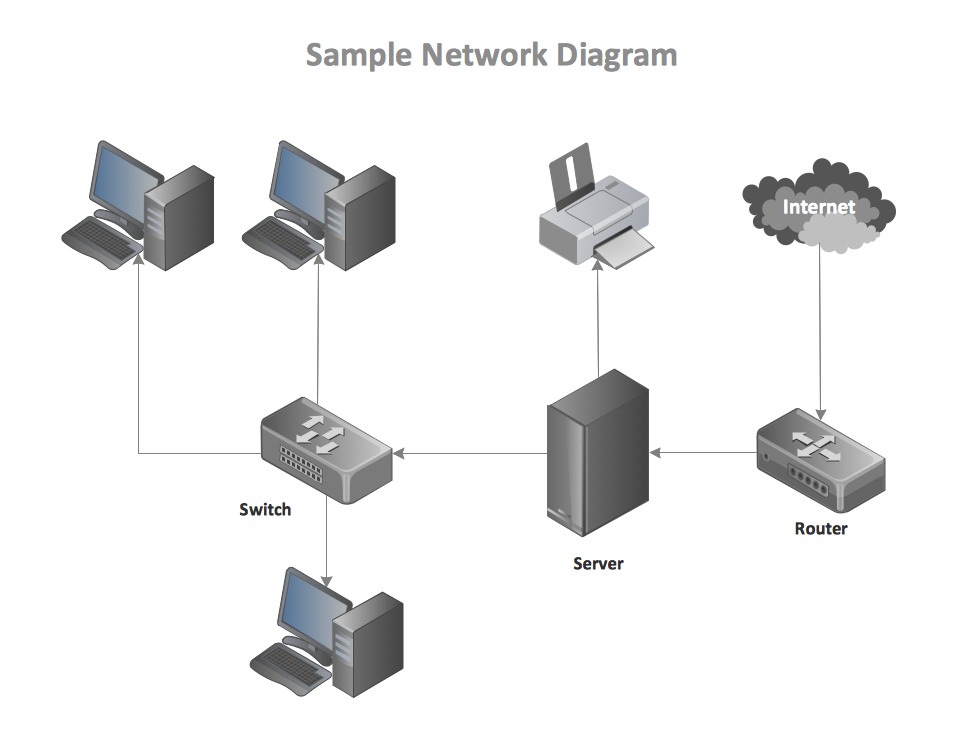
This basic network diagram sample is created using ConceptDraw DIAGRAM diagramming and vector drawing software enhanced with Computer & Networks solution from ConceptDraw Solution Park.
Computer & Networks solution provides libraries of symbols for network components and points, LAN and WAN, schematic and wiring drawings.
Use ConceptDraw DIAGRAM program with of Computer & Networks solution as tools to draw professional-looking network architecture, topology, design, layout and wiring diagrams quickly and easily, and to clearly present and communicate it to IT and telecom engineers, stakeholders and end-users.
TEN RELATED HOW TO's:
Event-Driven Process chain Diagrams for improvement throughout an organisation. Best software for Process Flow Diagram. The Event-driven Process Chain (EPC) Diagrams allows managers to plan processes and resources.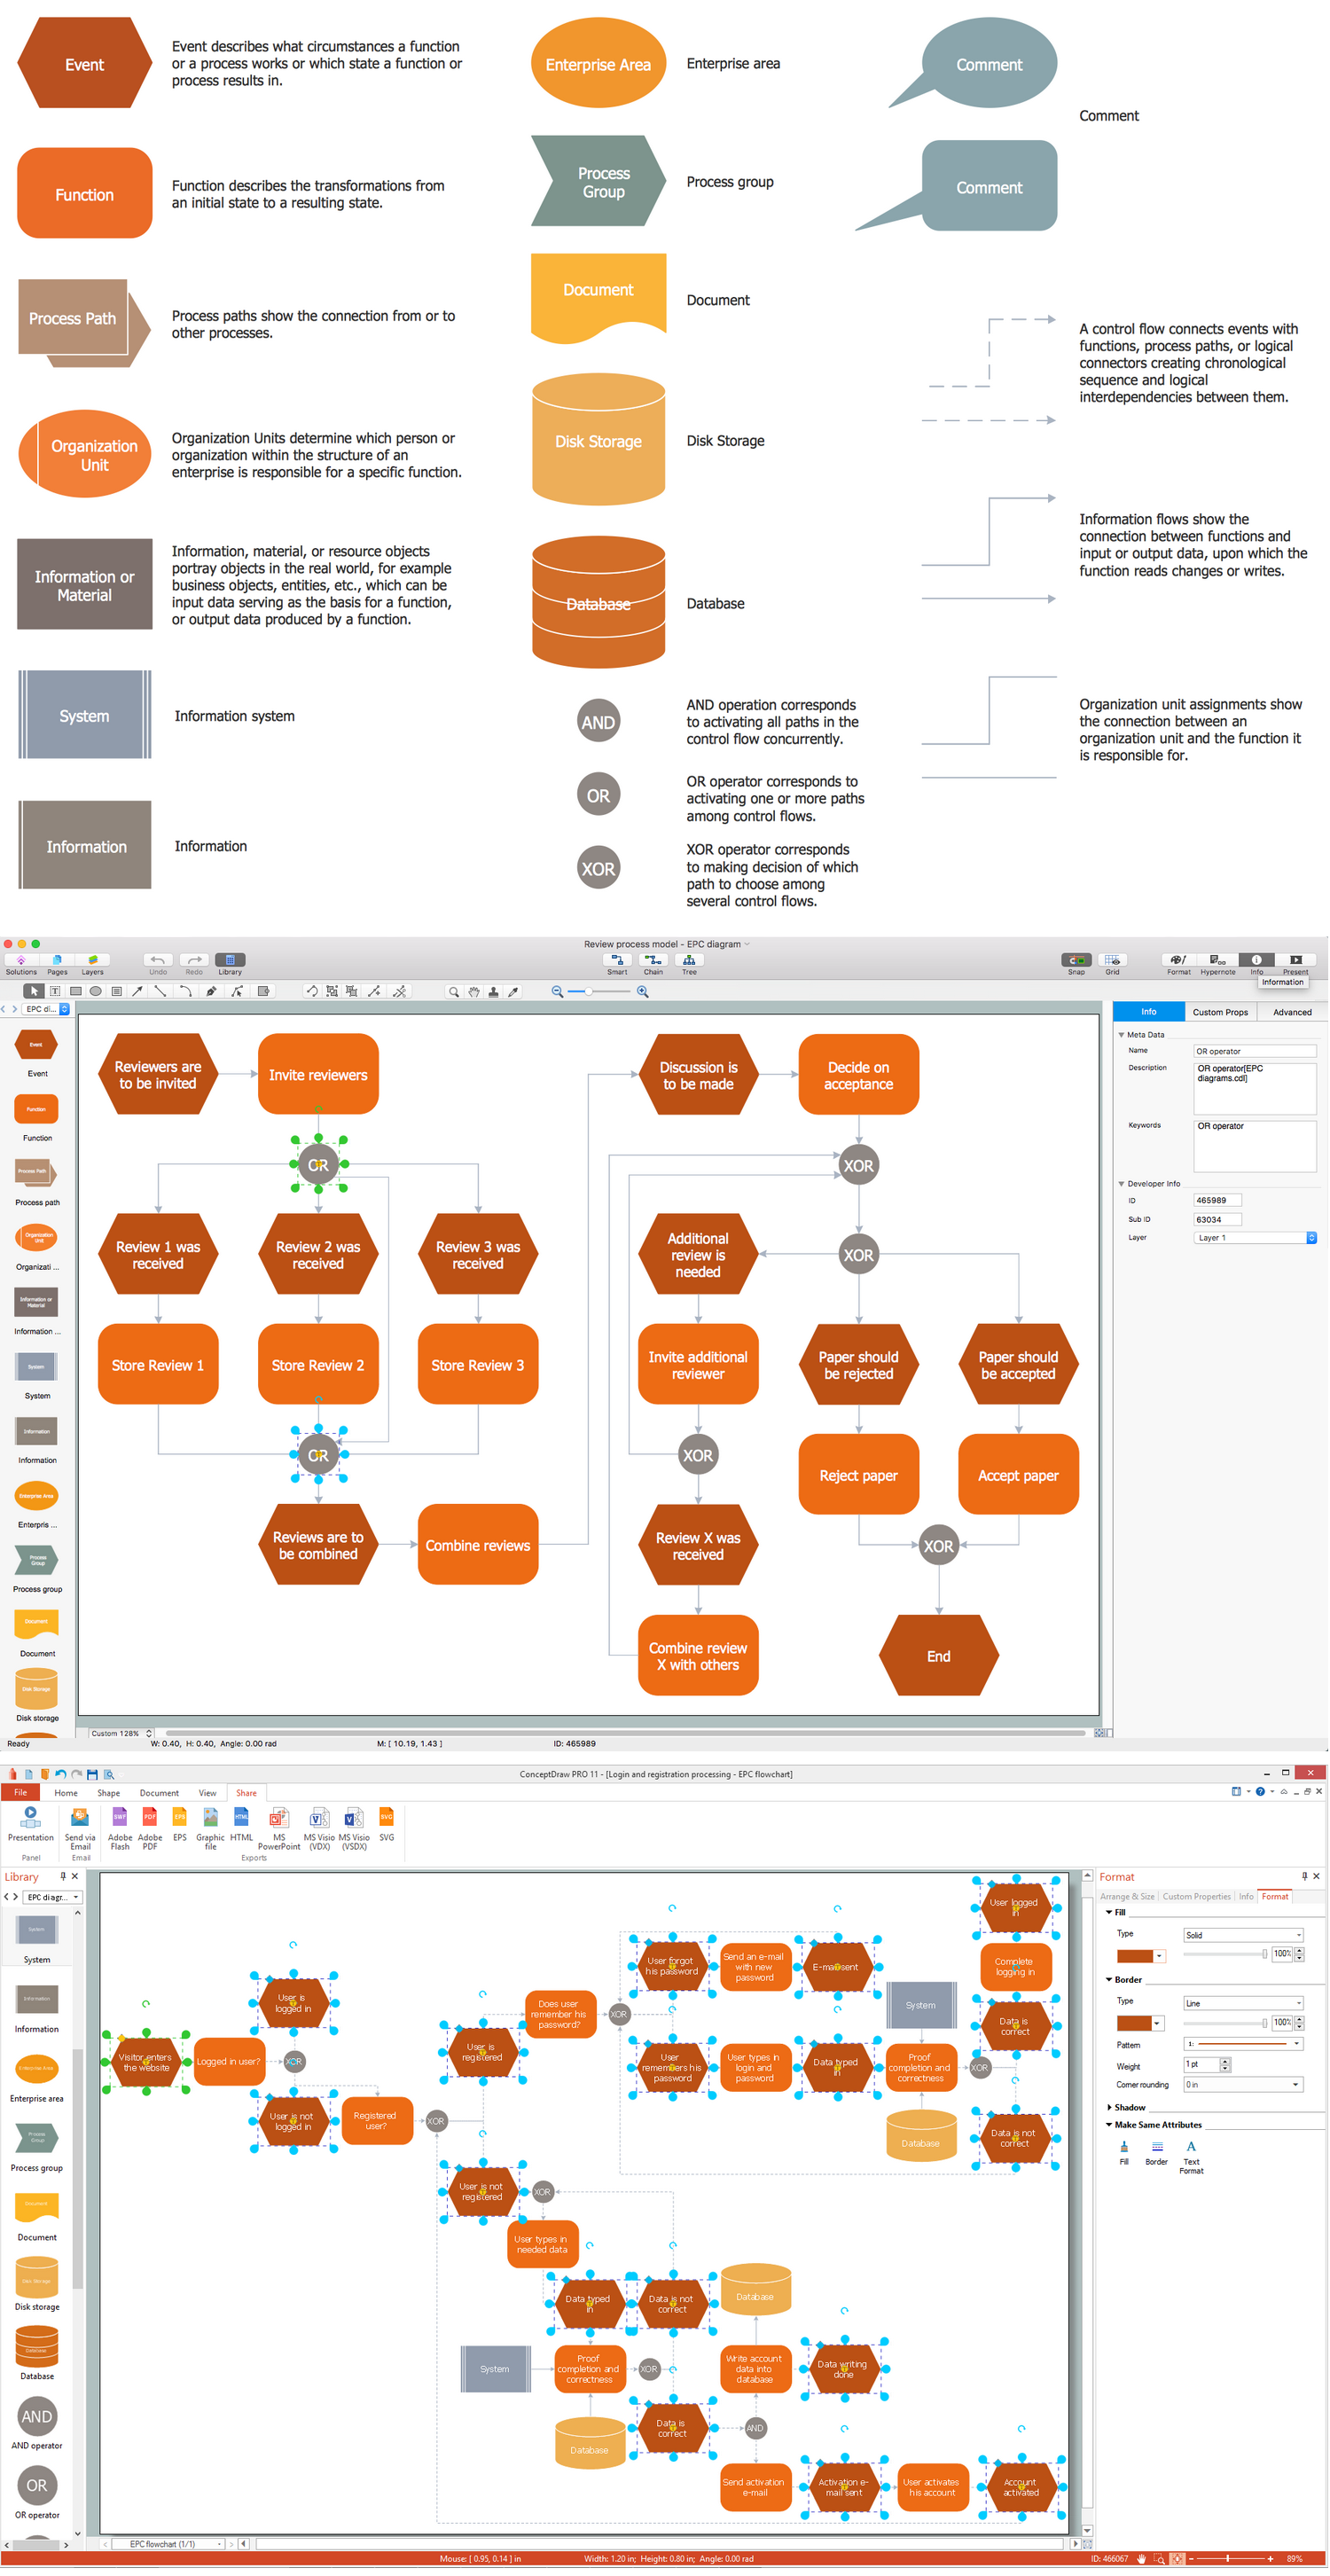
Picture: Business process Flow Chart — Event-Driven Process chain (EPC) diagrams
Related Solution:
This sample shows the Six Markets Model Chart. It was created in ConceptDraw DIAGRAM diagramming and vector drawing software using the Marketing Diagrams Solution from the Marketing area of ConceptDraw Solution Park.
The six markets model defines six markets that take the central place in the relationship marketing: internal markets, supplier markets, recruitment markets, referral markets, influence markets and customer markets. The six markets model allows the organization to analyze the stakeholders and key market domains that can be important to it.
Picture: Six Markets Model Chart
Related Solution:
The Rack Diagram visualizes in details the rack mounting of computer and network equipment, so it allows to show what equipment and racks are needed to buy, allows to estimate the rack rate and also helps to organize equipment on the racks virtually, without the real installation. To facilitate the rack diagrams designing, ConceptDraw DIAGRAM diagramming and vector drawing software was extended with Rack Diagrams Solution from the Computer and Networks Area.
Picture: Rack Rate
Related Solution:
Create bar charts for event management problem solving and visual data comparison using the ConceptDraw DIAGRAM diagramming and vector drawing software extended with the Bar Graphs Solution from the Graphs and Charts area of ConceptDraw Solition Park.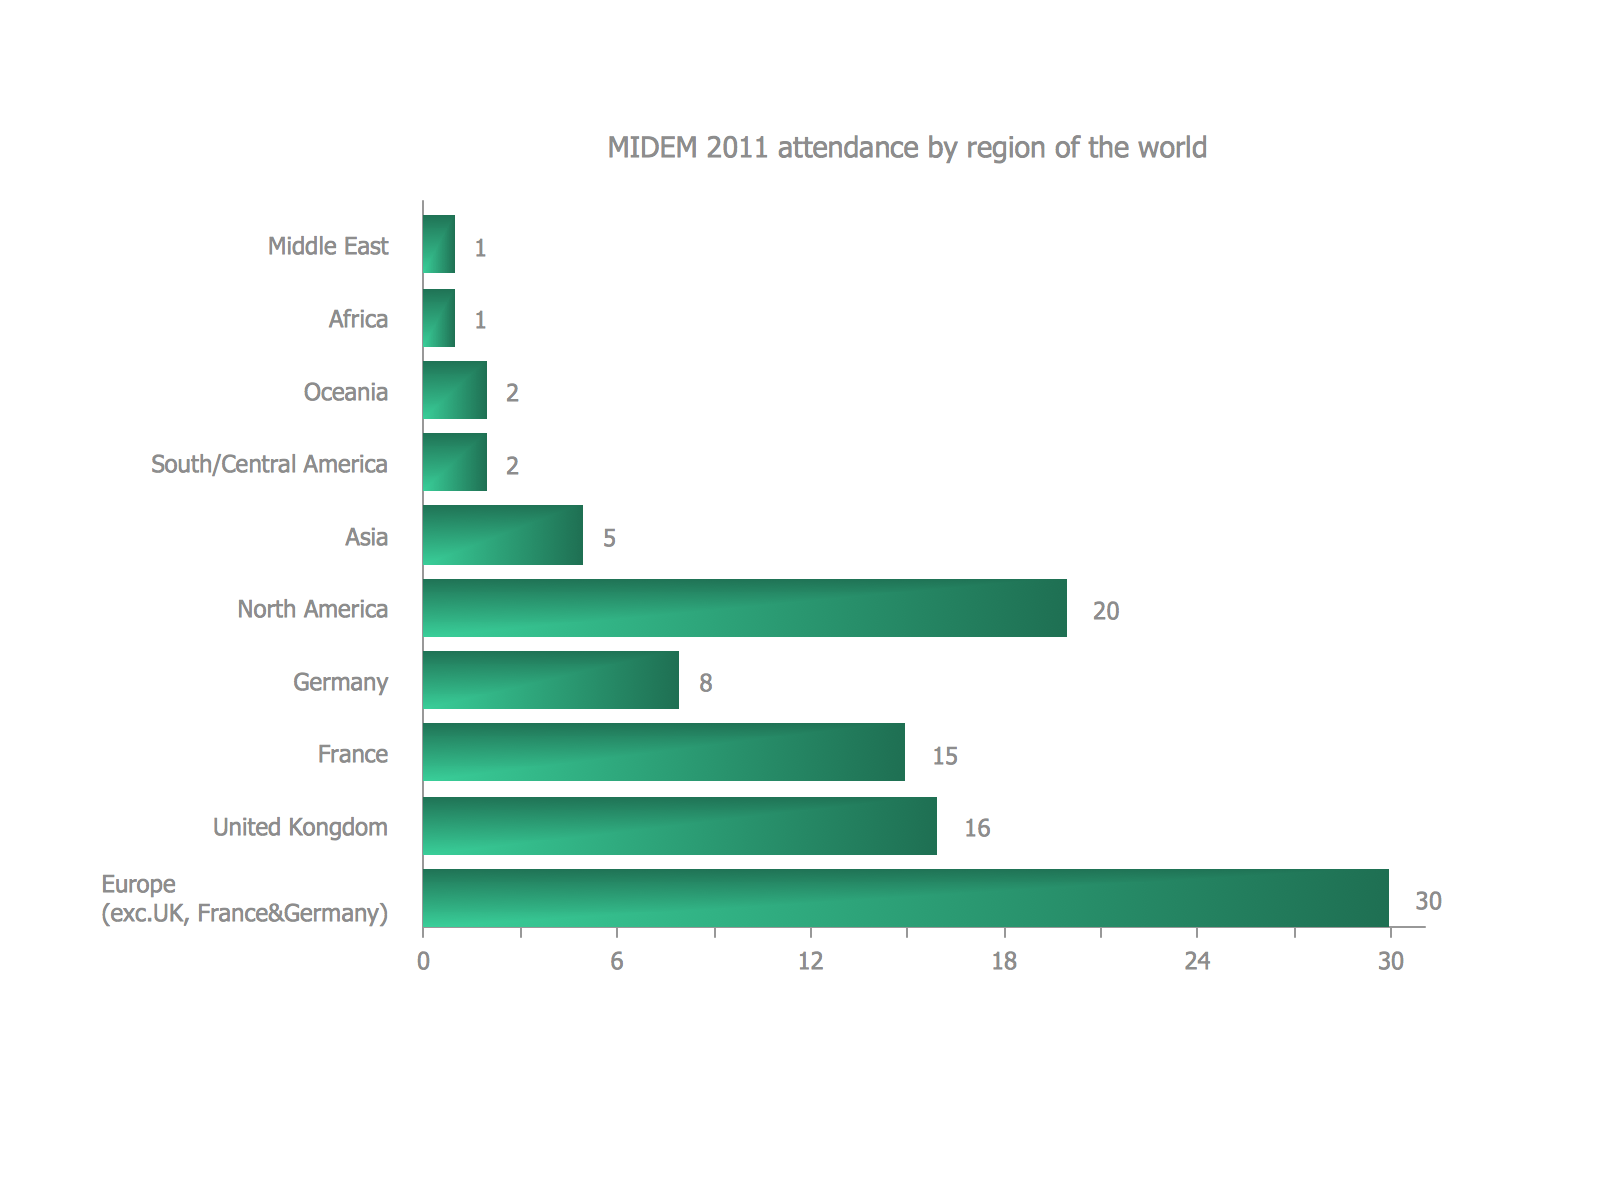
Picture: Bar Diagrams for Problem Solving.Create event management bar charts with Bar Graphs Solution
Related Solution:
ER diagram is the most popular database design tool which lets create graphical representations of database tables, their columns and also relationships. As for the Mac users, they are very interested in powerful database diagramming tools and ER diagram tool for OS X to design professional looking E-R Diagrams and ERD drawings. ConceptDraw DIAGRAM software on Mac OS X gives the ability to easy draw ERDs.
Picture: ER diagram tool for OS X
Related Solution:
Electrical plan is a document that is developed during the first stage of the building design. This scheme is composed of conventional images or symbols of components that operate by means of electric energy. To simplify the creation of these schemes you can use house electrical plan software, which will not require a long additional training to understand how to use it. You only need to install the necessary software ant it’s libraries and you’ll have one less problem during the building projection.
Any building contains a number of electrical systems, including switches, fixtures, outlets and other lightening equipment. All these should be depicted in a building electrical plans and included to general building documentation. This home electrical plan displays electrical and telecommunication devices placed to a home floor plan. On the plan, each electrical device is referenced with the proper symbol. Electrical symbols are used for universal recognition of the building plan by different persons who will be working on the construction. Not all possible electric symbols used on a certain plan, so the symbols used in the current home plan are included to a legend. The electrical home plan may be added as a separate document to a complete set of building plans.
Picture: How To use House Electrical Plan Software
Related Solution:
ConceptDraw DIAGRAM diagramming and vector drawing software extended with Computer Network Diagrams Solution from the Computer and Networks Area offers a set of useful tools, collection of templates, samples, and libraries of various computer symbols, computer devices icons, computer network icon for fast and easy drawing network computer diagrams and illustrations.
Picture: Network Icon
Related Solution:
While creating flowcharts and process flow diagrams, you should use special objects to define different statements, so anyone aware of flowcharts can get your scheme right. There is a short and an extended list of basic flowchart symbols and their meaning. Basic flowchart symbols include terminator objects, rectangles for describing steps of a process, diamonds representing appearing conditions and questions and parallelograms to show incoming data.
This diagram gives a general review of the standard symbols that are used when creating flowcharts and process flow diagrams. The practice of using a set of standard flowchart symbols was admitted in order to make flowcharts and other process flow diagrams created by any person properly understandable by other people. The flowchart symbols depict different kinds of actions and phases in a process. The sequence of the actions, and the relationships between them are shown by special lines and arrows. There are a large number of flowchart symbols. Which of them can be used in the particular diagram depends on its type. For instance, some symbols used in data flow diagrams usually are not used in the process flowcharts. Business process system use exactly these flowchart symbols.
Picture: Flowchart Symbols: Meaning and Examples
Related Solution:
Bar Diagrams for Problem Solving.Create economics and financial bar charts with Bar Graphs Solution →
Create bar graphs for visualizing economics problem solving and financial data comparison using the ConceptDraw DIAGRAM diagramming and vector drawing software extended with the Bar Graphs Solution from the Graphs and Charts area of ConceptDraw Solition Park.
Picture: Bar Diagrams for Problem Solving.Create economics and financial bar charts with Bar Graphs Solution
Related Solution:
Using diagrams, you can visualize the flow of the information or build a detailed data structure. There's no need to have a degree in software and database design with ConceptDraw DIAGRAM , because this software has all the tools needed in developing models and diagrams. Project planning, designing and prototyping was never so easy.
This UML diagrams can be used to visualize a model of the data base development process. A UML diagram shows a graphical view of a structure of software system: components and relationships.
Using Unified Modeling Language helps to depict logical and physical elements of a data base, visually represent requirements and sub-systems. UML diagrams allows developers to organize and predict critical issues, as well as collaborate data base information.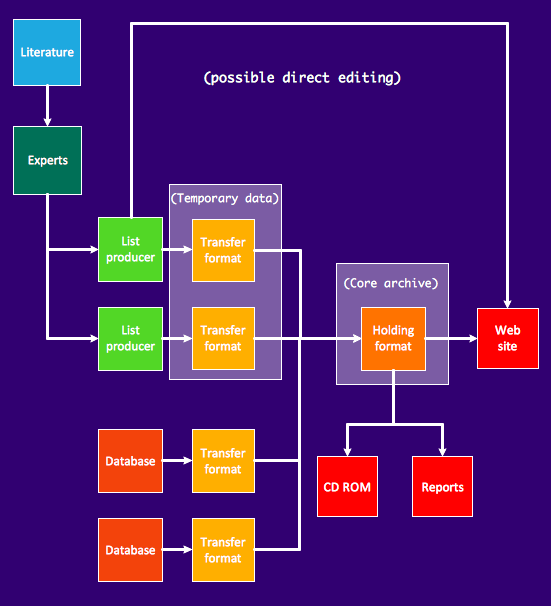
Picture: Software and Database Design with ConceptDraw DIAGRAM
Related Solution:
ConceptDraw
DIAGRAM 18