Beauty in nature Illustrations and Clipart
|
ConceptDraw DIAGRAM is complex of the great-looking examples and templates of a nature illustration diagrams. Nature solution expands our software possibilities to create beautiful illustrations and clip arts with the new library which contains 17 vector objects. Users can export resulting diagram to PDF, PowerPoint, and other popular graphic formats. |
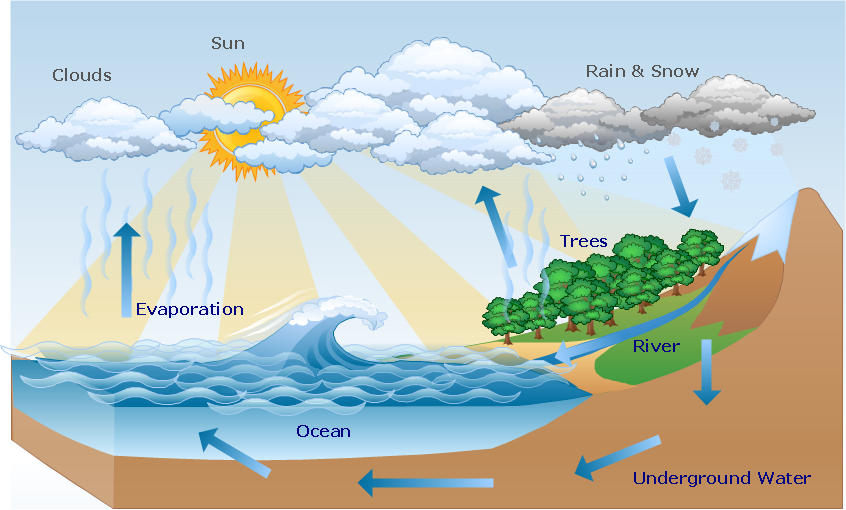
Pic.1 Hydrologic cycle diagram.
This diagram shows water movement in hydrosphere, atmosphere and below the Earth surface.
See also Samples:
TEN RELATED HOW TO's:
While creating flowcharts and process flow diagrams, you should use special objects to define different statements, so anyone aware of flowcharts can get your scheme right. There is a short and an extended list of basic flowchart symbols and their meaning. Basic flowchart symbols include terminator objects, rectangles for describing steps of a process, diamonds representing appearing conditions and questions and parallelograms to show incoming data.
This diagram gives a general review of the standard symbols that are used when creating flowcharts and process flow diagrams. The practice of using a set of standard flowchart symbols was admitted in order to make flowcharts and other process flow diagrams created by any person properly understandable by other people. The flowchart symbols depict different kinds of actions and phases in a process. The sequence of the actions, and the relationships between them are shown by special lines and arrows. There are a large number of flowchart symbols. Which of them can be used in the particular diagram depends on its type. For instance, some symbols used in data flow diagrams usually are not used in the process flowcharts. Business process system use exactly these flowchart symbols.
Picture: Flowchart Symbols: Meaning and Examples
Related Solution:
The Nature Solution addition to ConceptDraw Solution Park for ConceptDraw DIAGRAM includes new libraries that provide a wide range nature objects and it can be used to augment documentation and graphics. Draw beautiful nature scenes using ConceptDraw DIAGRAM software with Nature solution.
Picture: Beautiful Nature Scene: Drawing
A flowchart is a simple but very functional tool when it comes to understanding a workflow or to removing unnecessary stages from a process. When drawing flowcharts, keep in mind that there are four common types of flowcharts, like document flowcharts and data flowcharts that show control over a data or document flow over a system. To show controls on a physical level, use system flowcharts. In addition, to show controls in a program, you can draw a program flowchart.
This flowchart diagram represents the piece of an article editing process, that involves the author and editor. It was created using the Basic Flowchart notation that consists from the basic flowchart symbols. The start and the end of the process are indicated with "Terminator" symbols. The "Process" symbols show the action steps consisting from making edits and searching for a compromise, when the author does not agree with the suggestions of the editor. The "Process" symbol is the general symbol in process flowcharts. The "Decision" symbol indicates a branching in the process flow. There are two branches indicated by a Decision shape in the current flowchart (Yes/No, Disagree/Agree). This basic flowchart can be used as a repeating unit in the workflow diagram describing the working process of some editorial office.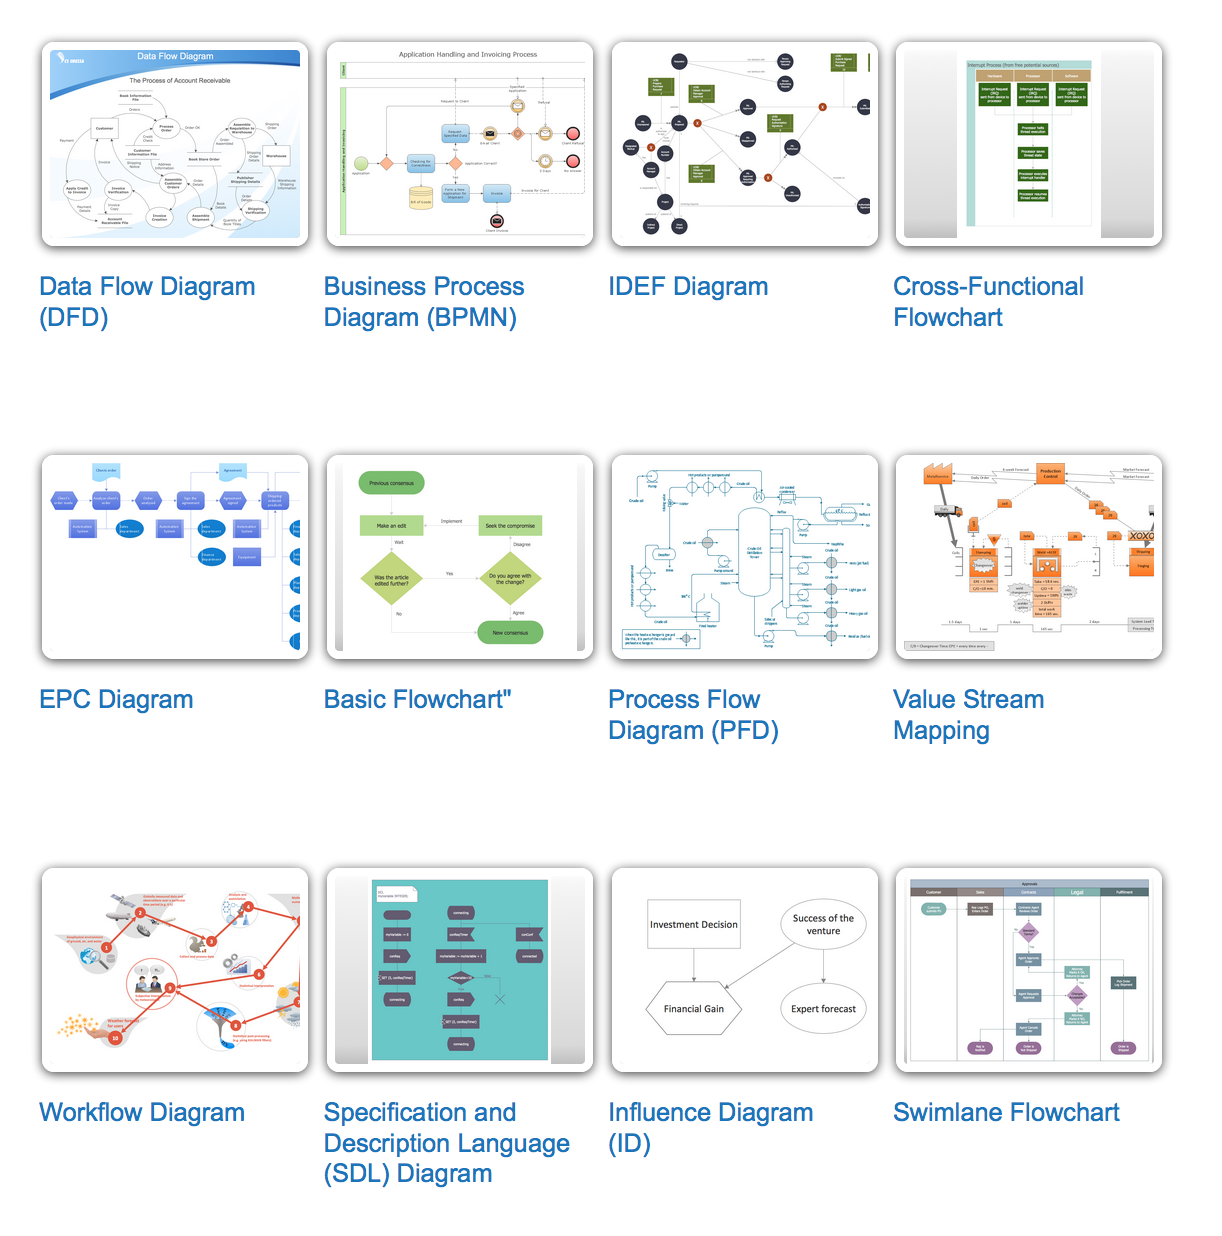
Picture: Types of Flowcharts
Related Solution:
ConceptDraw DIAGRAM software extended with Picture Graphs solution is the best choice for making professional looking pictures of graphs and colorful picture graphs.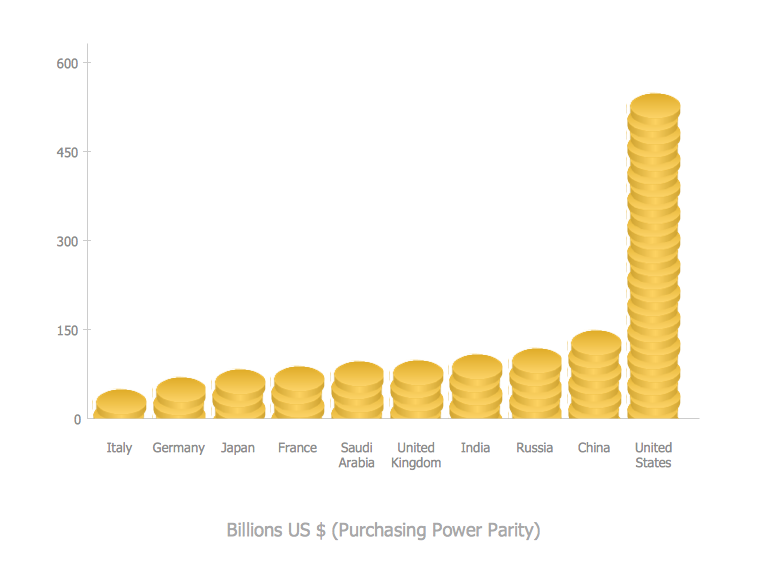
Picture: Pictures of Graphs
Related Solution:
Use it to make professional looking documents, presentations, and websites illustrated with color scalable vector clipart for geography, weather, and animals.
Picture: Clipart School Example
Related Solution:
In the course of recent decades data visualization went through significant development and has become an indispensable tool of journalism, business intelligence and science. The way visual information may be conveyed is not limited simply to static or dynamic representation, it can also be interactive. Infographics can be conditionally divided into several general levels. Primarily, this is level of visualization of information, its interpretation and association on any ground. Second level can be defined as a visualization of knowledge, depiction of thoughts and ideas in the form of images or diagrams. Finally, the level of data visualization, which processes data arrays in charts, enabling the information to be more clearly perceived. You can also identify the main approaches to the creation of infographics: exploratory and narrative. Exploratory method insists on minimalist design in favor of data precision without unnecessary details and is common for scientific researches and ana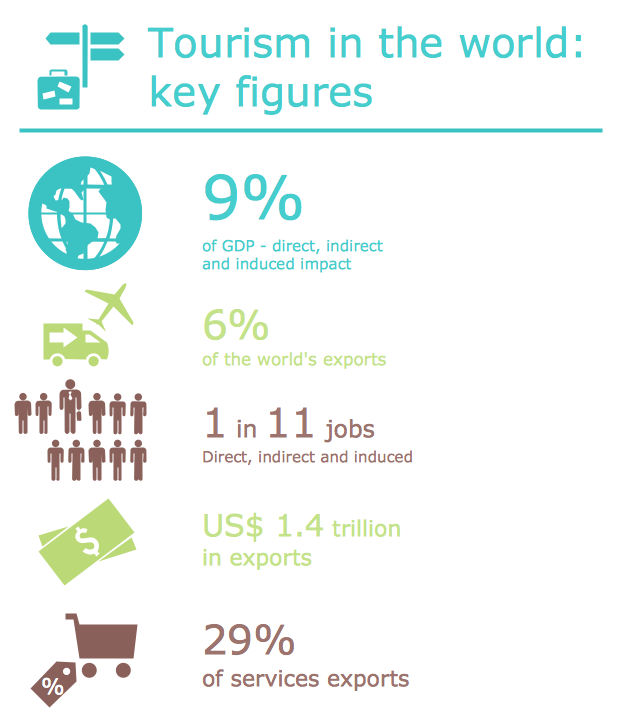
Picture: Design Pictorial Infographics. Design Infographics
Related Solution:
Every interior design project starts from a deep understanding of all the utilities used in the building. In the first place, plumbing projection stage is crucial for the future design because it is very important to fit all the elements in their places correctly. Kitchen interior, for instance, will depend on the plumbing very much.
Planning the layout of bathroom facilities, plumbing and sanitary equipment is a critical stage of the interior design of the entire house. Suppose, you do not need to see grill in your bathroom and the toilet in your kitchen, you need to give the proper consideration to the plumbing and piping planning. The ConceptDraw Plumbing and Piping Plans solution delivers the kit of 4 vector libraries containing more than 120 elements as pumps, tanks, pipes, boilers and other bathroom equipment for depicting Plumbing & Piping Plans. Using the Plumbing library, enables designing plumbing and piping interior designs, schemes and blueprints of water supply and sewerage systems.
Picture: Interior Design. Plumbing — Design Elements
Related Solution:
Use ConceptDraw DIAGRAM software with Flowcharts Solution to create Process Flow Charts, Flow Chart Process Maps, and High-Level Process Flow Charts to illustrate ✔️ high-level processes in industrial, chemical, and process engineering, ✔️ major plant processes, ✔️ minor details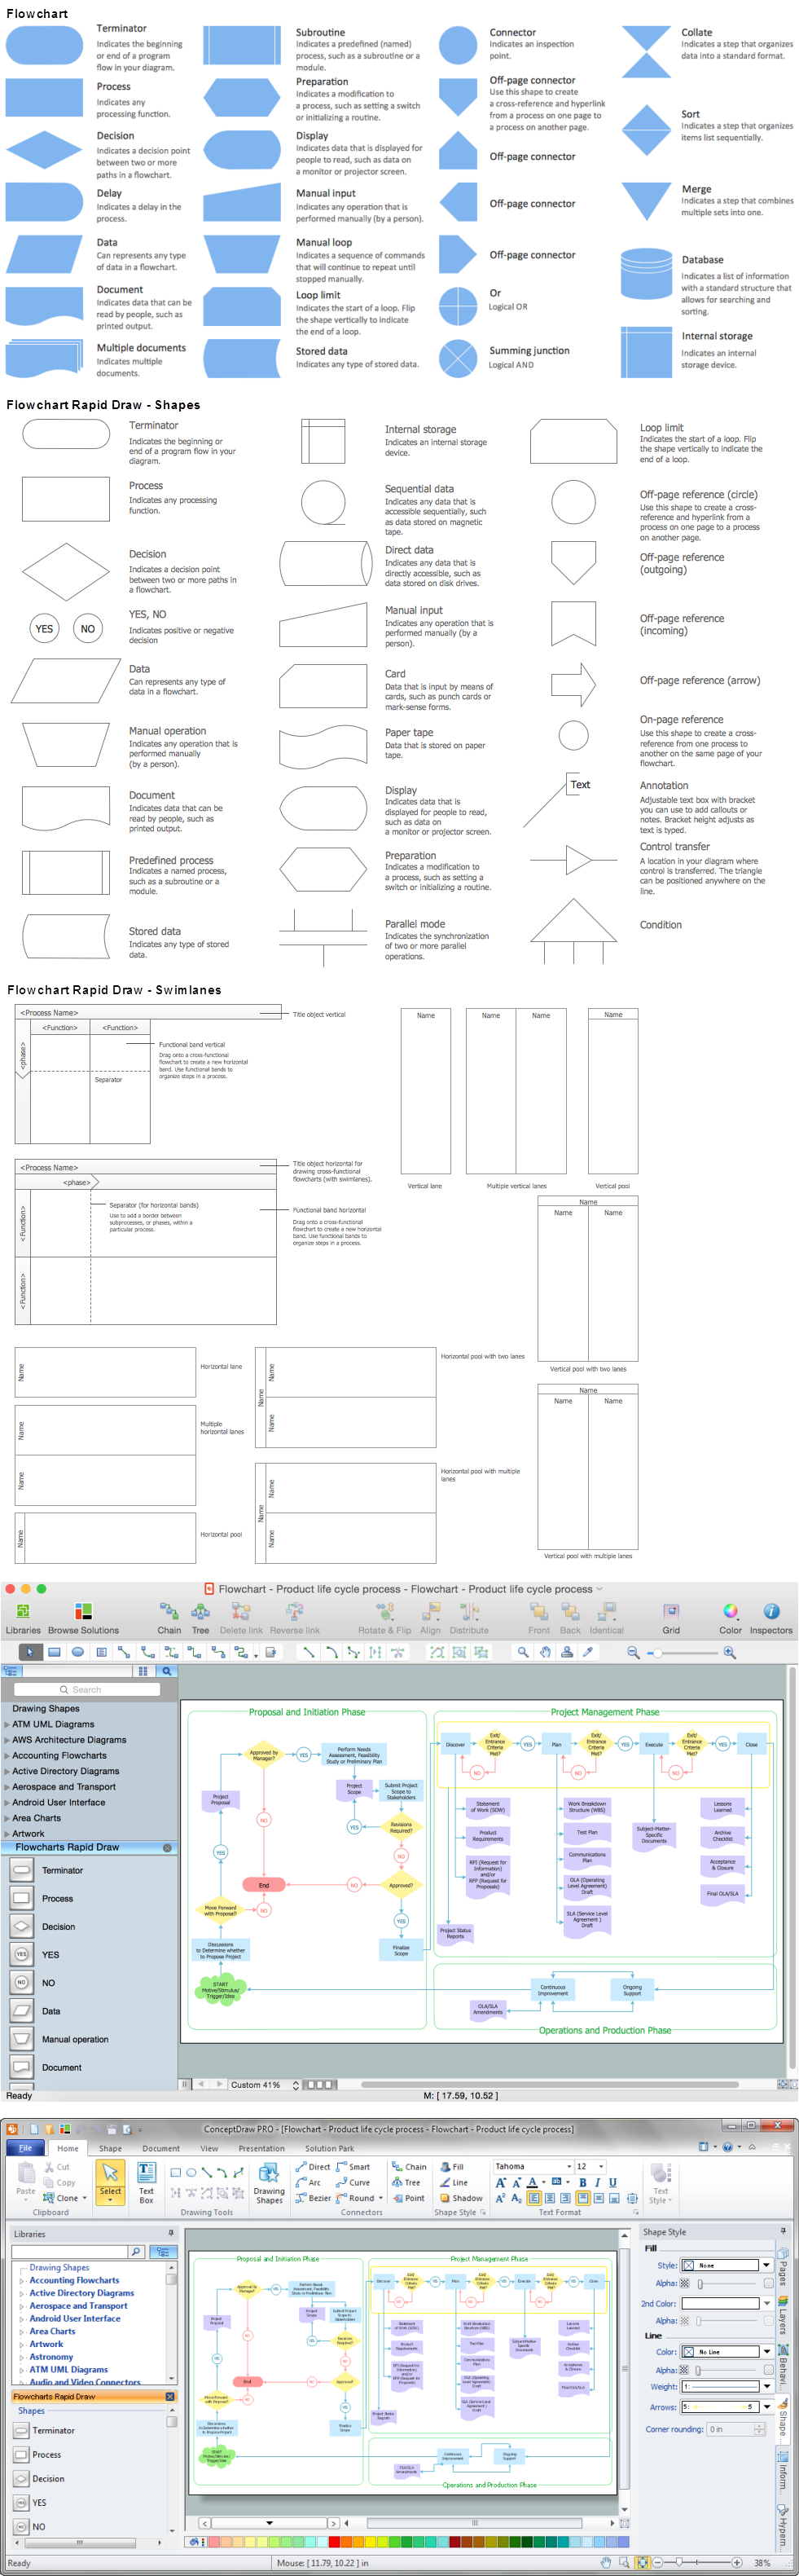
Picture: Process Flow Chart
Related Solution:
Start design your own flowchart with ConceptDraw DIAGRAM and accomplish great results at the moment.
Picture: Draw Flowcharts with ConceptDraw
Related Solution:
Nature solution expands ConceptDraw DIAGRAM software with samples, templates and libraries of vector clip art for drawing of Nature illustrations.
Use Geography library of vector stencils to draw natural landscapes.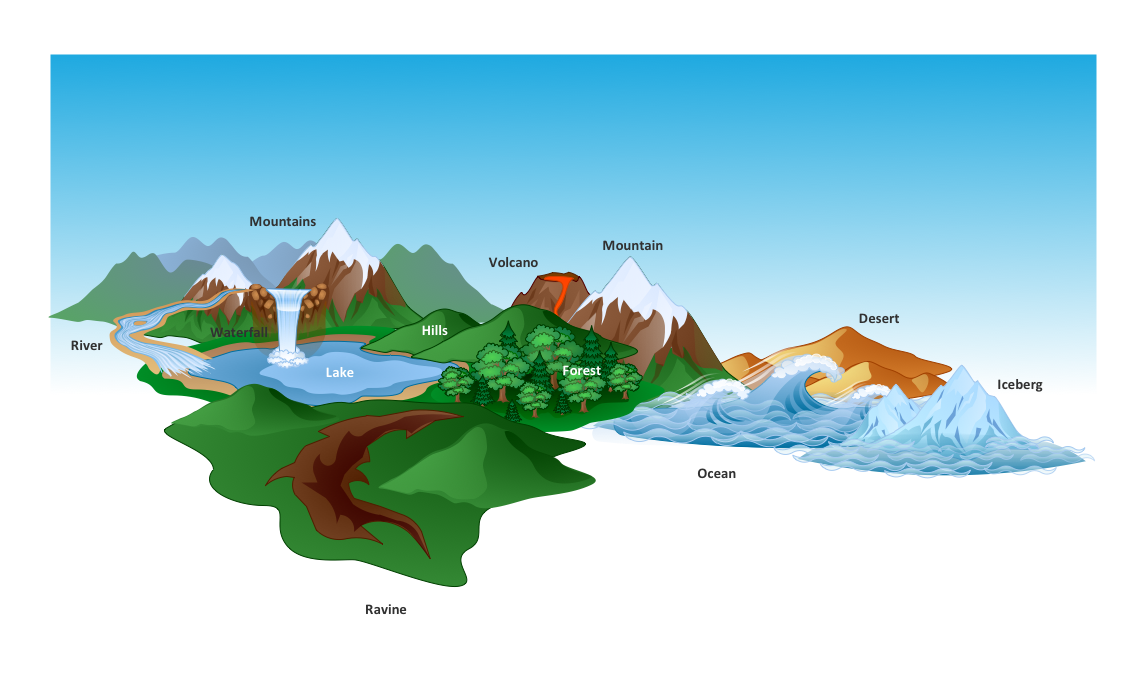
Picture: How to Draw a Natural Landscape
ConceptDraw
DIAGRAM 18