Best Diagramming Software for macOS
If you are looking for the best diagramming drawing software for your Mac, then a good option for you can be a ConceptDraw DIAGRAM one, extended with numerous solutions for simplifying your work with drawing diagrams, as well as charts, flowcharts, maps, schemes and other schematics, as ConceptDraw DIAGRAM gives all of its users the ability to draw the various diagrams within only a couple of hours or, sometimes, minutes, depending on how good you know it already. The “Basic Shapes solution” is a Mac OS software tool for drawing the business communication ideas and concepts, simple visual presentations full of numerical data and other.
There can be other variations of such kinds of diagrams and in order to draw them you need a useful software, which is, obviously, ConceptDraw DIAGRAM one, which can help you to make any needed chart, flowchart and/or diagram, as well as schemes and plans when you need them simply dragging the needed pre-made example from the appropriate solution and editing it the way you want your final result to look like.
Mac Drawing App
One of the diagrams which you can make in ConceptDraw DIAGRAM within a short period of time is a “bubble” one, also known as simply “bubble chart”. It is basically a type of chart, with help of which it is easy to display 3 different dimensions of the same data. Each of the entities with its triplet (e.g., v1, v2, v3) of the needed to be illustrated data is plotted in a way of a disk, expressing 2 of the vi values through the disk's xy location. The third of the v3 values is expressed through its size in any of the bubble charts, that are used for facilitating the understanding of social, medical, economical and other scientific relationships.
The mentioned bubble charts can be considered as a variation of the so called “scatter plot”, where data points are simply replaced with “bubbles”, which you can always use instead of a “scatter chart” itself in case your data has three data series, containing (each) a set of values, having the sizes of the bubbles determined by the values in the third data series.
The human visual system is known to be experiencing a disk's size in terms of its area, having the area of a disk not proportional to its radius. Instead, it is proportional to the square of the radius. Thus, in case someone chooses to scale the disks' radius to the third data values directly, then the size differences among the mentioned disks can be misleading and “non-linear”. In order to get a properly weighted scale, each of the disks’ radius must be scaled to the so called “square root” of the corresponding data value v3. The mentioned scaling issue can lead to different extreme misinterpretations. These misinterpretations can take place especially where the range of the needed data to be represented has a very large spread.
It’s well known that many people are quite unfamiliar with the issue as well as its impact on perception, being still aware of it, hesitating in interpreting a “bubble chart” for only a reason of being unable to assume that the scaling correction was already made. Thus, it is important to take into consideration that bubble charts can not only be scaled in one way, but also they can be clearly labelled to any document, conveying the data.
The so called “metaphoric” representation of all the needed data values to be represented in a way of the disk areas cannot be extended for displaying values which are negative (zero). As a fall-back, some of the users of bubble charts simply resort to graphic “symbology” in order to express the non-positive data values. This approach can be effective in such situations when data values' magnitudes (or “absolute values”) are being very important, and so they are being represented by so the called “congruent” (in case one of the disks has the same shape and size as the “mirror image” of the other or them having the same size and shape) disks.
In order to represent “zero-valued” data, some of the users dispense with disks altogether, using a square centred at the appropriate location. Any additional information about the entities apart from their “three primary values” can often be illustrated in a way of rendering their disks in colours and different patterns, chosen in a systematic way. And any supplemental information can be always added in a way of annotating disks with the textual information, identifying labels for cross-referencing to explanatory keys and the like.
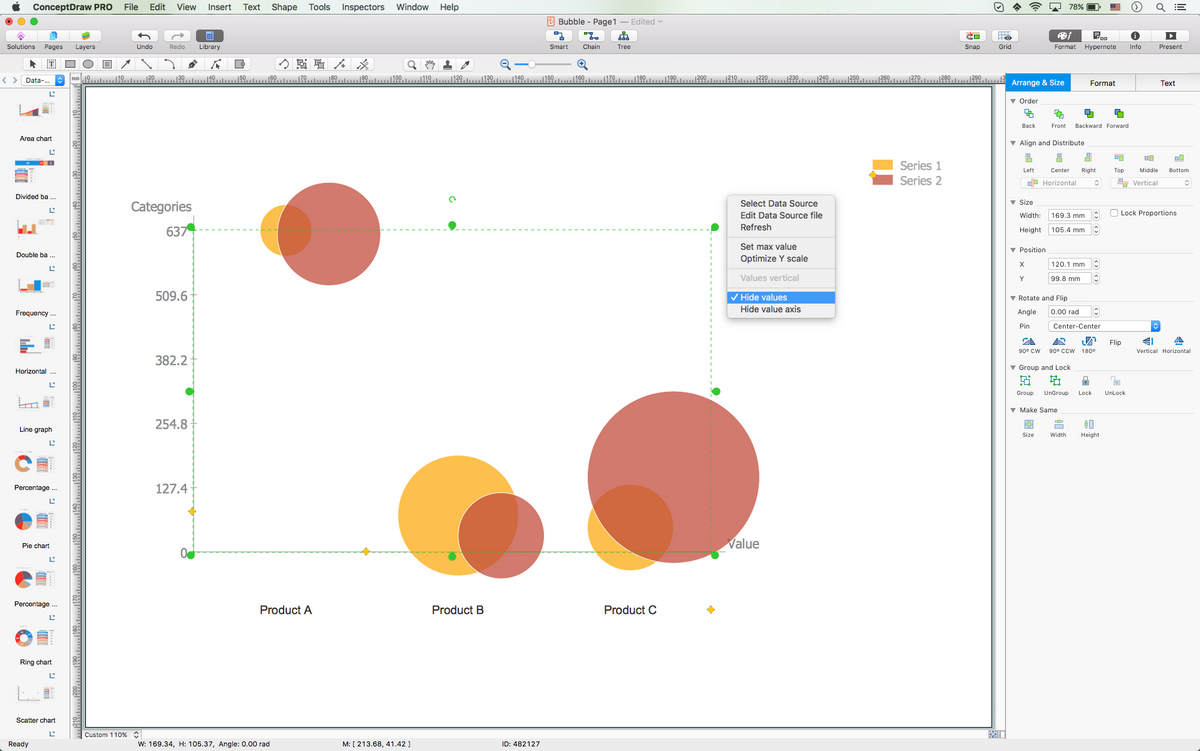
Sample 1. Best Diagramming Software for macOS
Having ConceptDraw DIAGRAM application you can always quickly create any needed diagram, including the “bubble” one and so then to export it to many graphic formats, including Microsoft PowerPoint, PDF file, MS Visio and other. In case it’s time to make the planned data flow diagram or flow chart, then you can simply download ConceptDraw DIAGRAM software, find the needed solution from this site or from ConceptDraw STORE application and edit the existing samples adding the needed design symbols, so your final flowchart will look truly professional.
ConceptDraw DIAGRAM software extended with the numerous solutions can be especially useful, if you have no idea where to start from and what to do about the drawings, which are all expected to be created by you within a short period of time. Once you need help, then CS Odessa team of IT specialists is here to recommend you to use one of the most progressive applications nowadays — ConceptDraw DIAGRAM
If you are looking for the alternative to Visio for Mac, then we can ensure you that ConceptDraw DIAGRAM is one of the best applications for such purposes, enables all of its users to create the needed flowcharts, diagrams, charts, maps, schemes and other smart looking schematics to use for their business presentations, documents or other documentation.
TEN RELATED HOW TO's:
Professional diagramming software for mac helps you create Cause and Effect diagram known as Fishbone diagram or Ishikawa diagram from ConceptDraw Business Solution.
You will be offered to use templates, samples or draw your diagram using ConceptDraw Arrows10 Technology
Picture: Draw Diagram on Mac
The knowledge and ability to apply various strategies for dealing with problems and difficult situations is very useful in many areas. The Fishbone strategy is one of the most progressive. This graphical technique helps to identify possible causes of problems, to set the goals, and also show internal connections between the different parts of problem. After reviewing all causes and facts, you can easily find right solution.
ConceptDraw DIAGRAM diagramming and vector drawing software extended with Fishbone Diagrams Solution from the Management Area of ConceptDraw Solution Park is a powerful Fishbone Problem Solving tool.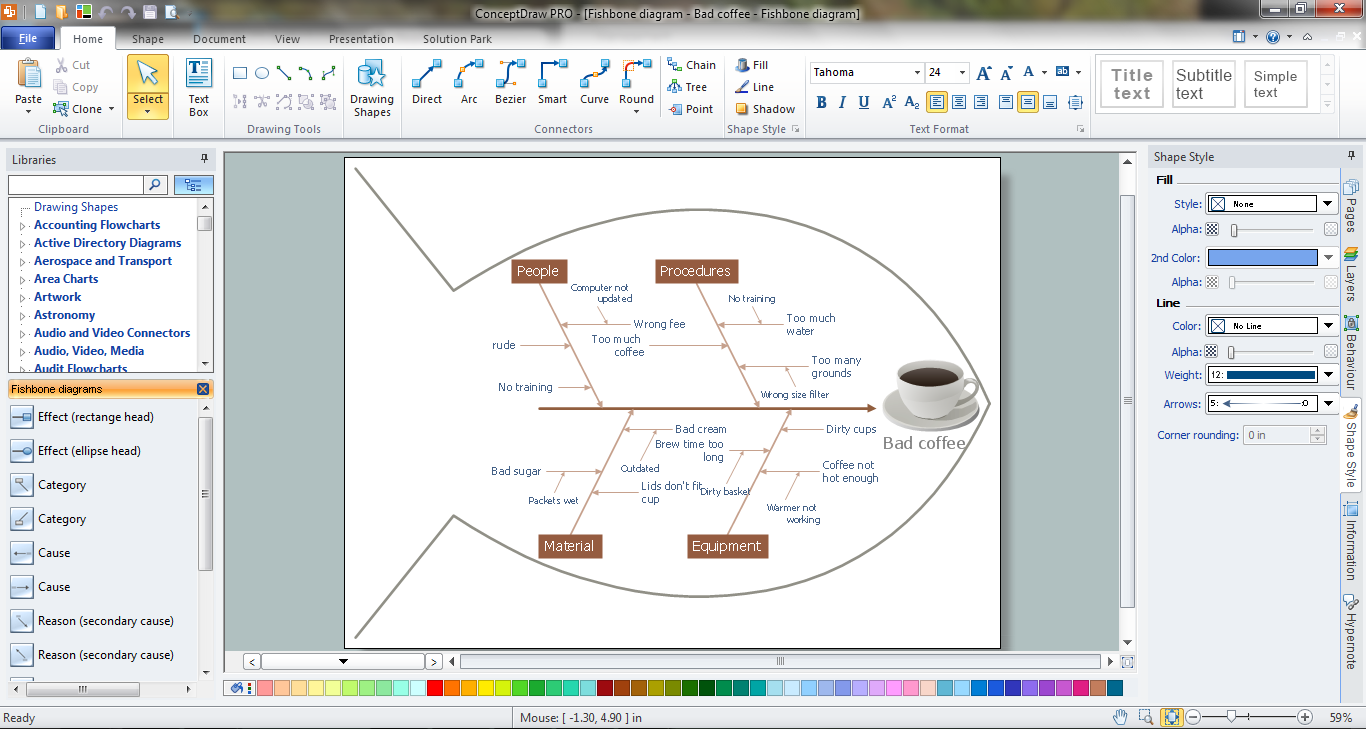
Picture: Fishbone Problem Solving
Related Solution:
The Line Graphs solution from Graphs and Charts area of ConceptDraw Solution Park contains a set of examples, templates and design elements library of scatter charts.
Use it to draw scatter graphs using ConceptDraw DIAGRAM diagramming and vector drawing software for illustrating your documents, presentations and websites.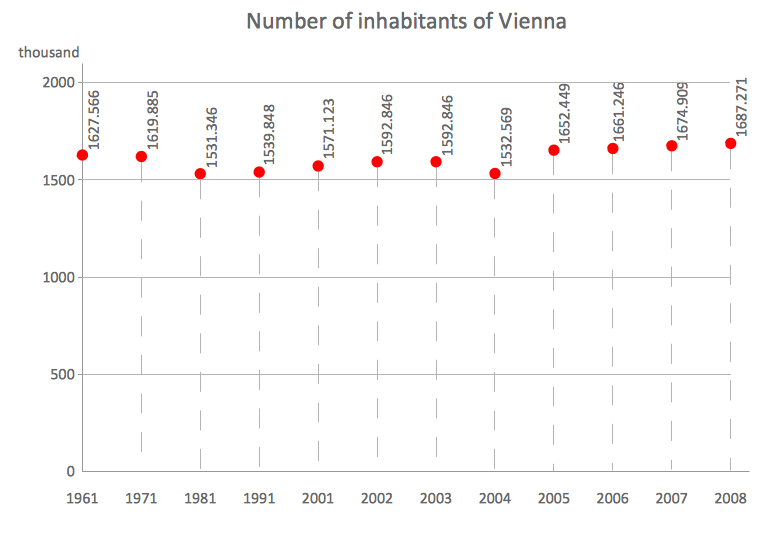
Picture: Scatter Chart Examples
Related Solution:
Electrical plan is a document that is developed during the first stage of the building design. This scheme is composed of conventional images or symbols of components that operate by means of electric energy. To simplify the creation of these schemes you can use house electrical plan software, which will not require a long additional training to understand how to use it. You only need to install the necessary software ant it’s libraries and you’ll have one less problem during the building projection.
Any building contains a number of electrical systems, including switches, fixtures, outlets and other lightening equipment. All these should be depicted in a building electrical plans and included to general building documentation. This home electrical plan displays electrical and telecommunication devices placed to a home floor plan. On the plan, each electrical device is referenced with the proper symbol. Electrical symbols are used for universal recognition of the building plan by different persons who will be working on the construction. Not all possible electric symbols used on a certain plan, so the symbols used in the current home plan are included to a legend. The electrical home plan may be added as a separate document to a complete set of building plans.
Picture: How To use House Electrical Plan Software
Related Solution:
Create bar charts for visualizing problem solving in manufacturing and economics using the ConceptDraw DIAGRAM diagramming and vector drawing software extended with the Bar Graphs Solution from the Graphs and Charts area of ConceptDraw Solition Park.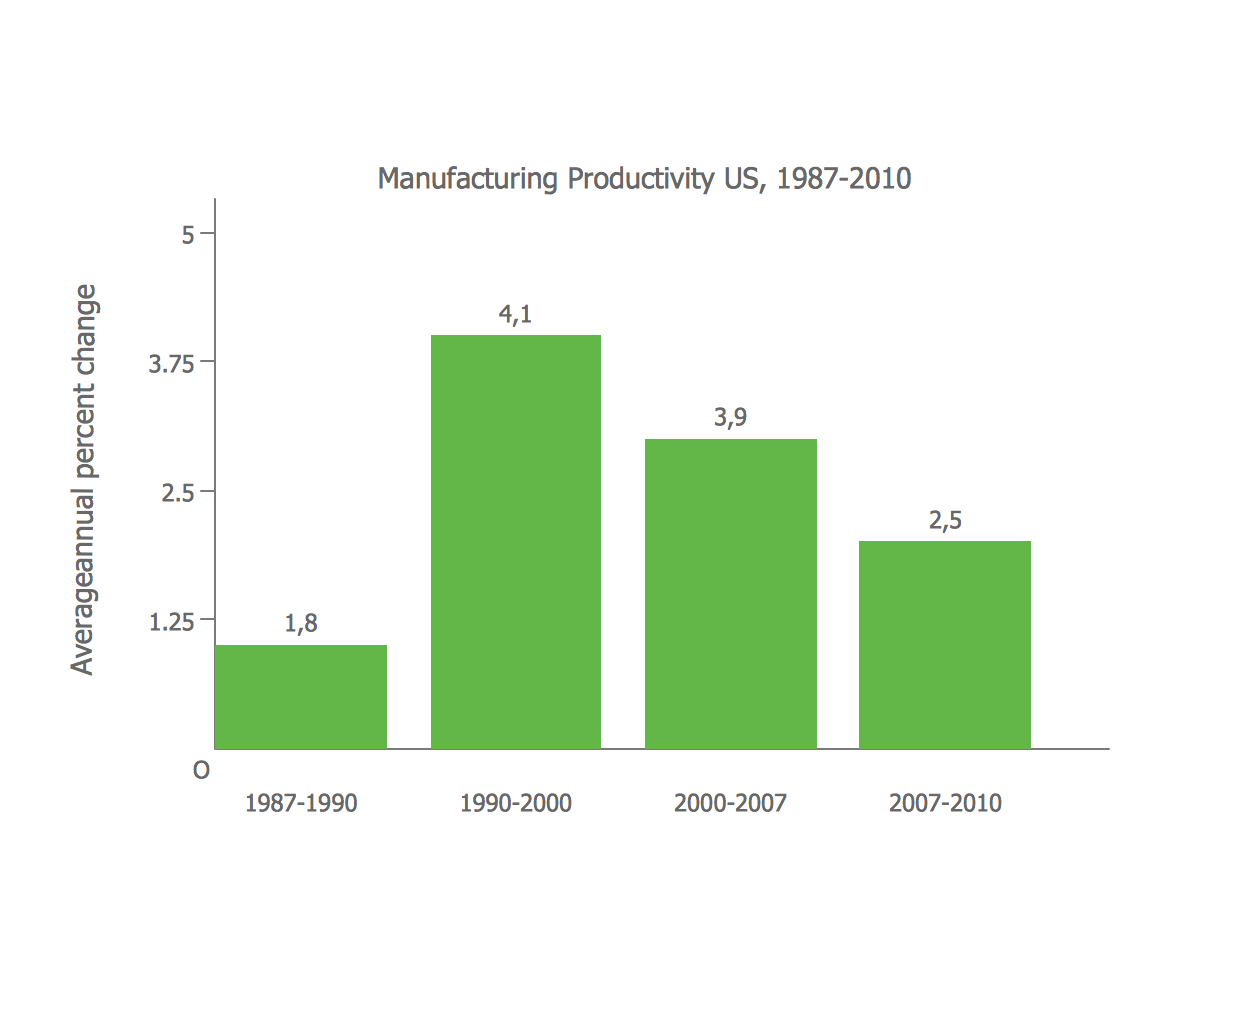
Picture: Bar Diagrams for Problem Solving. Create manufacturing and economics bar charts with Bar Graphs Solution
Related Solution:
When trying to figure out the nature of the problems occurring within a project, there are many ways to develop such understanding. One of the most common ways to document processes for further improvement is to draw a process flowchart, which depicts the activities of the process arranged in sequential order — this is business process management. ConceptDraw DIAGRAM is business process mapping software with impressive range of productivity features for business process management and classic project management. This business process management software is helpful for many purposes from different payment processes, or manufacturing processes to chemical processes. Business process mapping flowcharts helps clarify the actual workflow of different people engaged in the same process. This samples were made with ConceptDraw DIAGRAM — business process mapping software for flowcharting and used as classic visio alternative because its briefly named "visio for mac" and for windows, this sort of software named the business process management tools.
This flowchart diagram shows a process flow of project management. The diagram that is presented here depicts the project life cycle that is basic for the most of project management methods. Breaking a project into phases allows to track it in the proper manner. Through separation on phases, the total workflow of a project is divided into some foreseeable components, thus making it easier to follow the project status. A project life cycle commonly includes: initiation, definition, design, development and implementation phases. Distinguished method to show parallel and interdependent processes, as well as project life cycle relationships. A flowchart diagram is often used as visual guide to project. For instance, it used by marketing project management software for visualizing stages of marketing activities or as project management workflow tools. Created with ConceptDraw DIAGRAM — business process mapping software which is flowcharting visio alternative or shortly its visio for mac, this sort of software platform often named the business process management tools.
Picture: Process Flowchart: A Step-by-Step Comprehensive Guide
Related Solution:
Event-Driven Process Chain Diagrams for improvement throughout an organisation.
ConceptDraw DIAGRAM - software that reduces the time needed to create a business process model.
Picture: Beauty of Event-driven Process Chain (EPC) diagrams
Related Solution:
Do you like the professional schemes that you can find on the Internet? Take into account that the most part of them is made using the Best Flowchart Software and Flowchart Symbols. Try you own powers in creating such diagrams!
Flowcharts are the most business diagramming tool. If you are a business manager, you can use flow chart to depict work flow in your organization, develop the effective organizational structure and present the information to investors or other stakeholders. Combining the smart management solutions with ConceptDraw DIAGRAM diagramming engine delivers the set of comprehensive flowchart tools necessary to support professionals in their creativeness and business activity.
Picture: Best Flowchart Software and Flowchart Symbols
Related Solution:
Flowcharts visualize a process or algorithm of program as step/operation blocks of various shapes connected with arrowed lines showed the process flow direction. They are used to visualize business or technical processes and software algorithms.
Conceptdraw DIAGRAM - feature-rich flowchart software. It will allow you to create professional looking flowcharts.
Picture: Best Flowcharts
Related Solution:
You need design the Marketing Organization Chart and look for effective software? Now it's incredibly easy to do this in ConceptDraw DIAGRAM which was supplied with Marketing Diagrams Solution from the Marketing Area of ConceptDraw Solution Park.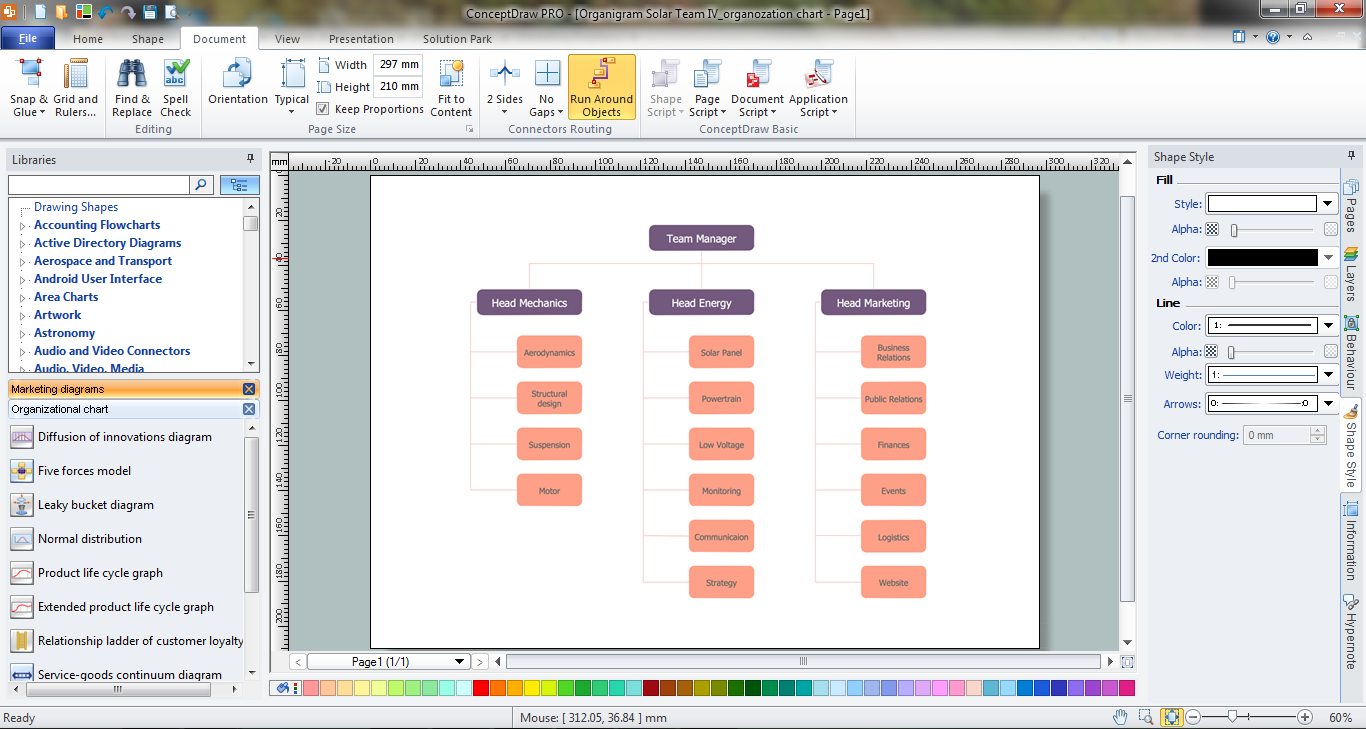
Picture: Marketing Organization Chart
Related Solution: