Best Multi-Platform Diagram Software
Drawing Soft
ConceptDraw DIAGRAM is the Multi-Platform Diagram Software for drawing of the flowcharts, block diagrams, bar charts, histograms, pie charts, divided bar diagrams, line graphs, area charts, scatter plots, circular arrows diagrams, Venn diagrams, bubble diagrams, concept maps, and others. Basic Diagramming solution is a powerful tool for drawing business communication ideas and concepts, simple visual presentation of numerical data in the Mac environment.
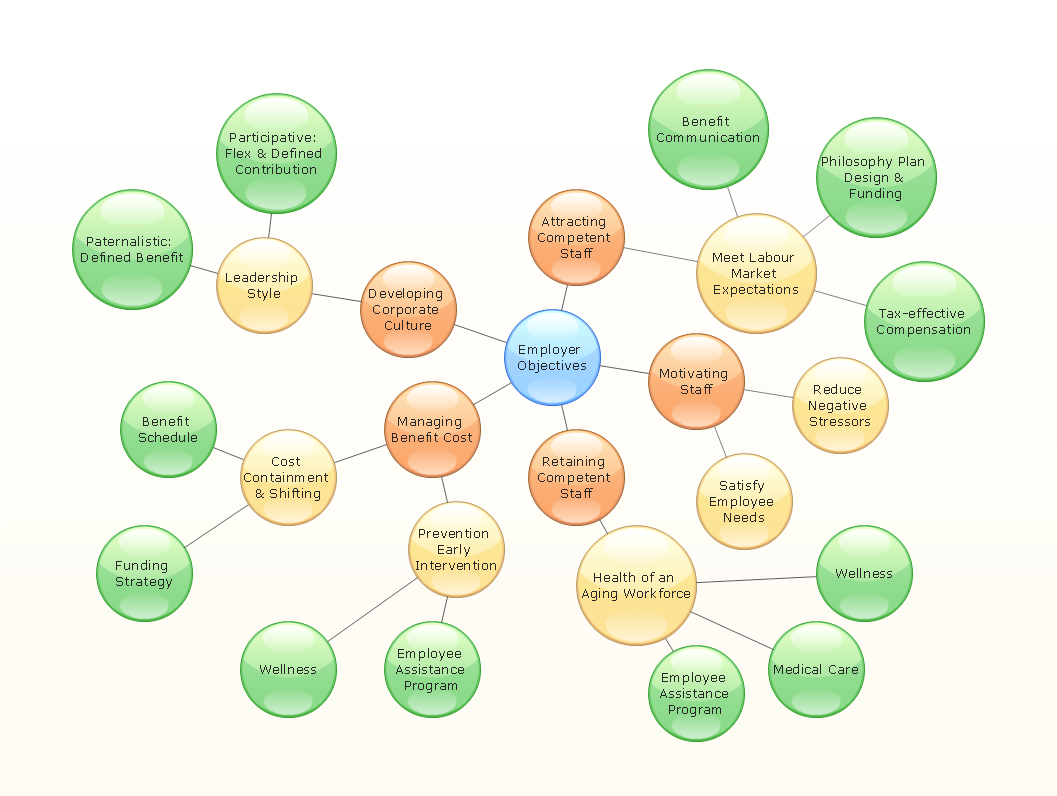
Sample 1. Employer objectives - Bubble diagram.
ConceptDraw DIAGRAM ector diagramming and business graphics software enhanced with with templates, samples and stencil libraries from ConceptDraw Solution Park helps you to easily draw flowcharts, block diagrams, bar charts, histograms, pie charts, divided bar diagrams, line graphs, area charts, scatter plots, circular arrows diagrams, Venn diagrams, bubble diagrams, concept maps, and others.
Use ConceptDraw DIAGRAM with Solution Park to draw you own diagrams, charts and graphs for graphic communication, explanation of business and personal ideas and concepts, simple visual presentation of numerical data, complex structures, logical relations, step-by-step flows of actions, operations or math algorithm.
EIGHT RELATED HOW TO's:
Bubble diagrams solution extends ConceptDraw DIAGRAM software with templates, Using ConceptDraw Connectors, you can create a bubble chart in moments.
Using ConceptDraw you will be able to create a bubble chart from the ready ConceptDraw library objects or make your own objects. The created diagram can represent ideas organization, in brainstorming processes, by teachers for explaining difficult ideas or for presentations.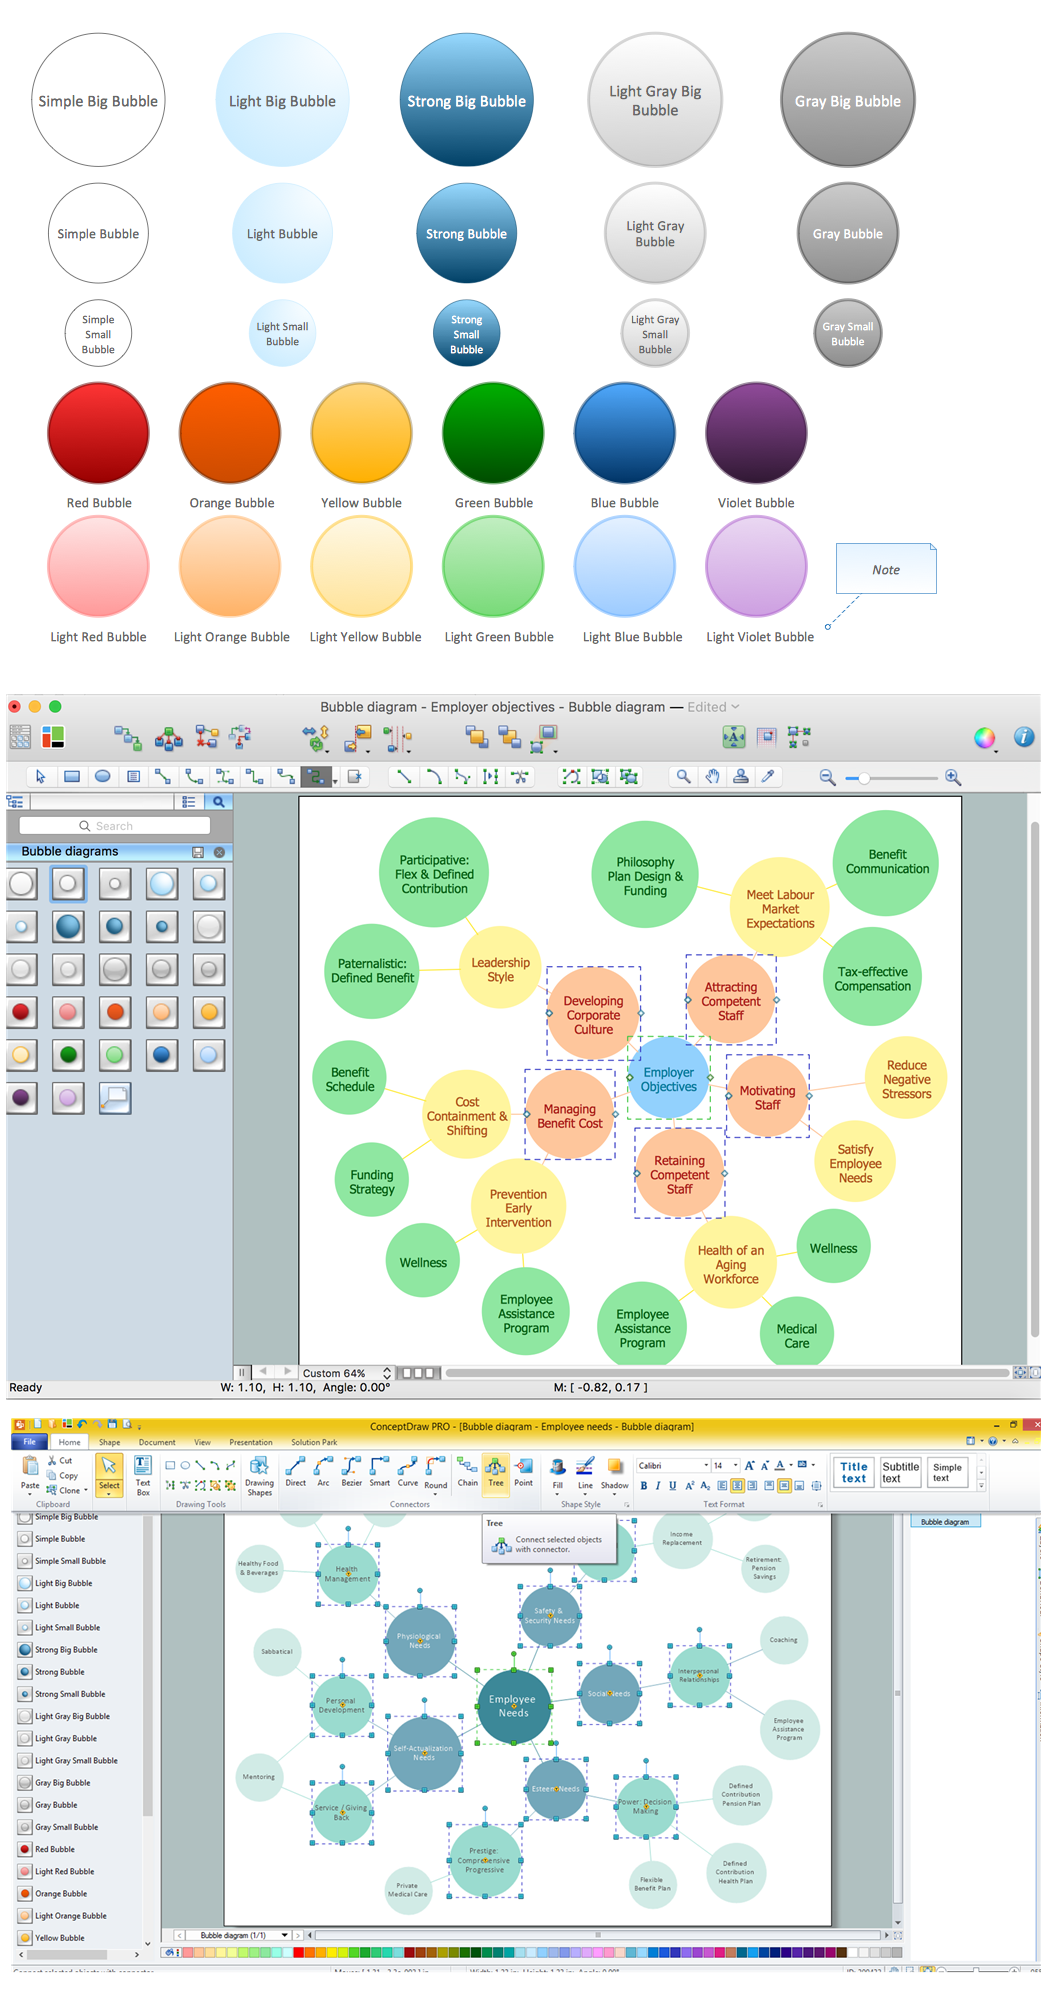
Picture: How To Create a Bubble Chart
Related Solution:
UML diagrams of business processes. The Rapid UML solution provides diagram examples, templates and vector stencils libraries for quick and easy drawing all types of UML 2.x and 1.x diagrams: UML activity diagrams, UML communication (collaboration) diagrams, UML component diagrams, UML composite structure diagrams, UML deployment diagrams, UML interaction overview diagrams, UML object diagrams, UML package diagrams, UML sequence diagrams, UML state machine diagrams, UML timing diagrams, UML use case diagrams.
Picture: UML Business Process
Related Solution:
Create your own flow charts of computer or network system account processing using the ConceptDraw DIAGRAM.
Picture:
Account Flowchart
Flowchart Examples
Related Solution:
A Venn diagram, sometimes referred to as a set diagram, is a diagramming style used to show all the possible logical relations between a finite amount of sets. Having ConceptDraw DIAGRAM software one allows anyone who cares for their drawings to look not only nice but also smart and professional.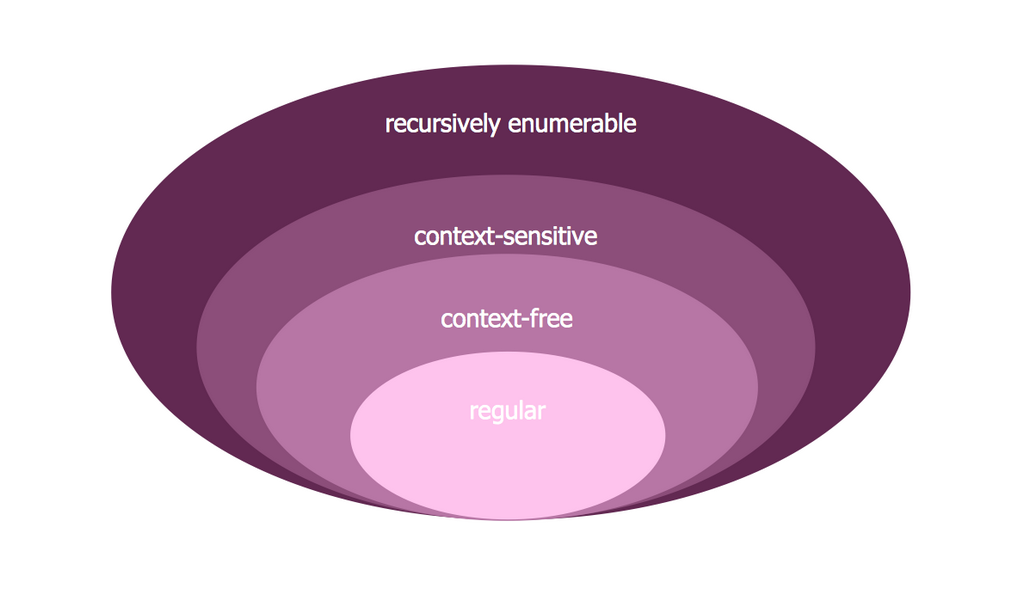
Picture:
Venn Diagram Examples for Problem Solving
Computer Science. Chomsky Hierarchy
Related Solution:
ConceptDraw DIAGRAM is a powerful software for drawing professional looking Stacked Graph thanks to the Divided Bar Diagrams solution from the Graphs and Charts area of ConceptDraw Solution Park.
Picture: Stacked Graph
Related Solution:
Every engineering project starts from a terms of reference document. The next stage of developing is a technical drawing, which requires using appropriate software. However, revisions and discussions about requirements are possible at any stage of development.
This technical drawing demonstrates a schematic flow diagram of pulp reclaiming. This diagram of magnetite pulp reclaiming is created using ConceptDraw Chemical and Process engineering solution, The solution delivers more than 460 vector graphic icons and connectors. Generally, it is intended for designing process and instrumentation diagrams (P&ID) for chemical and process engineering. block flow diagrams (BFD), process flow diagrams (PFD) for chemical industry.
Picture: Technical Drawing Software
Related Solution: