Biology Symbols
ConceptDraw DIAGRAM diagramming and vector drawing software extended with Biology solution from the Science and Education area offers a set of useful tools for fast and easy drawing of various biology illustrations and drawings.
Biology solution provides 3 libraries with large quantity of vector biology symbols:
- Biochemistry of Metabolism Library
- Carbohydrate Metabolism Library
- Citric Acid Cycle (TCA Cycle) Library
Use of these objects will help you design any biology, microbiology, molecular or cell biology, biochemistry, genetics, biotechnology diagram, scheme, or illustration that you will want to draw. Simply drag the desired vector biology symbols and shapes from the libraries, arrange them, make some style changes, and your professional looking biology illustration will be ready.
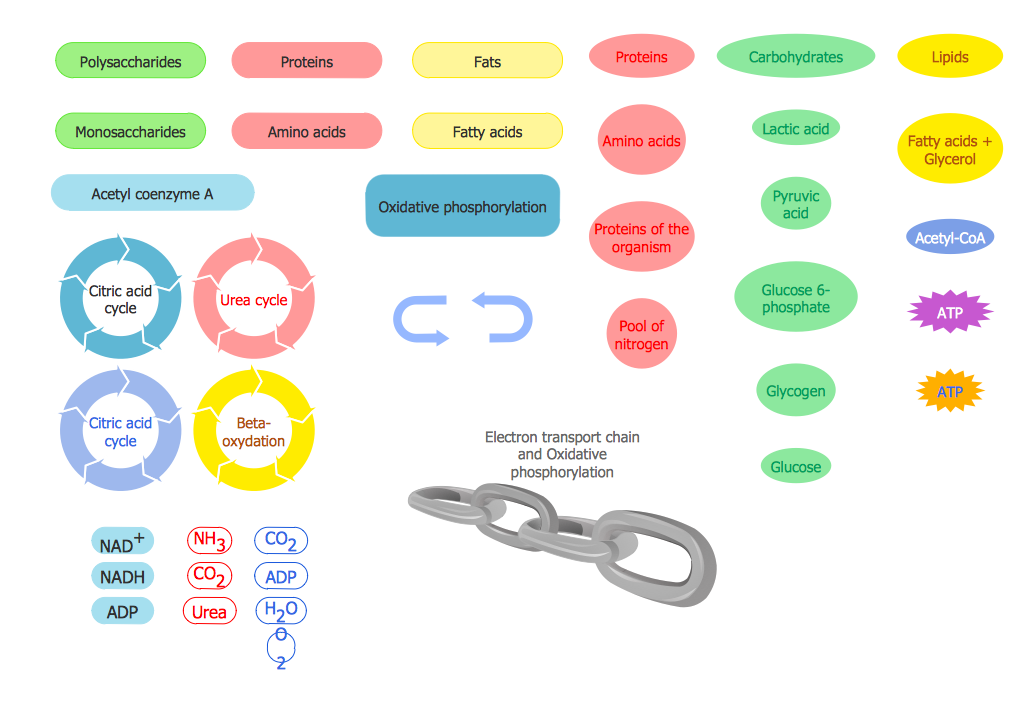
Sample 1. Biology symbols – Biochemistry of Metabolism Library Design Elements
Biochemistry of Metabolism library from the Biology solution contains 46 vector shapes.

Sample 2. Biology symbols – Carbohydrate Metabolism Library Design Elements
Carbohydrate Metabolism Library from the Biology solution contains 25 vector objects.
 Library")
Sample 3. Biology symbols – Citric Acid Cycle (TCA Cycle) Library Design Elements
Citric Acid Cycle (TCA Cycle) Library from the Biology solution contains 26 vector biology symbols.

Sample 4. Biology solution – TCA Cycle
This sample was created in ConceptDraw DIAGRAM using the biology symbols from the libraries of Biology Solution. It shows the TCA Cycle (tricarboxylic acid cycle, or citric acid cycle) – series of chemical reactions for aerobic organisms. An experienced user spent 15 minutes creating this sample.
The biology illustrations and drawings designed with ConceptDraw DIAGRAM are vector graphic documents and are available for reviewing, modifying, converting to a variety of formats (image, HTML, PDF file, MS PowerPoint Presentation, Adobe Flash or MS Visio), printing and send via e-mail in one moment.
TEN RELATED HOW TO's:
The ER diagram is constructed from the specific ERD graphic elements. There are used 2 types of ERD notations: Chen and Crow's Foot.
A complete set of work flow shapes, notation & symbols for ERD, entity relationship stencils, included in Entity-Relationship Diagram (ERD) solution for ConceptDraw DIAGRAM software, makes drawing diagrams based on ERD notation as smooth as possible.
Picture: Notation & Symbols for ERD
Related Solution:
It doesn’t matter what kind of business you have, a bar or a gym, there are common concepts for any of them. One of those concepts is accounting, and to facilitate the work with the figures, you can use accounting flowchart symbols and create a clear and representative scheme. You can create flowchart for auditing, tax accounting and even for planning your own budget.
A graphical tool for displaying successive processes is flowchart. This method is mostly suited to represent an accounting process. The sequence of steps in the accounting process usually consists of standard accounting procedures, that can be depicted by using a minimal number of symbols, applied for the basic flowcharting. The advanced opportunity to create professional Accounting Flow charts is provided by ConceptDraw Accounting Flowcharts solution. It includes contains a library of accounting flowchart symbols used when drawing the accounting process flow.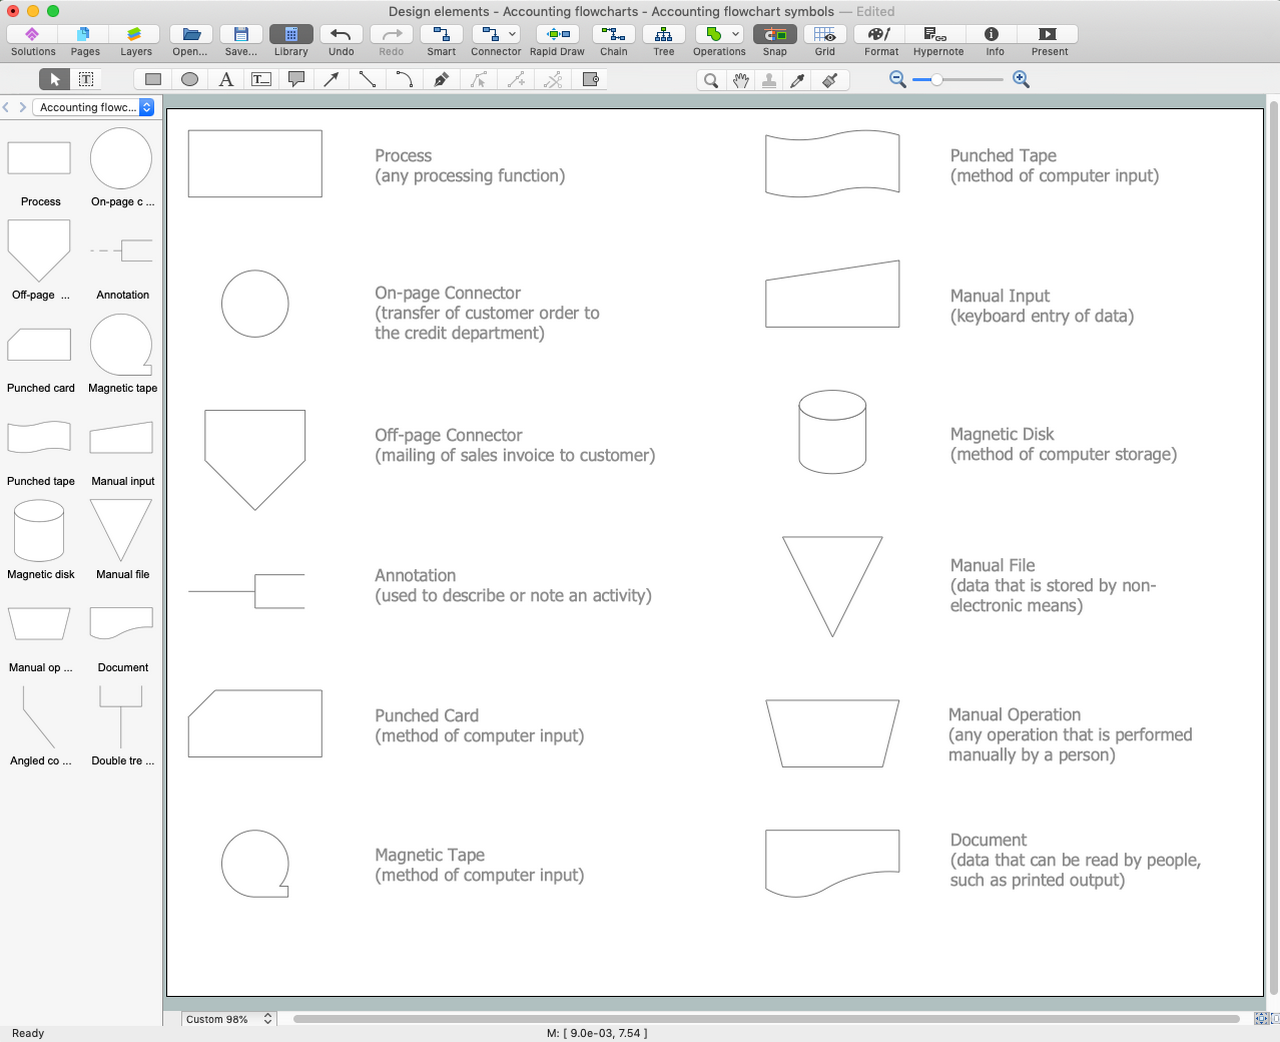
Picture: Accounting Flowchart Symbols
Related Solution:
When you need to draw a professional management drawing, these management design elements, samples, templates and libraries with vector clip art for drawing the Marketing Illustrations. Conceptdraw symbols and signs you can use in your design for Strategic Management, Graphic Design, Planning implementation and more.
You can create and view impact analysis drawings from specific design elements to examine the tasks.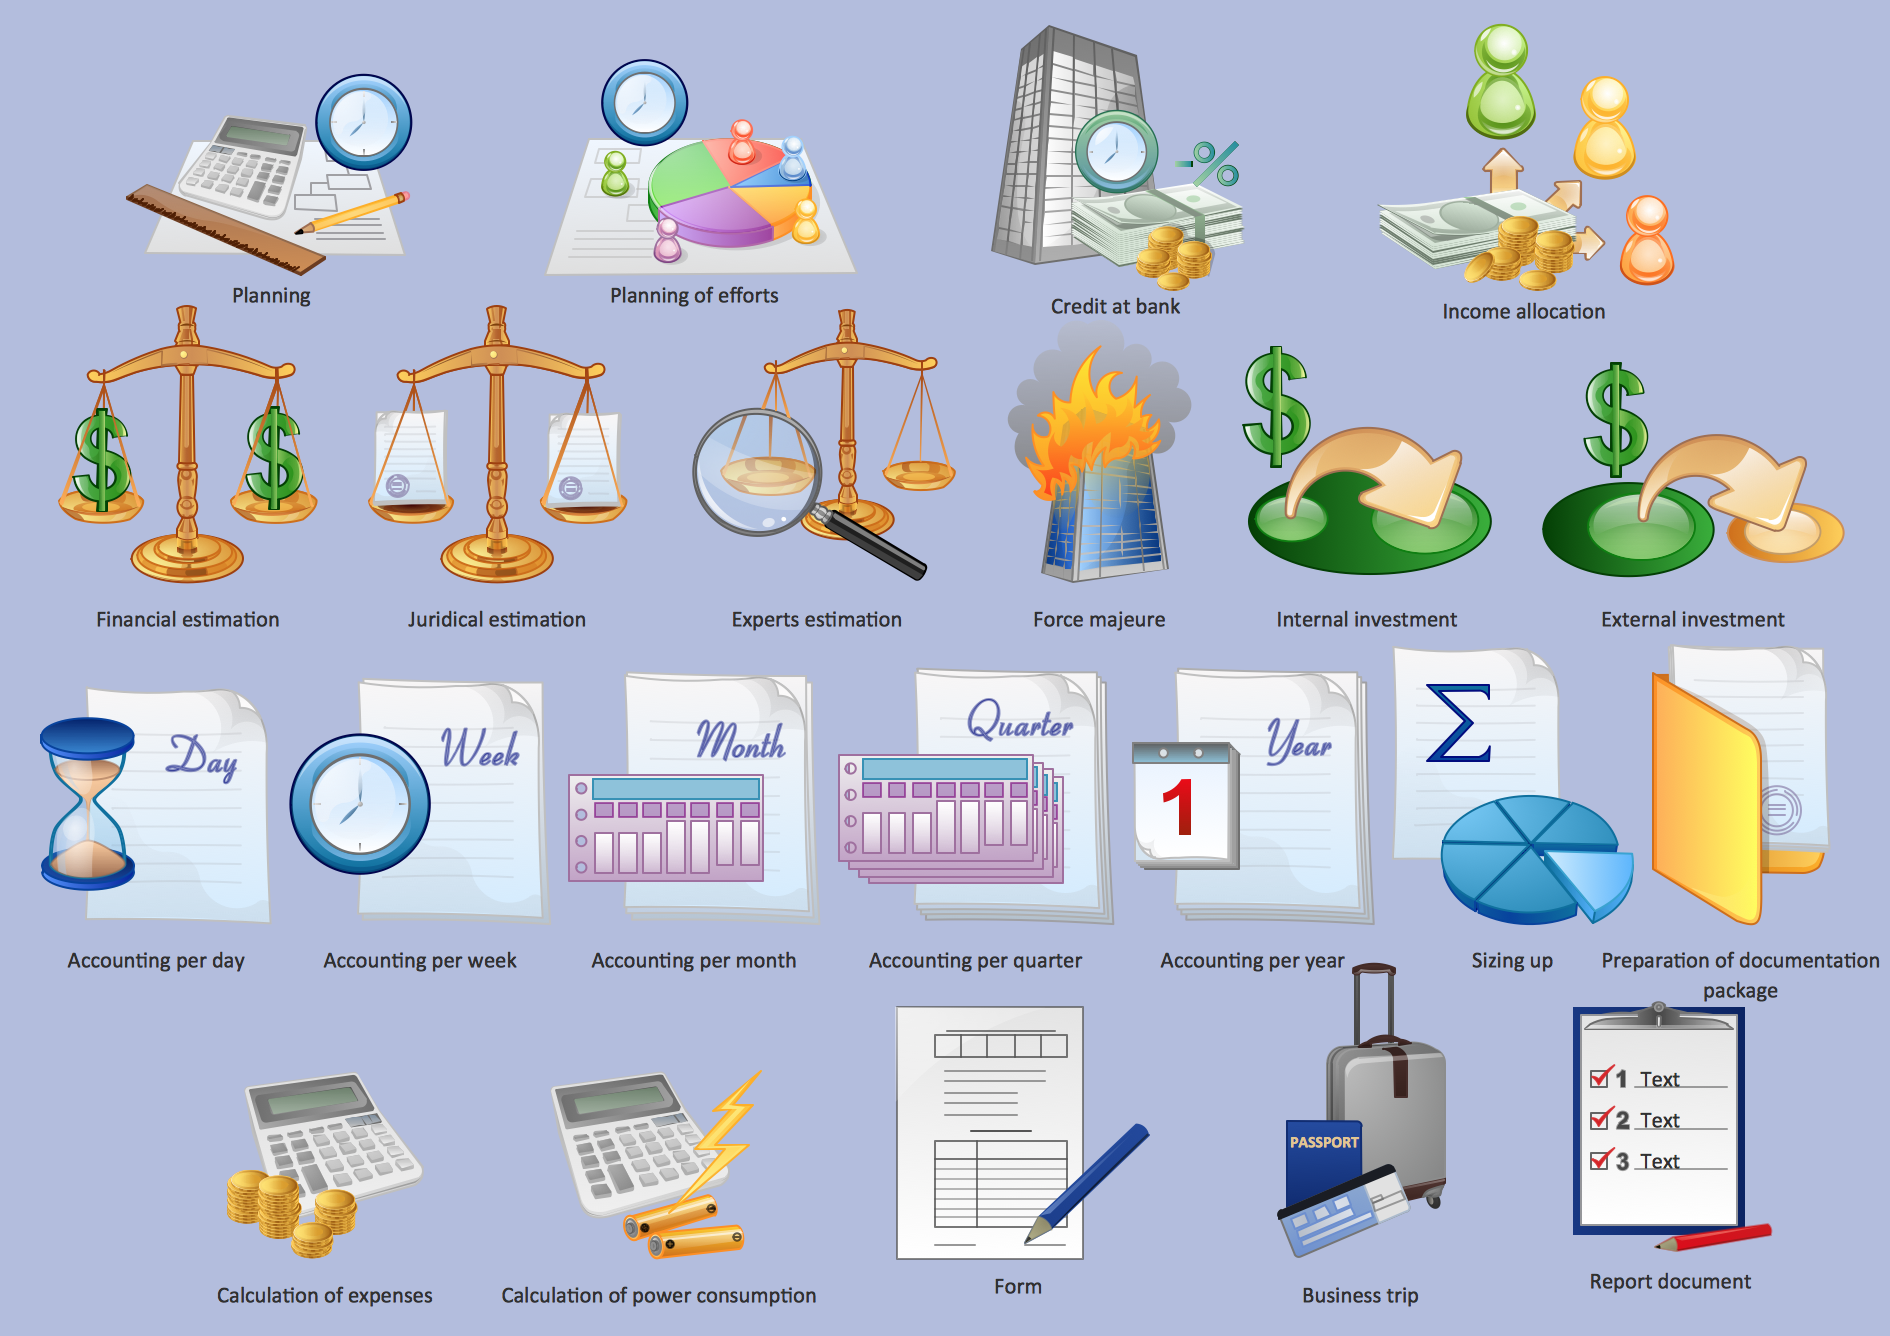
Picture: Management - Design Elements
Related Solution:
Create a Pie Chart with ConceptDraw software quickly and easily. The simple tutorial helps you learn how to create a pie chart.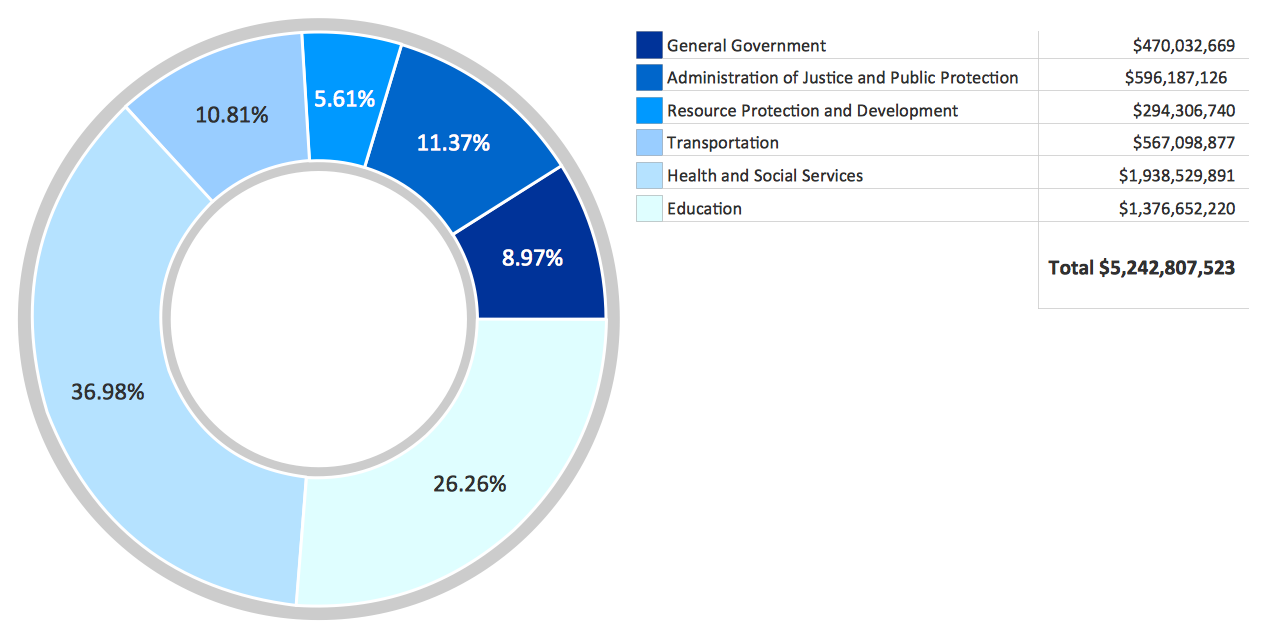
Picture: How to Create a Pie Chart
Related Solution:
S-Video is a signaling standard for standard definition video. ConceptDraw DIAGRAM diagramming and vector drawing software extended with Audio and Video Connectors Solution from the Industrial Engineering Area can be helpful for demostrating and explaining the S Video connection which is widely used on TVs and home theater receivers.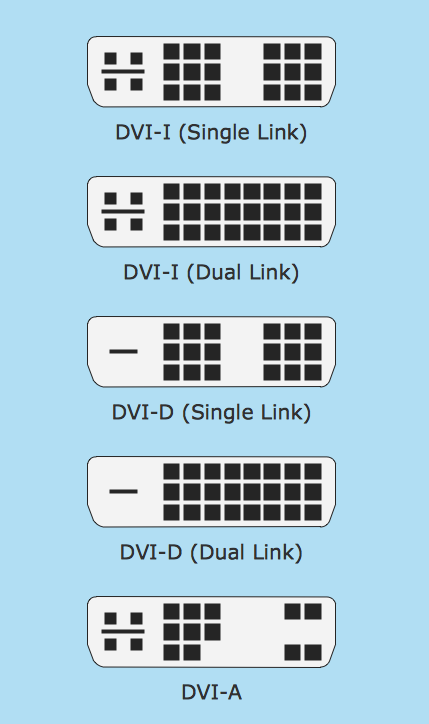
Picture: S Video Connection
Related Solution:
Unfortunately, a man can’t predict the future and no one is safe from natural disasters, such as floods, earthquakes, hurricanes or fires. Nonetheless, what you can do to ensure safety for you and your relatives is to create an emergency plan, so everyone will know what to do if emergency happens. Keep that plan simple and train it several times a year so that no one could forget any details of it.
Fire and emergency plans are important to supply people with a visual safety solution. This diagram presents a set of standard symbols used to depict fire safety, emergency, and associated information. Using clear and standard symbols on fire emergency plans provides the coherence of collective actions , helps to avoid embarrassment, and improves communications in an emergent situation. The fire emergency symbols are intended for the general emergency and fire service, as well as for building plans ,engineering drawings and insurance diagrams. They can be used during fire extinguishing and evacuation operations, as well as trainings. It includes vector symbols for emergency management mapping, emergency evacuation diagrams and plans.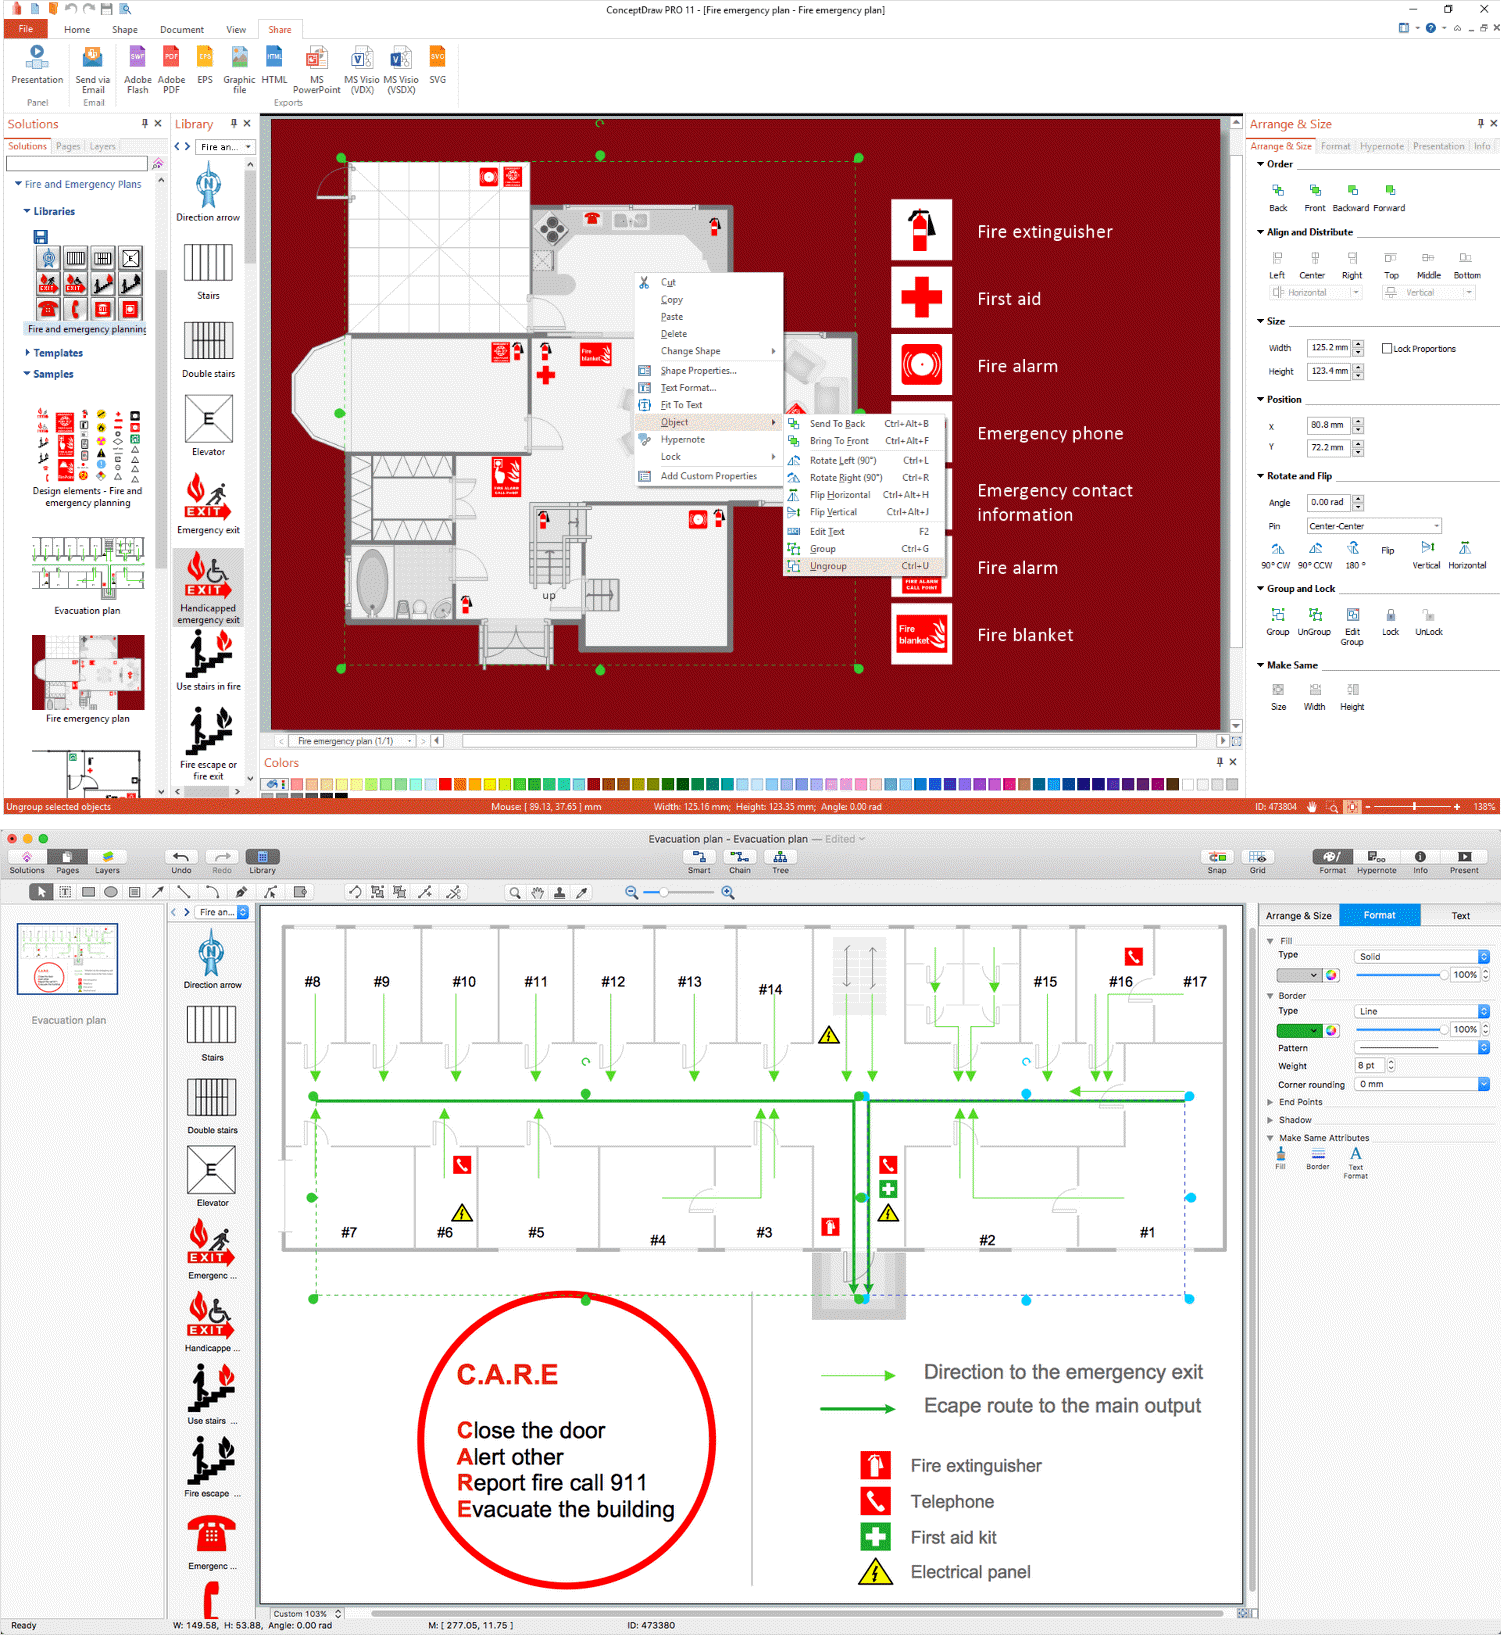
Picture: Emergency Plan
Related Solution:
The Affinity Diagram shows the structure of large, complex factors that have an influence on a problem, and then divides them up into a smaller and simpler structure. The Affinity Diagram does not show a causal relationship between the factors. This diagram is designed to prepare the data for further analysis of the cause-effect relationships.
Picture: Affinity Diagram
Related Solution:
ConceptDraw DIAGRAM is a powerful diagramming, vector drawing and sketching software that can be successfully used for creating various sketches, illustrations, drawing in any field of science and life activity. In particular, ConceptDraw DIAGRAM offers the Astronomy solution from the Science and Education area to help you design the astronomy pictures, sun solar system drawings, constellation chart quick and easy.
Picture: Sketching Software
Related Solution:
The affinity diagram is a business tool used to organize ideas and data. It is one of the Seven Management and Planning Tools. But how design the Affinity Diagram quick and easy? ConceptDraw DIAGRAM diagramming and vector drawing software offers the Seven Management and Planning Tools Solution from the Management Area.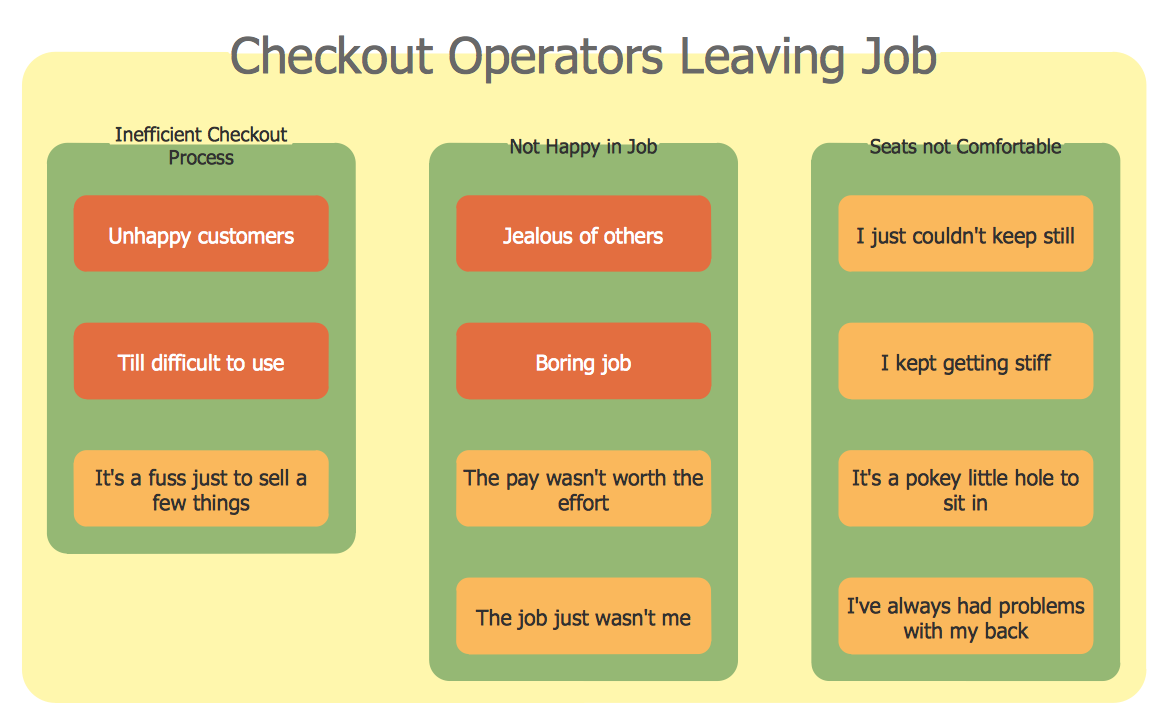
Picture: Affinity Diagram
Related Solution:
No building project can exist without an electrical circuit map. It’s more convenient to develop electrical drawing with a proper software which would contain vector shapes and electrical symbols. This will help in the future if any problems appear.
This circuit diagram shows the scheme of a location of components and connections of the electrical circuit using a set of standard symbols. It can be use for graphical documentation of an electrical circuit components. There are many of different electric circuit symbols that can be used in a circuit diagram. Knowing how to read circuit diagrams is a useful skill not only for professionals, but for any person who can start creating his own small home electronic projects.
Picture: Electrical Drawing Software and Electrical Symbols
Related Solution:

 Library")
