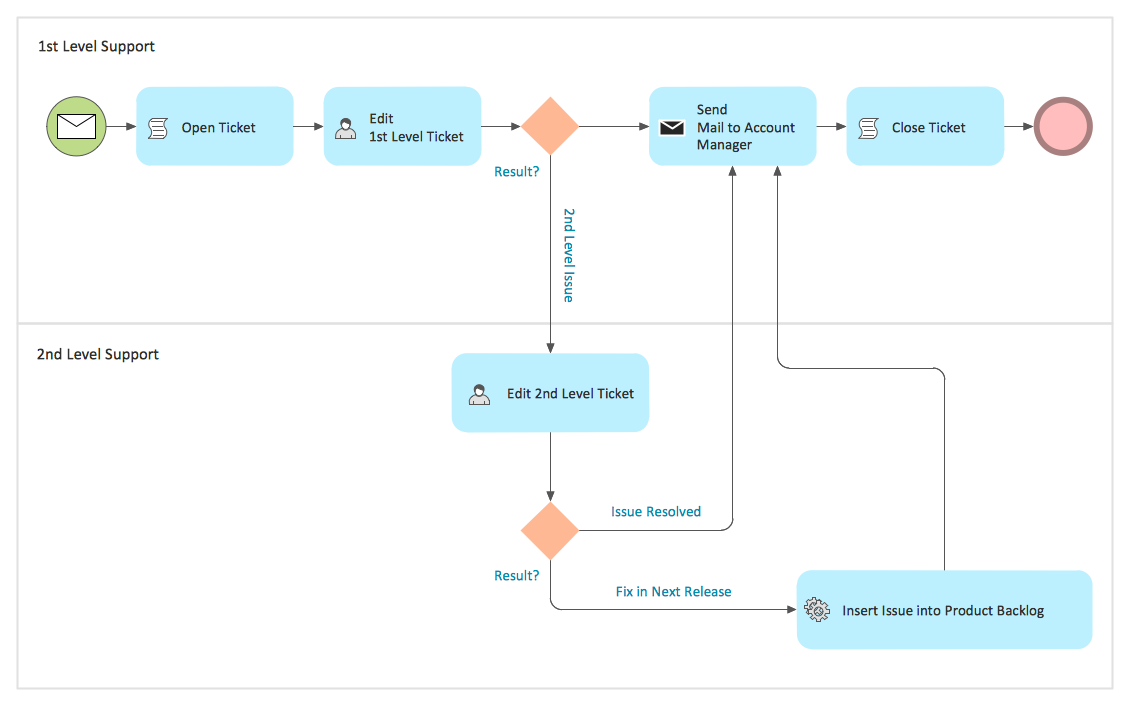
Example 1. Business Models - Trouble Ticket System
Business Process Diagram Solution offers 16 libraries of ready-to-use predesigned vector shapes to make your business models creation fast and easy:
- Activities
- Activities BPMN 1.2
- Artifacts BPMN 1.2
- Business Process - Rapid Draw
- Choreographies
- Connections BPMN 1.2
- Conversations
- Data
- Events
- Events BPMN 1.2
- Expanded Objects
- Expanded Objects BPMN 1.2
- Gateways
- Gateways BPMN 1.2
- Swimlanes
- Swimlanes BPMN 1.2

Example 2. Business Models - Booking
Another way of representing the business models in ConceptDraw DIAGRAM is to use as the base the predesigned template or sample from ConceptDraw STORE. You can choose any desired sample or template from the offered which meets your requirements and change it for your needs, or simply use it as the source of inspiration.

Example 3. Business Models - Logistics
The samples you see on this page were created in ConceptDraw DIAGRAM using the tools of Business Process Diagram Solution from the Business Processes Area. They successfully demonstrate solution's capabilities and professional results you can achieve using it. An experienced user spent 10 minutes creating each of these samples.
Use the Business Process Diagram Solution for ConceptDraw DIAGRAM software to develop professional business models quick, easy and effective, and then successfully use them in your work activity.
All source documents are vector graphic documents. They are available for reviewing, modifying, or converting to a variety of formats (PDF file, MS PowerPoint, MS Visio, and many other graphic formats) from the ConceptDraw STORE. The Business Process Diagram Solution is available for all ConceptDraw DIAGRAM or later users.
NINE RELATED HOW TO's:
Designing a Data Flow Diagram is incredibly simple in the ConceptDraw DIAGRAM. You can start with a blank sheet or choose one of the offered DFD templates included in the Data Flow Diagrams solution. Once started with a predesigned Data Flow Chart template, use also the ready-made vector objects from the Data Flow Diagrams solution libraries.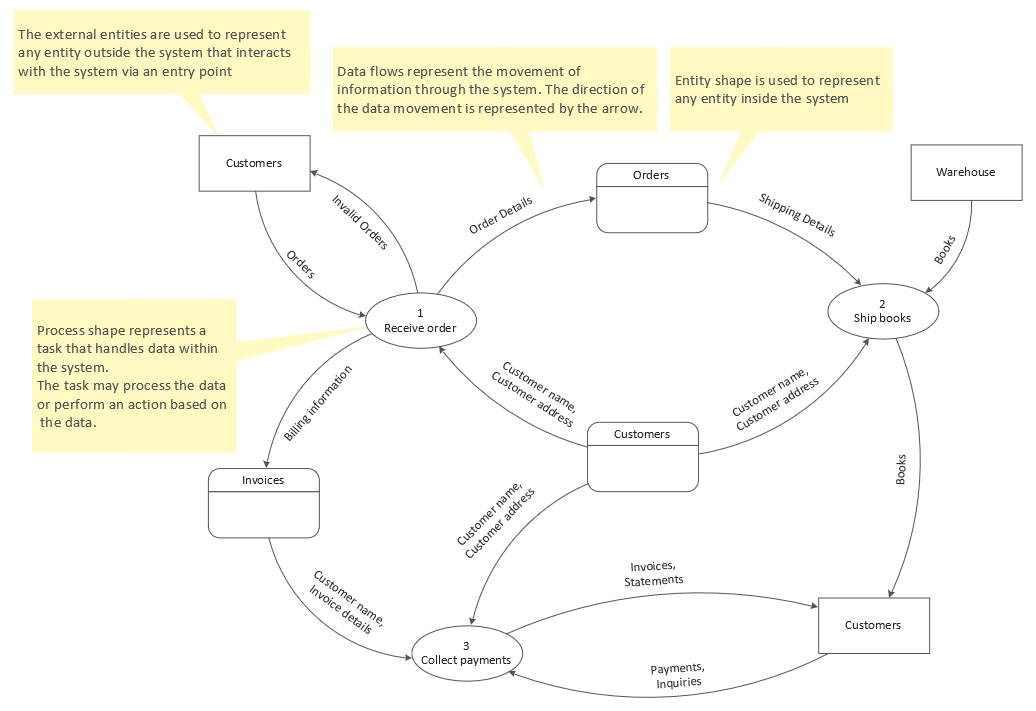
Picture: Data Flow Chart Template
Related Solution:
In order to be successful, you have to promote your business on the market. One of the ways for planning this promotion is to create a social media DFD Flowchart which will contain all the details of your business strategy. Social media is a very influential tool, and it's a mistake to ignore it.
The following flowchart represents a best way to estimate social media posts, and gives a strategy of responses. This flowchart is designed in the format of cross-functional flowchart. With this format, we can divide the process into three distinct phases. This approach helps to generate well-considered and balanced response on social networks activities. Using ConceptDraw solution for Social Media Response, your reaction to social media posts will positively mirror the values and mission of your business.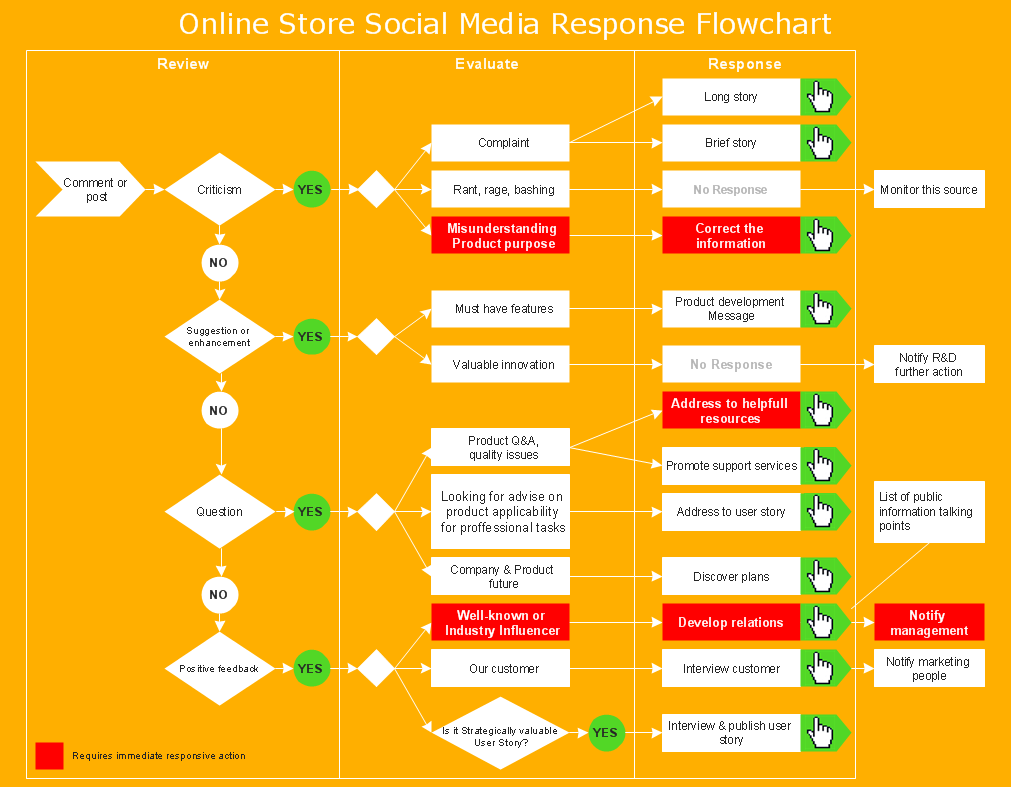
Picture: How to Create a Social Media DFD Flowchart
Related Solution:
You need to draw professional looking BPMN diagrams quick and easy? Pay please your attention on ConceptDraw DIAGRAM diagramming and vector drawing software. Extended with Business Process Diagram Solution from the Business Processes Area it will be ideal for your.
Picture: BPMN
Related Solution:
Visio Files and ConceptDraw. ConceptDraw DIAGRAM is compatible with MS Visio.VDX formatted files.VDX is Visio’s open XML file format, and it can be easily imported and exported by ConceptDraw DIAGRAM.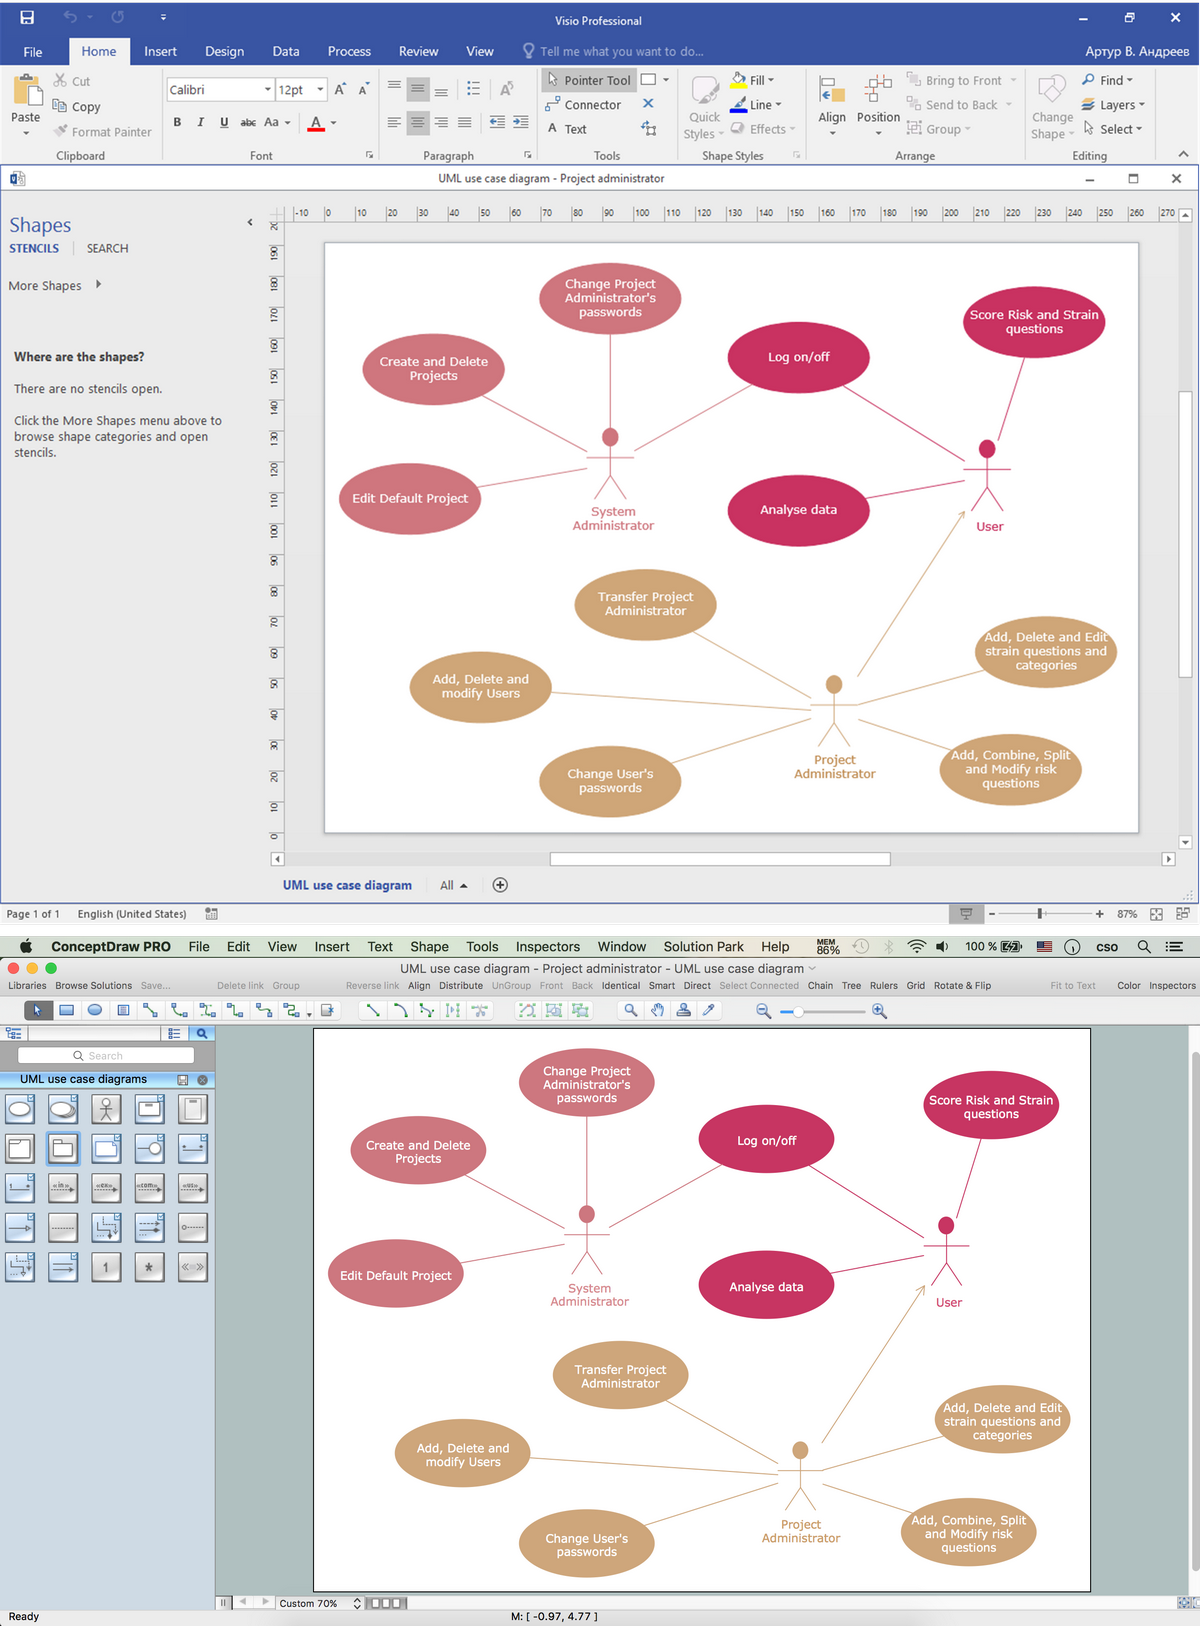
Picture: Visio Files and ConceptDraw
ConceptDraw is a best data visualization tool that will allow everyone to create rich infographics and visualizations quickly and easily.
Picture: Best Tool for Infographic Construction
The Social Media Response solution creates interactive social media flow charts and action mind maps. The solution includes a video tutorial and a number of samples helping social media teams refine and organize their response process.
Picture: How to Connect Social Media DFD Flowchart with Action Maps
Related Solution:
A flowchart is a powerful tool for examining processes. It helps improving processes a lot, as it becomes much easier to communicate between involved people, to identify potential problems and to optimize workflow. There are flowcharts of different shapes, sizes and types of flowchart vary from quite basic process flowcharts to complex program flowcharts. Nevertheless, all these diagrams use the same set of special symbols like arrows to connect blocks, parallelogram to show data receiving or rectangles for showing process steps.
Basic flowcharts are used to represent a simple process algorithm. A basic flowchart notation consists of rectangles (business processes), arrows (the flow of information, documents, etc.). The same notation is used in items such as the "decision", which allow you to do the branching. To indicate the start of the entire business process and its termination can be used the "Terminator" element. The advantages of Basic Flowchart are simplicity and clarity. With it you can quickly describe the business process steps. Creating of Basic Flowchart does not require any special knowledge, as easily understand by employees with different levels of education and IQ.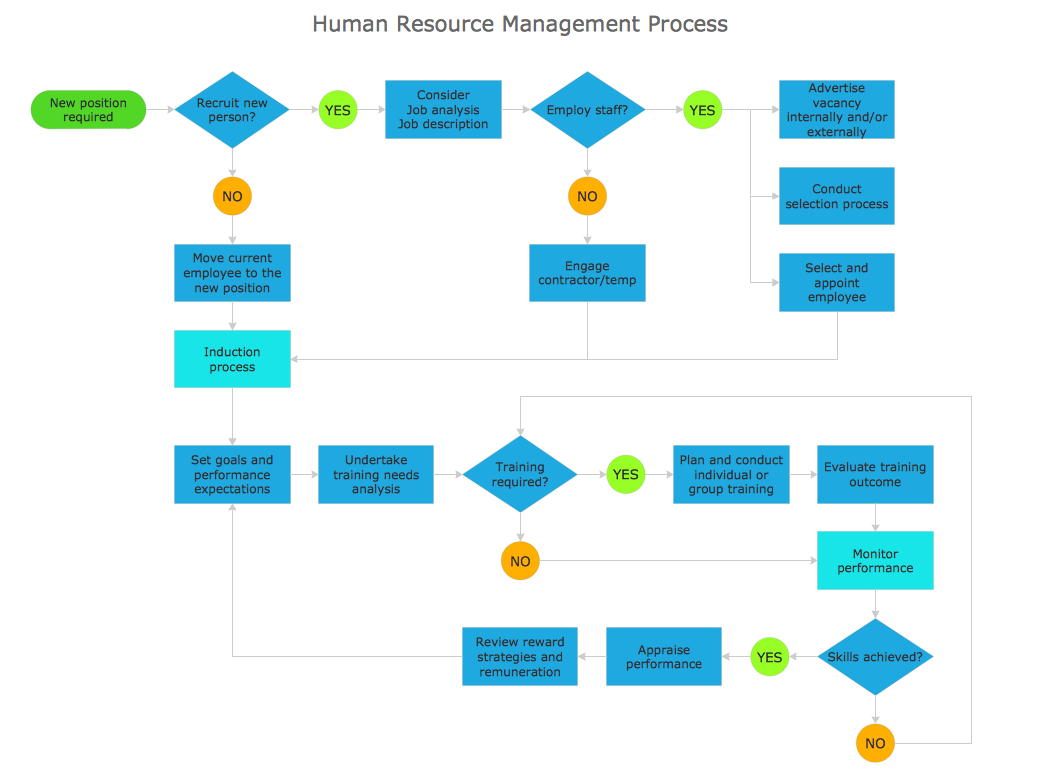
Picture: Types of Flowchart: Comprehensive Overview
Related Solution:
You want design the Cross Functional Diagram and need powerful software? Then ConceptDraw DIAGRAM diagramming and vector drawing software extended with Cross-Functional Flowcharts Solution is exactly what you need.
Picture: Cross Functional Diagram
Related Solution:
While creating flowcharts and process flow diagrams, you should use special objects to define different statements, so anyone aware of flowcharts can get your scheme right. There is a short and an extended list of basic flowchart symbols and their meaning. Basic flowchart symbols include terminator objects, rectangles for describing steps of a process, diamonds representing appearing conditions and questions and parallelograms to show incoming data.
This diagram gives a general review of the standard symbols that are used when creating flowcharts and process flow diagrams. The practice of using a set of standard flowchart symbols was admitted in order to make flowcharts and other process flow diagrams created by any person properly understandable by other people. The flowchart symbols depict different kinds of actions and phases in a process. The sequence of the actions, and the relationships between them are shown by special lines and arrows. There are a large number of flowchart symbols. Which of them can be used in the particular diagram depends on its type. For instance, some symbols used in data flow diagrams usually are not used in the process flowcharts. Business process system use exactly these flowchart symbols.
Picture: Flowchart Symbols: Meaning and Examples
Related Solution:

