Made with
ConceptDraw
DIAGRAM 18

Business Processes

In the given article we will consider “business process” and “business processes reengineering” concepts and how the work with business processes is realized in ConceptDraw.

The activity of a company of any size consists of the big amount of business processes which repeat from day to day. This could be a transportation of the load or the new software development, sorting of the correspondence or the creation of the air liner. So any action happened inside the company, which has definite conditions at the input, the result at the output, resources and control mechanism is the business process. At bottom of fact, business process is any action, directed to the final receipt of the direct or indirect profit.

Let’s make some formal definitions.

Business process is:

  • A consequence of actions directed to the transformation of data material flows having the aim to increase their value for a client or the process of creation of the added product cost or services, which satisfy client needs.
  • A quantity of inner correlated steps (functions) which start from one or more inputs and finish with the creation of output (product or service), necessary to a client.
  • A process of transformation of inputs into sets of outputs;
  • A totality of consequent actions for solving of any enterprise task.
  • Business process is an operation, included into the system of operations, the aim of which is production and delivery of services/goods to operations which enter into the system and to other systems as well.

Any process can be optimized and the experience of a great number of companies shows that sometimes it is possible to spend several hours on the process which earlier took several weeks. At this the diminution of the time spent on the produce of goods or service does not influence on the quality of the final result! In our century of the strict competition and market overloaded with services and goods the possibility to accelerate and reduce the price of the final product or a service is of great importance. One of the main reasons of economical progress of Japanese corporations is exactly the thoroughly considered and executed strategy of business processes optimization.

The process of business processes optimizations is called reengineering. At that the matter concerns not small change but radical redesign of the existing business processes.

But to redesign existing business processes it is necessary to clearly conceive the current state of business processes «as is». For description of business processes several methods are developed.

The simplest variant of business processes description is the usage of ordinary block-schemes. This way could be realized with the help of ConceptDraw as there are special libraries of objects and templates for creation of block-schemes. However, this method does not give a visual and convenient result for business processes optimization. Therefore for description of business processes we recommend you to use more complex but more efficient methods.

Methodology of the structural analysis and projection (SA/SD). At the heart of it there lies a methodology of the structural projection of software and information systems. SADT methodology is the continuation of SA/SD method.

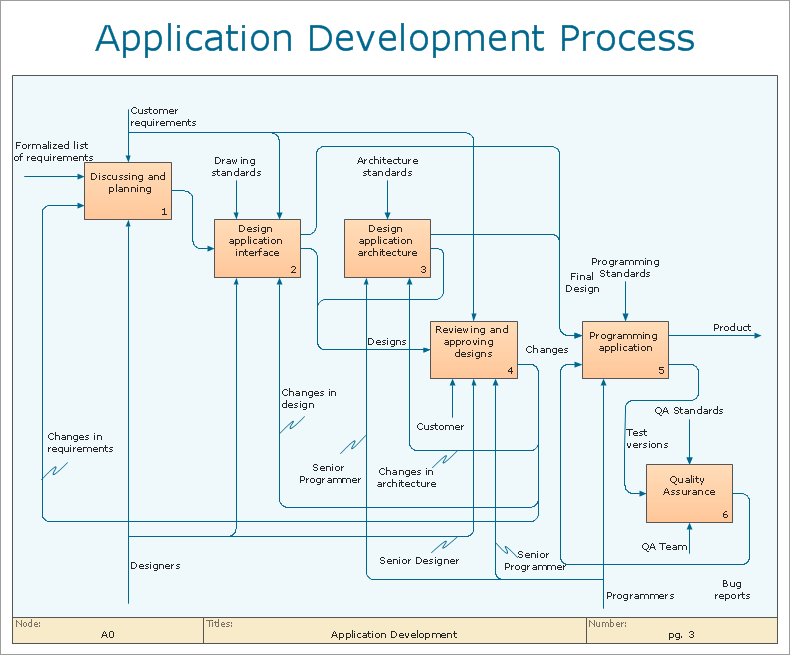
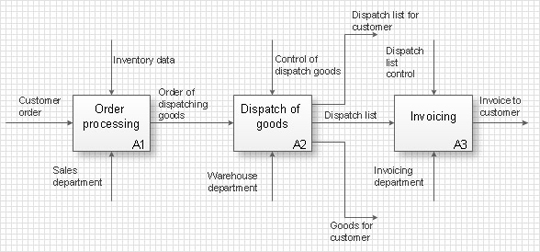
The most worked out and commonly used methodology of business processes description is IDEF methodology. Besides business processes it allows to describe functional blocks, for example production and marketing. ConceptDraw lets creation of business processes description using IDEF0 and IDEF2 methods.

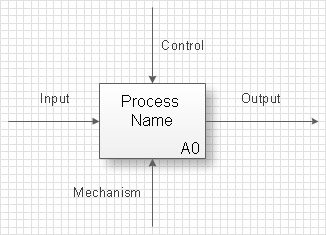
Accordingly to IDEF method, business process is described by following way- this is a rectangle (Activity Box) which defines directly the performed action and four arrows which denote the “input”, “output”, “mechanism” (or resources which are used in the process) and “management” (or the control of the process)

To create the business process description in ConceptDraw it is enough to open Business Processes section from Template Gallery and select a method. Besides IDEF methodology ConceptDraw allows usage of diagrams of business processes modeling (BPML - Business Process Modeling Diagram), diagrams of quality control (TQM Diagram - Total Quality Management Diagram) and symbols of values flows.

After this a scheme or a diagram, is created as simple as any other ConceptDraw diagram- with the help of Drag&Drop mechanism you arrange necessary libraries’ objects on a page of your document and connect them among each other with connectors.

Thus, all the activity of a company can be described as the totality of many small business processes, which can be optimized by the way of reengineering for getting new most effective business processes. The obtained optimized description is called “normative” or “to be” and is realized with the help of the same method with the help of which the description “as is” was created.

Business Processes *

The most worked out and commonly used methodology of business processes description is IDEF methodology. Besides business processes it allows to describe functional blocks, for example production and marketing. ConceptDraw lets creation of business processes description using IDEF0 and IDEF2 methods.

TEN RELATED HOW TO's:
When thinking about data visualization, one of the first tools that comes to mind is a flowchart design. You can find flowchart symbols, shapes, stencils and icons easily on the Internet, but it might take time to systematize this information. Nevertheless, once you start flowcharting, you’ll love its simplicity and efficiency. This diagram consists from standard flowchart symbols, approved by ANSI (American National Standard Institute) for drawing flowcharts. A flowchart is a diagram that represents a step-by-step algorithm of any process, displaying the process stages as boxes that are connected with arrows. Flowchart design makes it clear and readable. Flowchart designed using ConceptDraw DIAGRAM flowchart software allows to make attractive and clear process presentation, it makes interpretation of the business process flow fresh and versatile. Great flowchart design view is a big advantage over the diagram created manually on a paper.Flowchart design
Picture: Flowchart design. Flowchart symbols, shapes, stencils and icons
Related Solution:
A Venn diagram, sometimes referred to as a set diagram, is a diagramming style used to show all the possible logical relations between a finite amount of sets. In mathematical terms, a set is a collection of distinct objects gathered together into a group, which can then itself be termed as a single object. Venn diagrams represent these objects on a page as circles or ellipses, and their placement in relation to each other describes the relationships between them. The Venn diagram example below visualizes the the class of language inclusions described by the Chomsky hierarchy.Venn Diagram Examples for Problem Solving. <br> Computer Science. Chomsky Hierarchy *
Picture: Venn Diagram Examples for Problem Solving. Computer Science. Chomsky Hierarchy
Related Solution:
ConceptDraw DIAGRAM extended with IDEF0 Diagrams solution from the Software Development area of ConceptDraw Solution Park is a powerful diagramming and vector drawing IDEF0 software. All IDEF0 diagrams created in ConceptDraw DIAGRAM are vector graphic documents and can be reviewed, modified and converted to MS Visio XML format. To obtain the IDEF0 Visio documents from ConceptDraw DIAGRAM documents use the wide export possibilities of ConceptDraw DIAGRAM.IDEF0 Visio *
Picture: IDEF0 Visio
Related Solution:
These donut chart templates was designed using ConceptDraw DIAGRAM diagramming and vector drawing software extended with Pie Charts solution from Graphs and Charts area of ConceptDraw Solution Park. All these donut chart templates are included in the Pie Charts solution. You can quickly rework these examples into your own charts by simply changing displayed data, title and legend texts.Donut Chart  Templates *
Picture: Donut Chart Templates
Related Solution:
This sample shows the Flowchart that displays the layout and work flow of the cloud marketing platform. This diagram has a style of the marketing brochure. This style displays the central product that is related to the other issues. Using the ready-to-use predesigned objects, samples and templates from the Flowcharts Solution for ConceptDraw DIAGRAM you can create your own professional looking Flowchart Diagrams quick and easy.Flowchart Marketing Process. <br>Flowchart Examples *
Picture: Flowchart Marketing Process. Flowchart Examples
Related Solution:
Any hierarchical structure of any company can be represented as a triangle or a pyramid. You can create a pyramid diagram and pyramid chart of any complexity using special libraries included in ConceptDraw DIAGRAM. Actually, any knowledge or chain of facts can also be depicted as a pyramid. A wide range of graph and chart are utilized in marketing to maintain documentation and various visual issues, that deal with marketing information and data. The marketing value pyramid can be created to illustrate how the value of company, or product is based on its competitiveness. To design this diagram we used ConceptDraw DIAGRAM drawing tools in conjunction with Pyramid solution for Solution Park.Pyramid Diagram and Pyramid Chart *
Picture: Pyramid Diagram and Pyramid Chart
Related Solutions:
The ConceptDraw DIAGRAM Planogram Software and Retail Plan Software offers powerful tools of Enterprise Architecture Diagrams Solution for visualization the market analysis and easy making successful Retail Plans and Planograms with useful detailed recommendations about placing products and optimization the shelf space.Planogram Software <br>and Retail Plan Software *
Picture: Planogram Software and Retail Plan Software
Related Solution:
This sample was created in ConceptDraw DIAGRAM diagramming and vector drawing software using the Flowcharts solution from the Diagrams area of ConceptDraw Solution Park. This sample shows the Flowchart on that it is displayed the process of the determination the permissibility according the Access Copyright license. The diamonds represent the decision points. Inside the diamonds are the questions that need the answer yes/no. It is necessary to answer on the question, make the decision that will determine the next step.Copying Service Process Flowchart. <br>Flowchart Examples *
Picture: Copying Service Process Flowchart. Flowchart Examples
Related Solution:
ConceptDraw
DIAGRAM 18