Create Workflow Diagram
Drawing Steps
In any unclear situation create a workflow diagram. Workflow diagrams help to understand processes, find bottlenecks and fix the process. When you create workflow diagram using ConceptDraw DIAGRAM software you are able to focus on thinking, not drawing, that makes you as effective as possible.

Pic.1 Workflow Diagram Symbols
ConceptDraw DIAGRAM is a best diagramming software. The Workflow Diagrams solution that is program add-on allows users to design well-looking visual data transferring documents, and tasks during performance of a work process. With the help of a workflow diagram templates one can make start optimization of company workflows.

Pic.2 Template of Workflow chart
The Workflow Diagrams solution extends ConceptDraw DIAGRAM software with samples, templates and library of vector stencils for drawing workflow charts. It represents the transferring of data, documents, and tasks during performance of a work process.

Pic.3 Workflow Diagrams solution
Use workflow flowcharts to analyze the work processes, to show the path of the tasks, the responsible persons and the associated documents, to identify required resources, to optimize a workflow, and to discover its inherent weak points.
See also Samples:
TEN RELATED HOW TO's:
You need to draw the Circular Arrows Diagram, Segmented Diagram or Circular Flow Diagram? Any of these diagrams can be fast and easy designed in ConceptDraw DIAGRAM software, which offers the Business Diagrams Solution from the Management Area with extensive drawing tools, predesigned samples and circular flow diagram template. The use of ready template is the easiest way of drawing.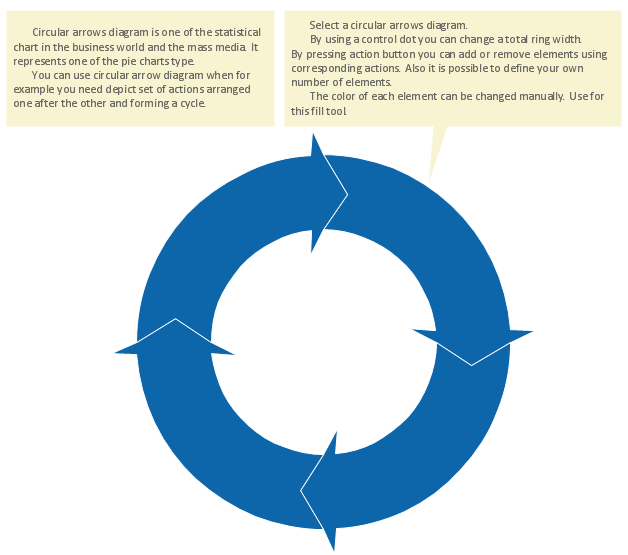
Picture: Circular Flow Diagram Template
Related Solution:
Use ConceptDraw DIAGRAM diagramming and vector graphics software to visually model your own IT construction processes.
Picture: How to Create a Process Flowchart
Related Solution:
Purchasing Workflow Chart as a methods for documenting accounting information systems. Symbols and Methods for designing Accounting System.
Picture: Workflow to Make a Purchase.Accounting Flowchart Example
Related Solution:
This sample shows the Flowchart that displays the architecture of SQL Exception Translation.
This sample was created in ConceptDraw DIAGRAM diagramming and vector drawing software using the Flowcharts solution from the Diagrams area of ConceptDraw Solution Park.
Picture: Sample Project Flowchart. Flowchart Examples
Related Solution:
ConceptDraw Value Stream Mapping solution extends software with templates, samples and vector shapes for drawing Value Stream Maps (VSM).
Picture: Standard Shapes for Value Stream Mapping
Related Solution:
Event-Driven Process Chain Diagrams for improvement throughout an organisation.
ConceptDraw DIAGRAM - software that reduces the time needed to create a business process model.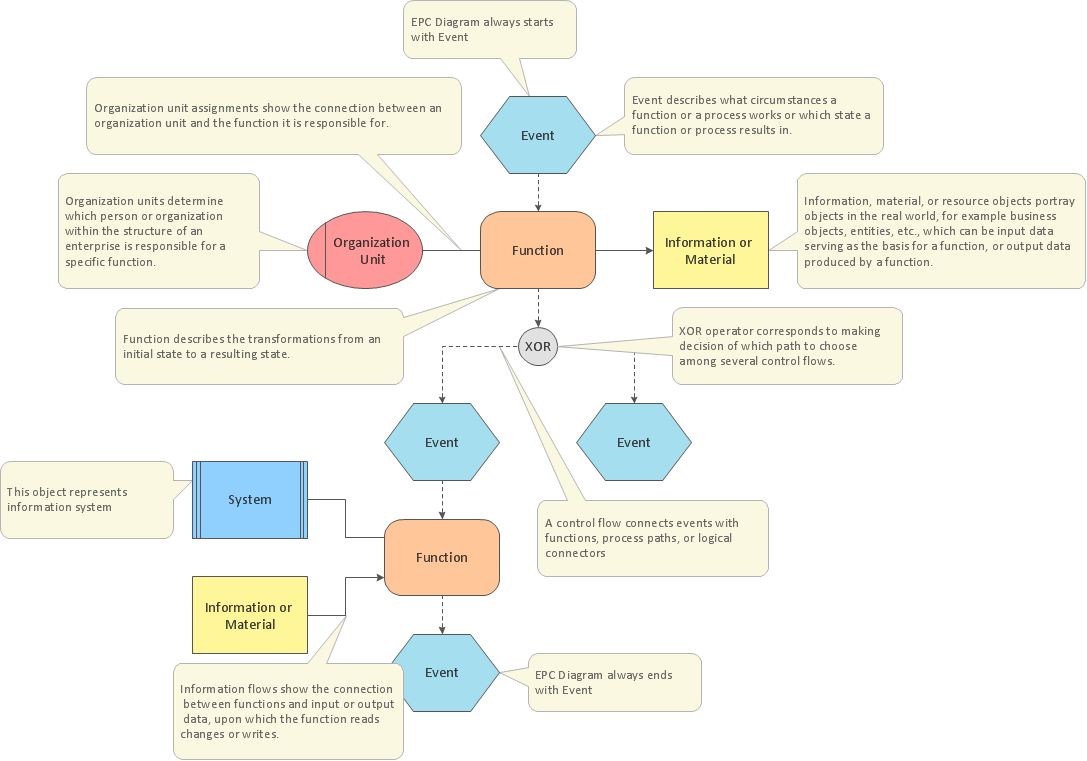
Picture: EPC for Business Process Implementation
Related Solution:
ConceptDraw DIAGRAM diagramming and vector drawing software extended with Specification and Description Language (SDL) Solution from the Industrial Engineering Area of ConceptDraw Solution Park provides powerful drawing tools for quick and easy creating well-designed FSM diagrams.
Picture: FSM — Finite-state Machine
Related Solution:
The Total Quality Management Diagram solution helps your organization visualize business and industrial processes. Create Total Quality Management diagrams for business process with ConceptDraw software.
Picture: Probability Quality Control Tools
Related Solution:
The Event - driven Process Chain ( EPC ) allows managers visually present business process models for making decisions for business processes improvement.
Event-Driven Process Сhain Diagrams for improvement throughout an organisation.
Picture: EPC (Event-driven Process Chain) Flowcharts
Related Solution: