Drawing Workflow Diagrams
Drawing Steps
Drawing workflow diagrams combines both creative and analytic practice. To be the most effective in this process you should find a software that suites this kind of practice. Using ConceptDraw DIAGRAM software for drawing workflow diagrams you get support of features, libraries, templates and samples boosts you creativity and keep you focus on analytic practice, not drawing specifics.
- Show pictorial overview of a business, technical or functional process step-by-step
- Model business process to develop, implement, reuse, analyze, solve problems and improve
- Simplify process collaboration by showing workflow in chain of people and business units
- Visualizecontrol and information flow, business process automation, business process re-engineering, accounting, management, and HR tasks
ConceptDraw DIAGRAM is a best diagramming software. The Workflow Diagrams solution that is program add-on allows users to design well-looking visual data transferring documents, and tasks during performance of a work process.
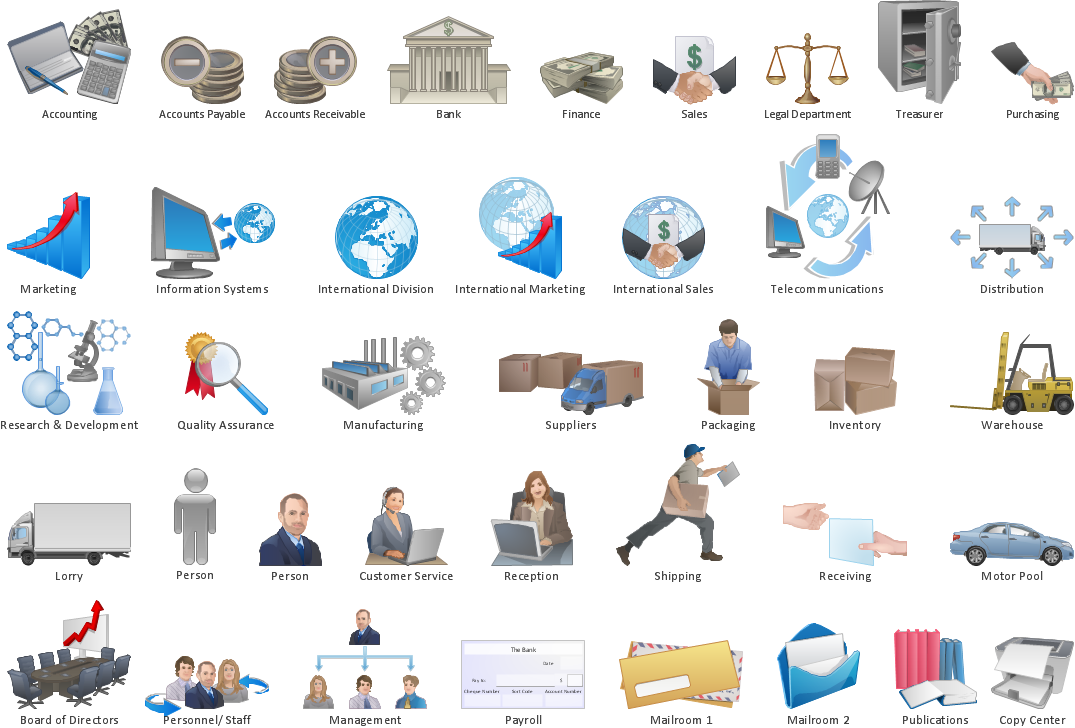
Pic. 1 Design elements of Workflow diagram.
The Workflow Diagrams solution extends ConceptDraw DIAGRAM software with samples, templates and library of vector stencils for drawing workflow charts.

Pic. 2 Drawing Workflow Diagrams (Mac OS X® and Windows®)
Workflow diagrams represent the transferring of data, documents, and tasks during performance of a work process.

Pic. 2 Workflow Diagrams solution
Use workflow flowcharts to analyze the work processes, to show the path of the tasks, the responsible persons and the associated documents, to identify required resources, to optimize a workflow, and to discover its inherent weak points.
See also Samples:
TEN RELATED HOW TO's:
ConceptDraw Wireless network diagrams help you to clearly represent and communicate the architecture, topology, and design of your wireless networks to engineers, stakeholders and end-users.
Picture: Troubleshooting in Wireless Connection
Related Solution:
Acquaintance with flowcharting starts from getting into basic terms. First of all, flowchart definition is quite clear – a flowchart is a graphical representation of a process or an algorithm made of special symbols. Secondly, flowcharting is an irreplaceable tool for IT specialists, project managers, and anyone who wants a clear understanding of any imaginable process.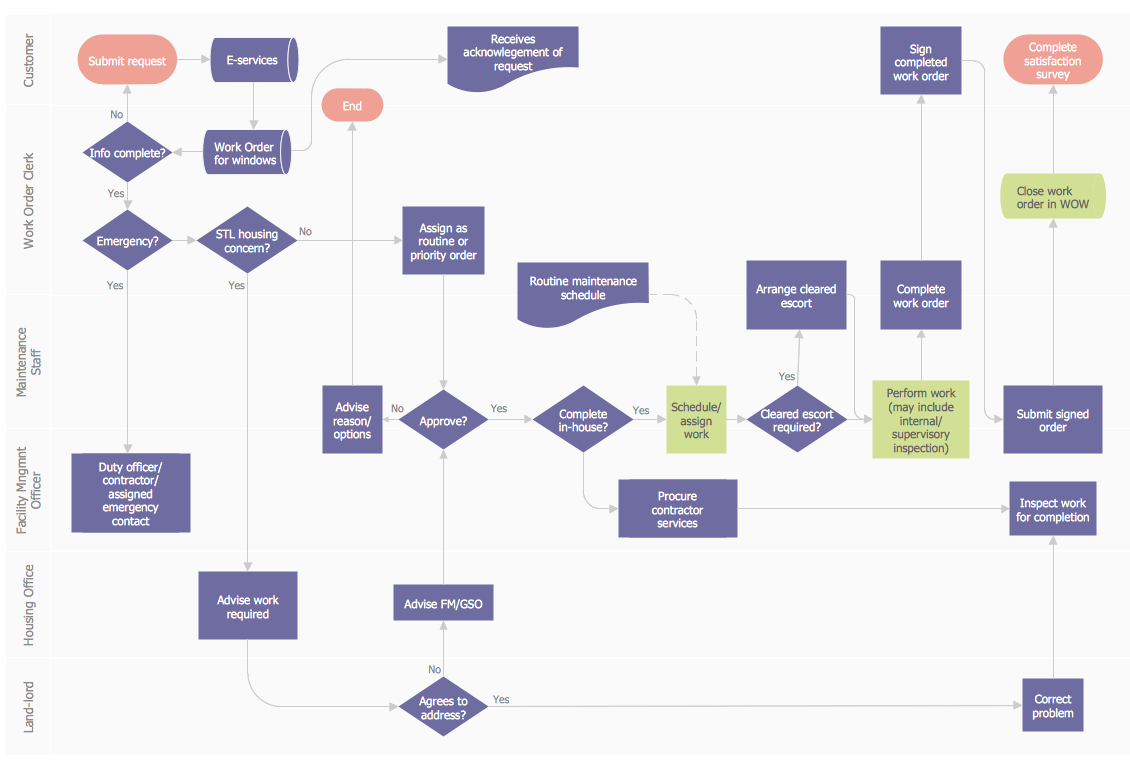
Picture: Flowchart Definition: A Complete Guide
Related Solution:
How to draw pictorial chart quick, easy and effective? ConceptDraw DIAGRAM offers the unique Pictorial Infographics Solution that will help you!
Pictorial Infographics solution contains large number of libraries with variety of predesigned vector pictograms that allows you design infographics in minutes. There are available 10 libraries with 197 vector pictograms.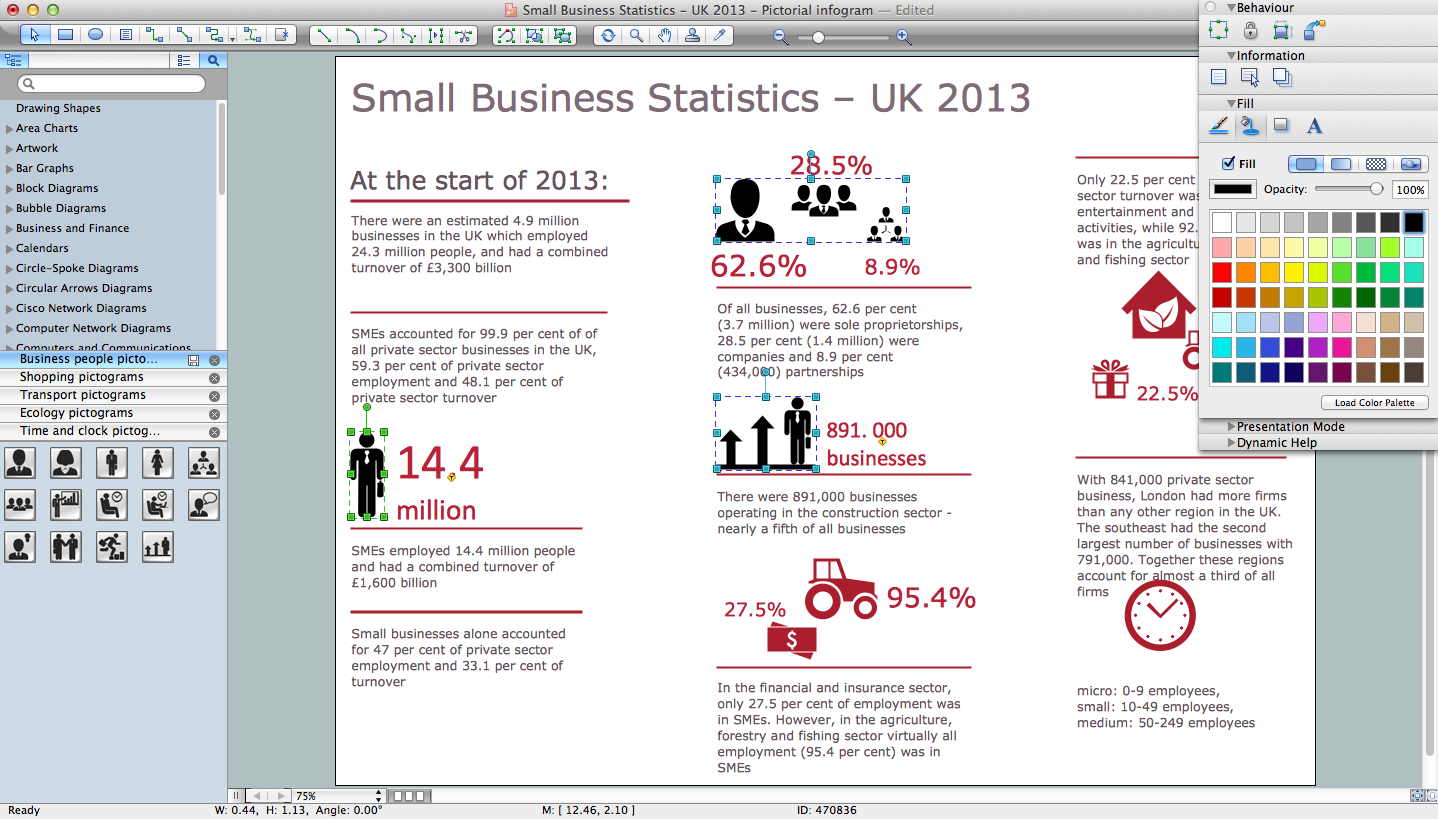
Picture: How to Draw Pictorial Chart. How to Use Infograms
Related Solution:
Create your own flow charts of purchasing business processes using the ConceptDraw DIAGRAM software
Picture:
Purchasing Flowchart - Purchase Order
Flowchart Examples
Related Solution:
The most worked out and commonly used methodology of business processes description is IDEF methodology. Besides business processes it allows to describe functional blocks, for example production and marketing. ConceptDraw lets creation of business processes description using IDEF0 and IDEF2 methods.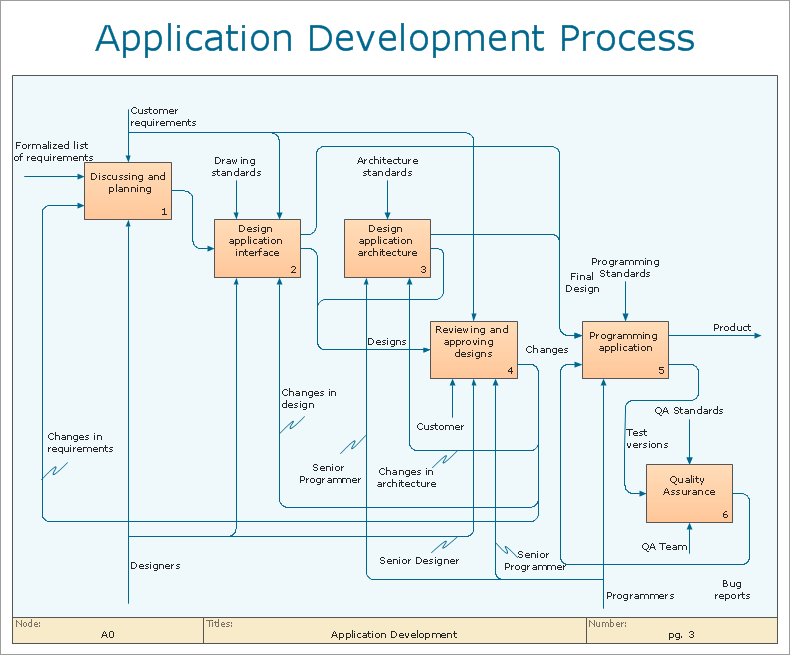
Picture: Business Processes
Related Solution:
ConceptDraw DIAGRAM is a software for simplу depicting the business processes based on BPMN 2.0.
Business Process Diagrams Cross-Functional-Flowcharts, Workflows, Process Charts, IDEF0 and IDEF2, Timeline, Calendars, Gantt Charts, Business Process Modeling, Audit and Opportunity Flowcharts and Mind Maps (presentations, meeting agendas).
Picture: Business Process Modeling Notation
Related Solution:
ConceptDraw DIAGRAM enhanced with Seven Basic Tools of Quality solution from the Quality area of ConceptDraw Solution Park is an ideal software for fast and easy drawing professional looking quality diagrams, including a Fishbone diagram.
Picture: Seven Basic Tools of Quality - Fishbone Diagram
Related Solution:
ConceptDraw DIAGRAM diagramming and vector drawing software aspires to help its users in the hiring process and offers a powerful HR Flowcharts Solution from the Management Area of ConceptDraw Solution Park.
Picture: Hiring Process
Related Solution:
An abstract representation is usually the first thing you will need while developing a database. To understand the ways that databases are structured, you should look through entity-relationship diagram examples and see the notations features and attributes. With an entity-relationship model you can describe a database of any complexity.
This Entity-relationship diagram is a tool for software developers. It enables every element of database to be managed, communicated and tested before release. This ERD was created using symbols advocated by Chen's notation. Because of a linguistic origin of the Chen’s notation, the boxes representing entities could be interpreted as nouns, and the relationships between them are in verb form, shown on a diagram as a diamond.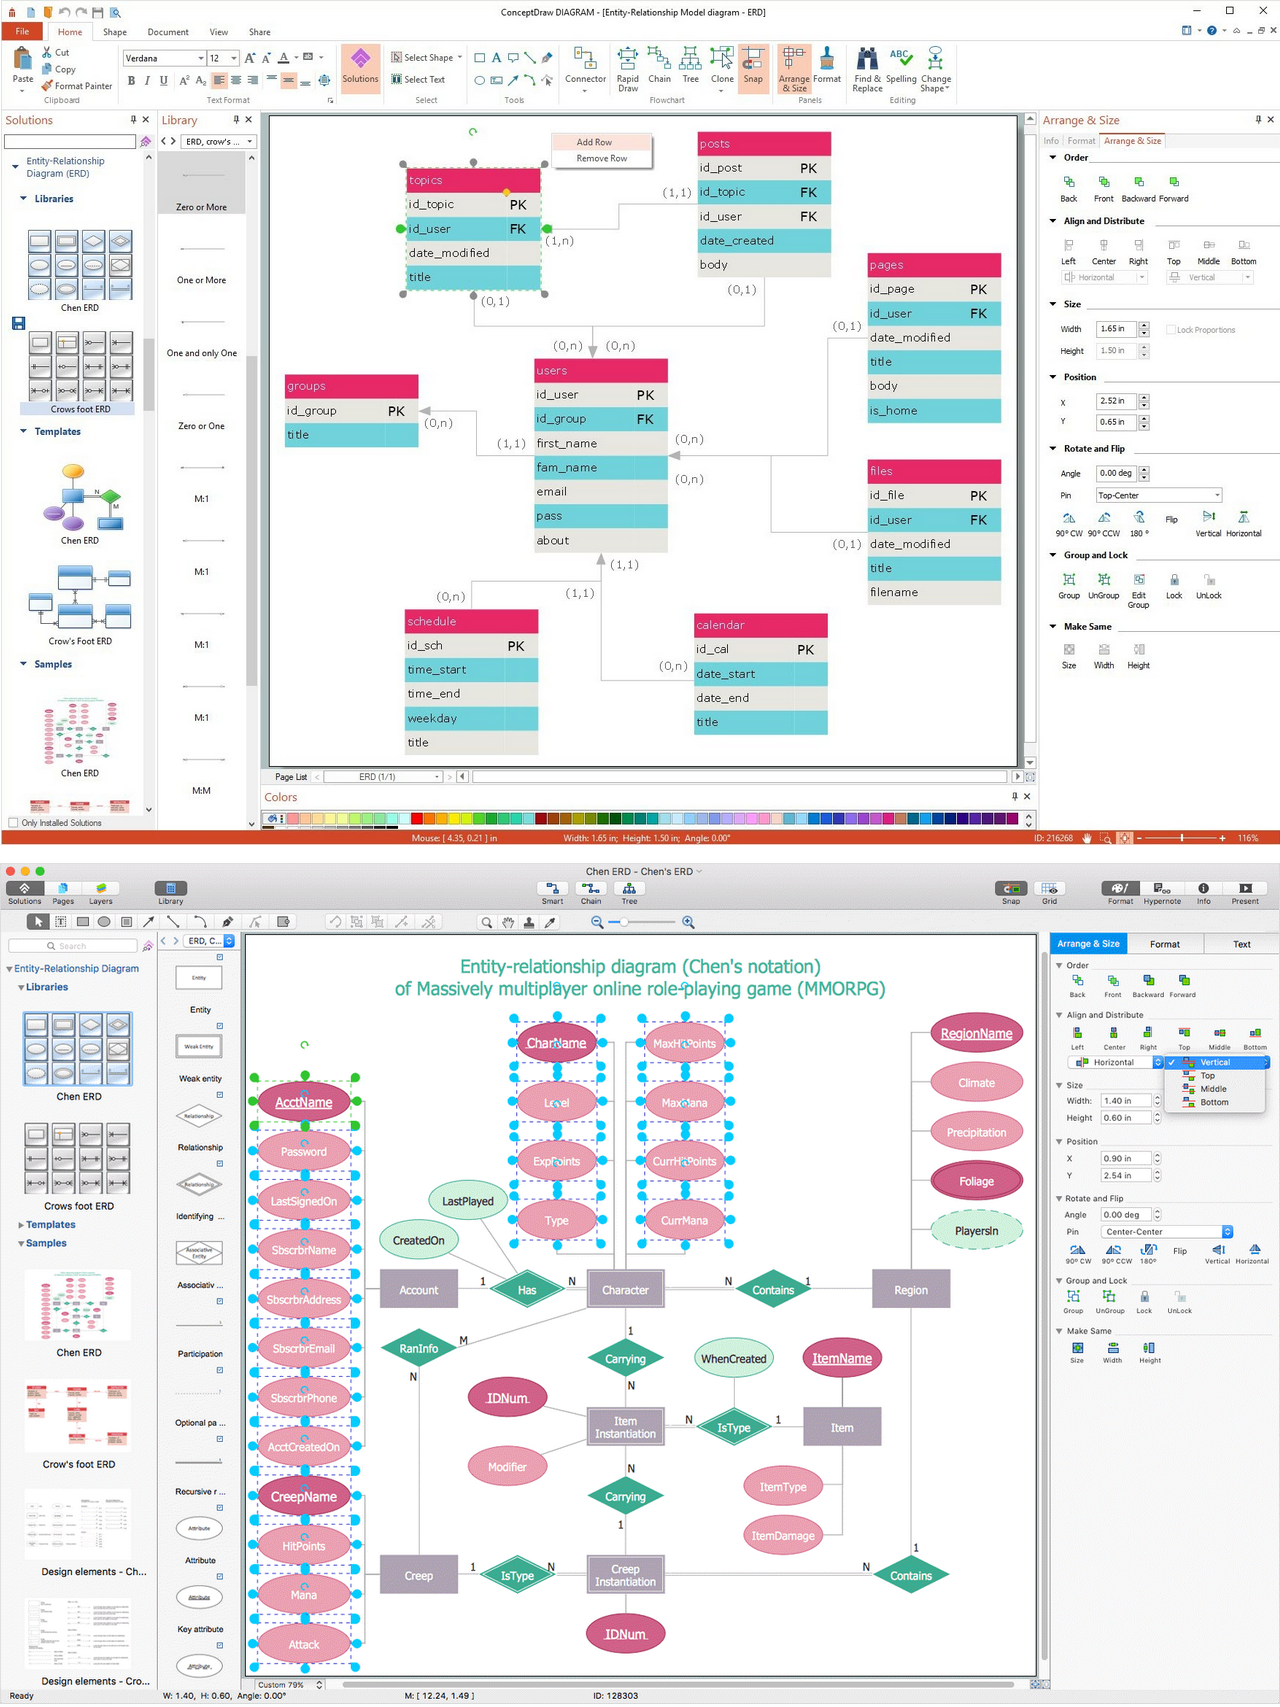
Picture: Entity Relationship Diagram Examples
Related Solution:
The purchasing process follows very specific guidelines and includes a purchasing cycle flowchart and receiving process flow chart. Common key elements of purchasing process.
It is important to know how purchasing processes work and how each operation is done.
Picture: Purchase Process Flow Chart,Receiving Process Flow Chart,Accounting Flowchart Example.
Related Solution:

