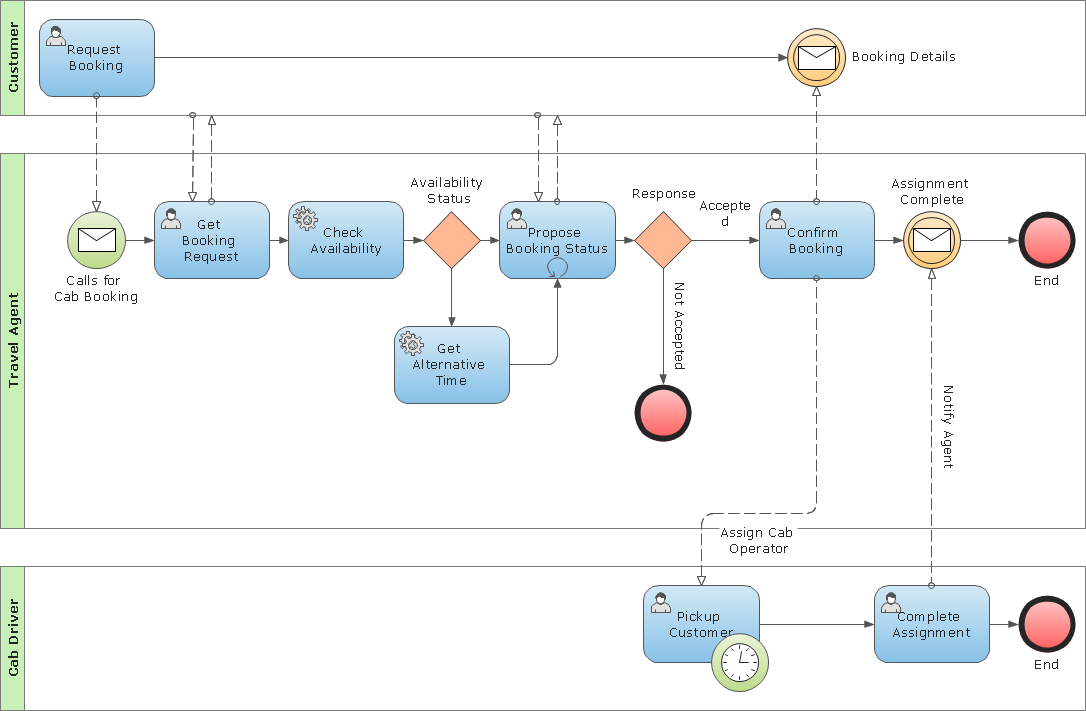
A public (B2B) process represents the interactions between a private business process and another process or participant. Only those activities that communicate outside the private business process are included in the public process. All other “internal” activities of the private business process are not shown. Thus, the public process shows to the outside world the sequence of messages that are required to interact with that business process. Public processes can be modeled separately or within a collaboration to show the flow of messages between the public process activities and other participants.
TEN RELATED HOW TO's:
ConceptDraw DIAGRAM is a business flowchart software includes the wide flowchart examples package.
Picture: Basic Flowchart Examples
Related Solution:
This sample was created in ConceptDraw DIAGRAM diagramming and vector drawing software using the UML Deployment Diagram library of the Rapid UML Solution from the Software Development area of ConceptDraw Solution Park.
This sample shows the work of the ATM (Automated Teller Machine) banking system that is used for service and performing of the banking transactions using ATMs. System engineers can use comprehensive UML diagrams solution.
Picture: UML Deployment Diagram Example - ATM SystemUML diagrams
Related Solution:
What is Purchasing Process and How to Meet The Standards. Common key elements of purchasing process representation.
Picture: Why is it important to have a formal purchasing process?
Related Solution:
Use team meetings, share ideas, brainstorm ideas, team notes with ConceptDraw solution.
Picture: A Tool for EffectiveTeam Meetings
Related Solution:
Software-Defined Networking (SDN) is a new powerful concept for decision these problems. SDN proposes to disaggregate the traditional networking stacks that are vertically integrated to customize the network operations for specialized environments and improve network service velocity.
On this example you can see the Software-Defined Networking (SDN) diagram that was created in ConceptDraw DIAGRAM using the Computer and Networks Area of ConceptDraw Solution Park.
Picture: Software Defined Networking System Overview
Related Solution:
The vector stencils library Yourdon and Coad Notation from the solution OOAD contains specific symbols of the Yourdon and Coad notation such as data store symbol, data process symbol, loop symbol for ConceptDraw DIAGRAM software.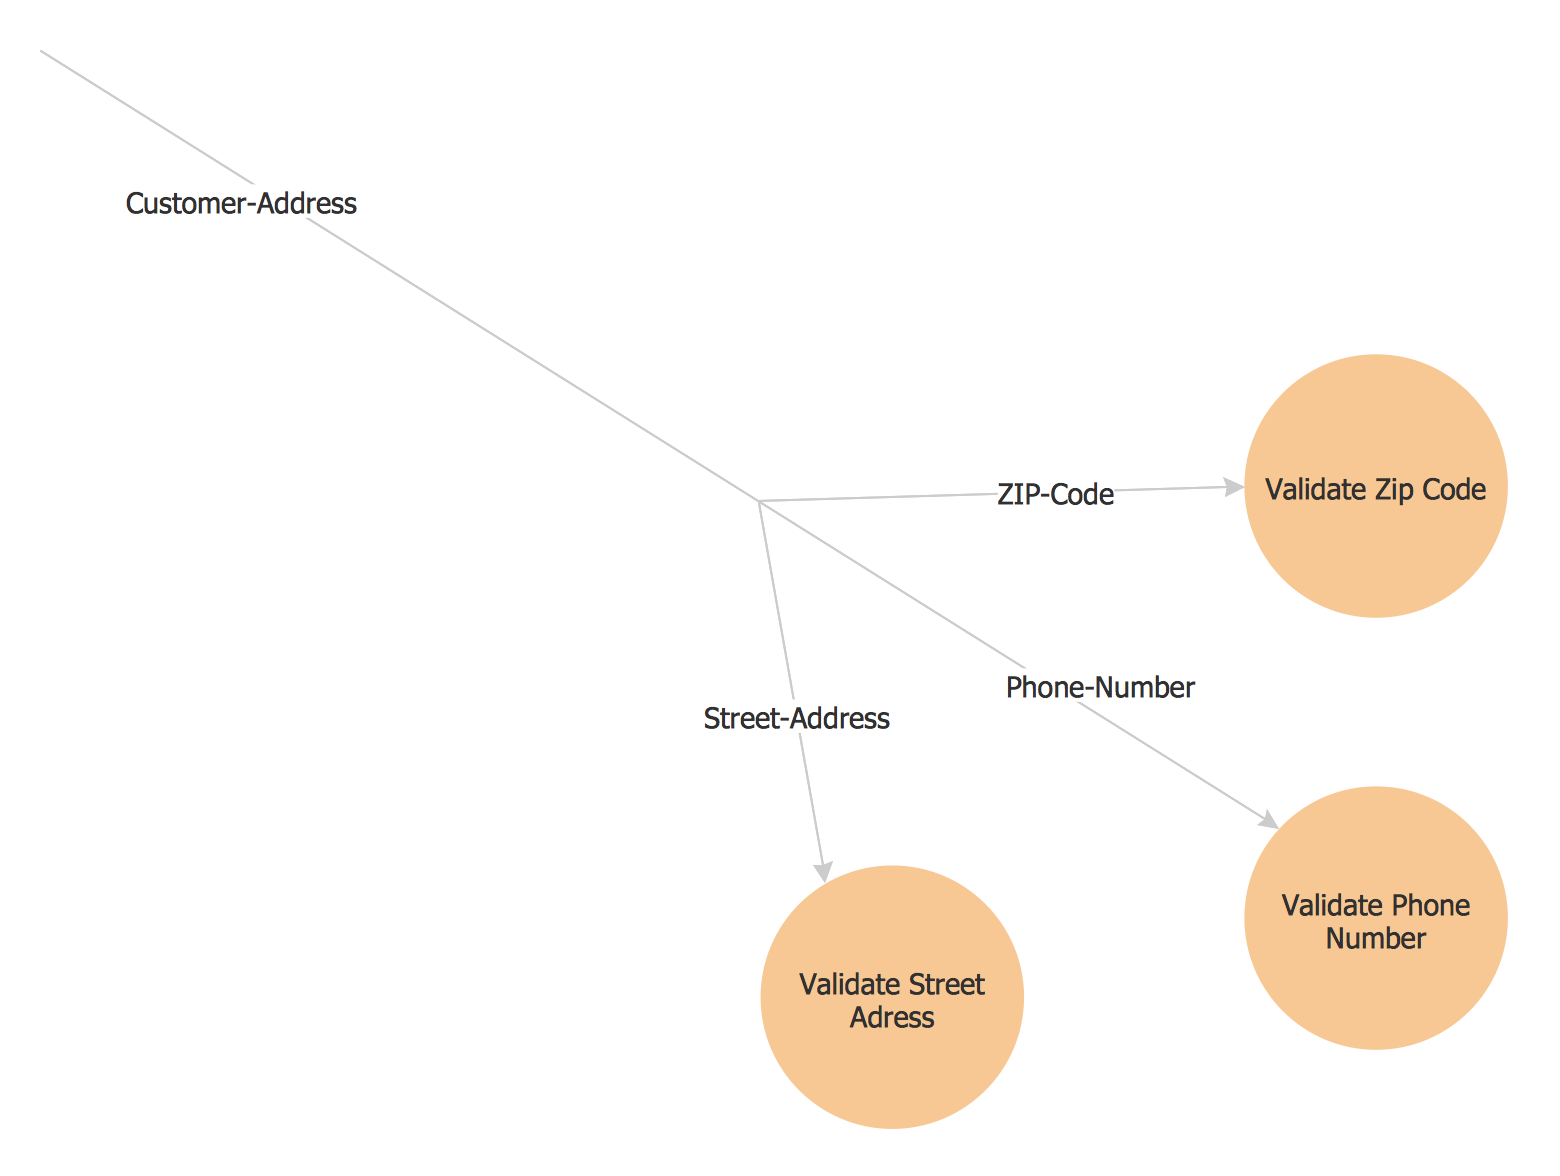
Picture: Yourdon and Coad Diagram
The Total Quality Management Diagram solution helps your organization visualize business and industrial processes. Create Total Quality Management diagrams for business process with ConceptDraw software.
Picture: Probability Quality Control Tools
Related Solution:
The Accounting flowchart shows how information flows from source documents through the accounting records. The are based on the accounting procedures or processes.
Flowcharts are used to represent accounting information in a system. There are special symbols which are used to create accounting flowcharts. Try conceptdraw flowcharting set of symbols to draw a professional charts.
Picture: Why Flowchart Important to Accounting Information System?
Related Solution:
The Process Flowchart or Process Flowchart Diagram (PFD) is a visual representation relations between major parts of the system, the steps in a process, and even connections between various systems. The possibility to easy create professional-looking and attractive Process Flowcharts, Business Process Diagrams and Maps which visualize the steps of complex processes is provided by Business Process Diagram Solution from the Business Processes Area of ConceptDraw Solution Park and 16 libraries with 230 process flowchart symbols from BPMN 1.2 and BPMN 2.0.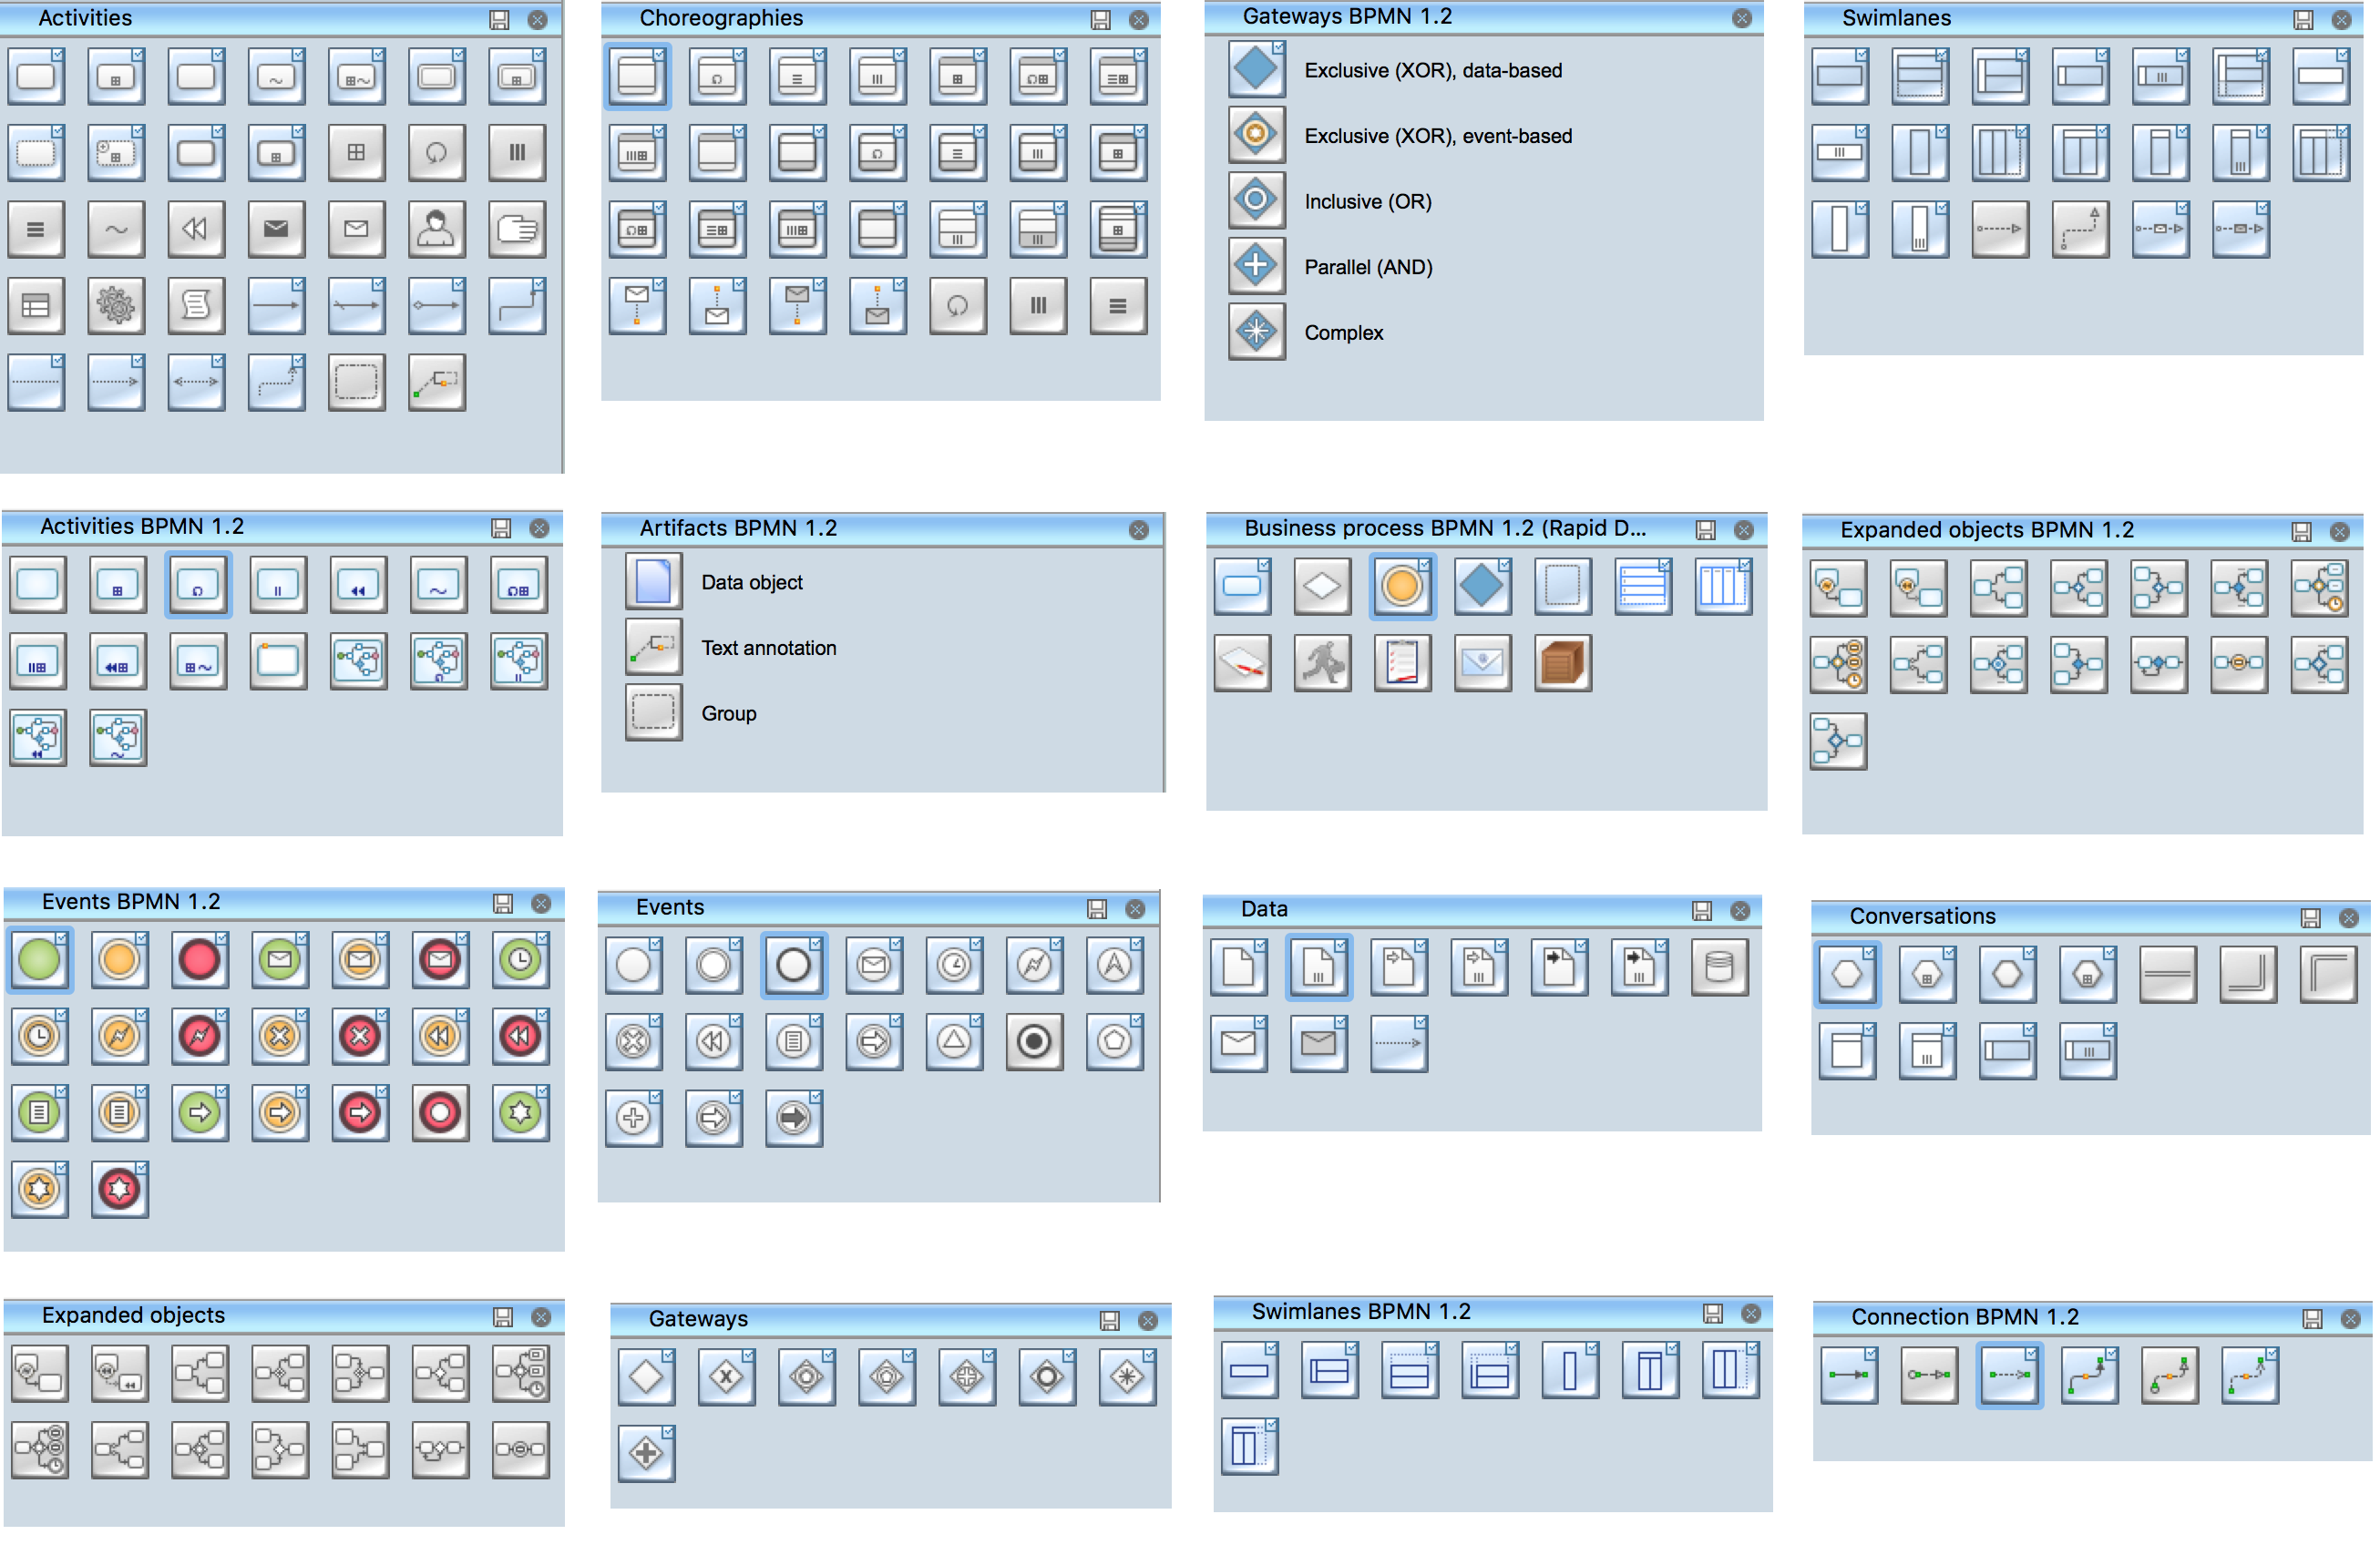
Picture: Process Flowchart Symbols
Related Solution:
Diagramming is an astonishing way to visualize business processes. The list of the most common business process flowchart symbols is quite long starting from basic flowcharts, continuing with SIPOC diagrams. Business process modeling was never easier than now, with special ConceptDraw Business Process Mapping solution.
To carry out all professional standard requirements for business processes mapping, it is necessarily to follow the special graphical notations. ConceptDraw Business Process Mapping solution offers an exhaustive suite of tools to aid business process mapping. There are three vector libraries SIPOC Diagrams, Business Process Flowcharts, and Swim Lanes that contains totally more than 50 symbols of standard BPM notations. This is all that professionals need to effectively evaluate and manage quality in business processes.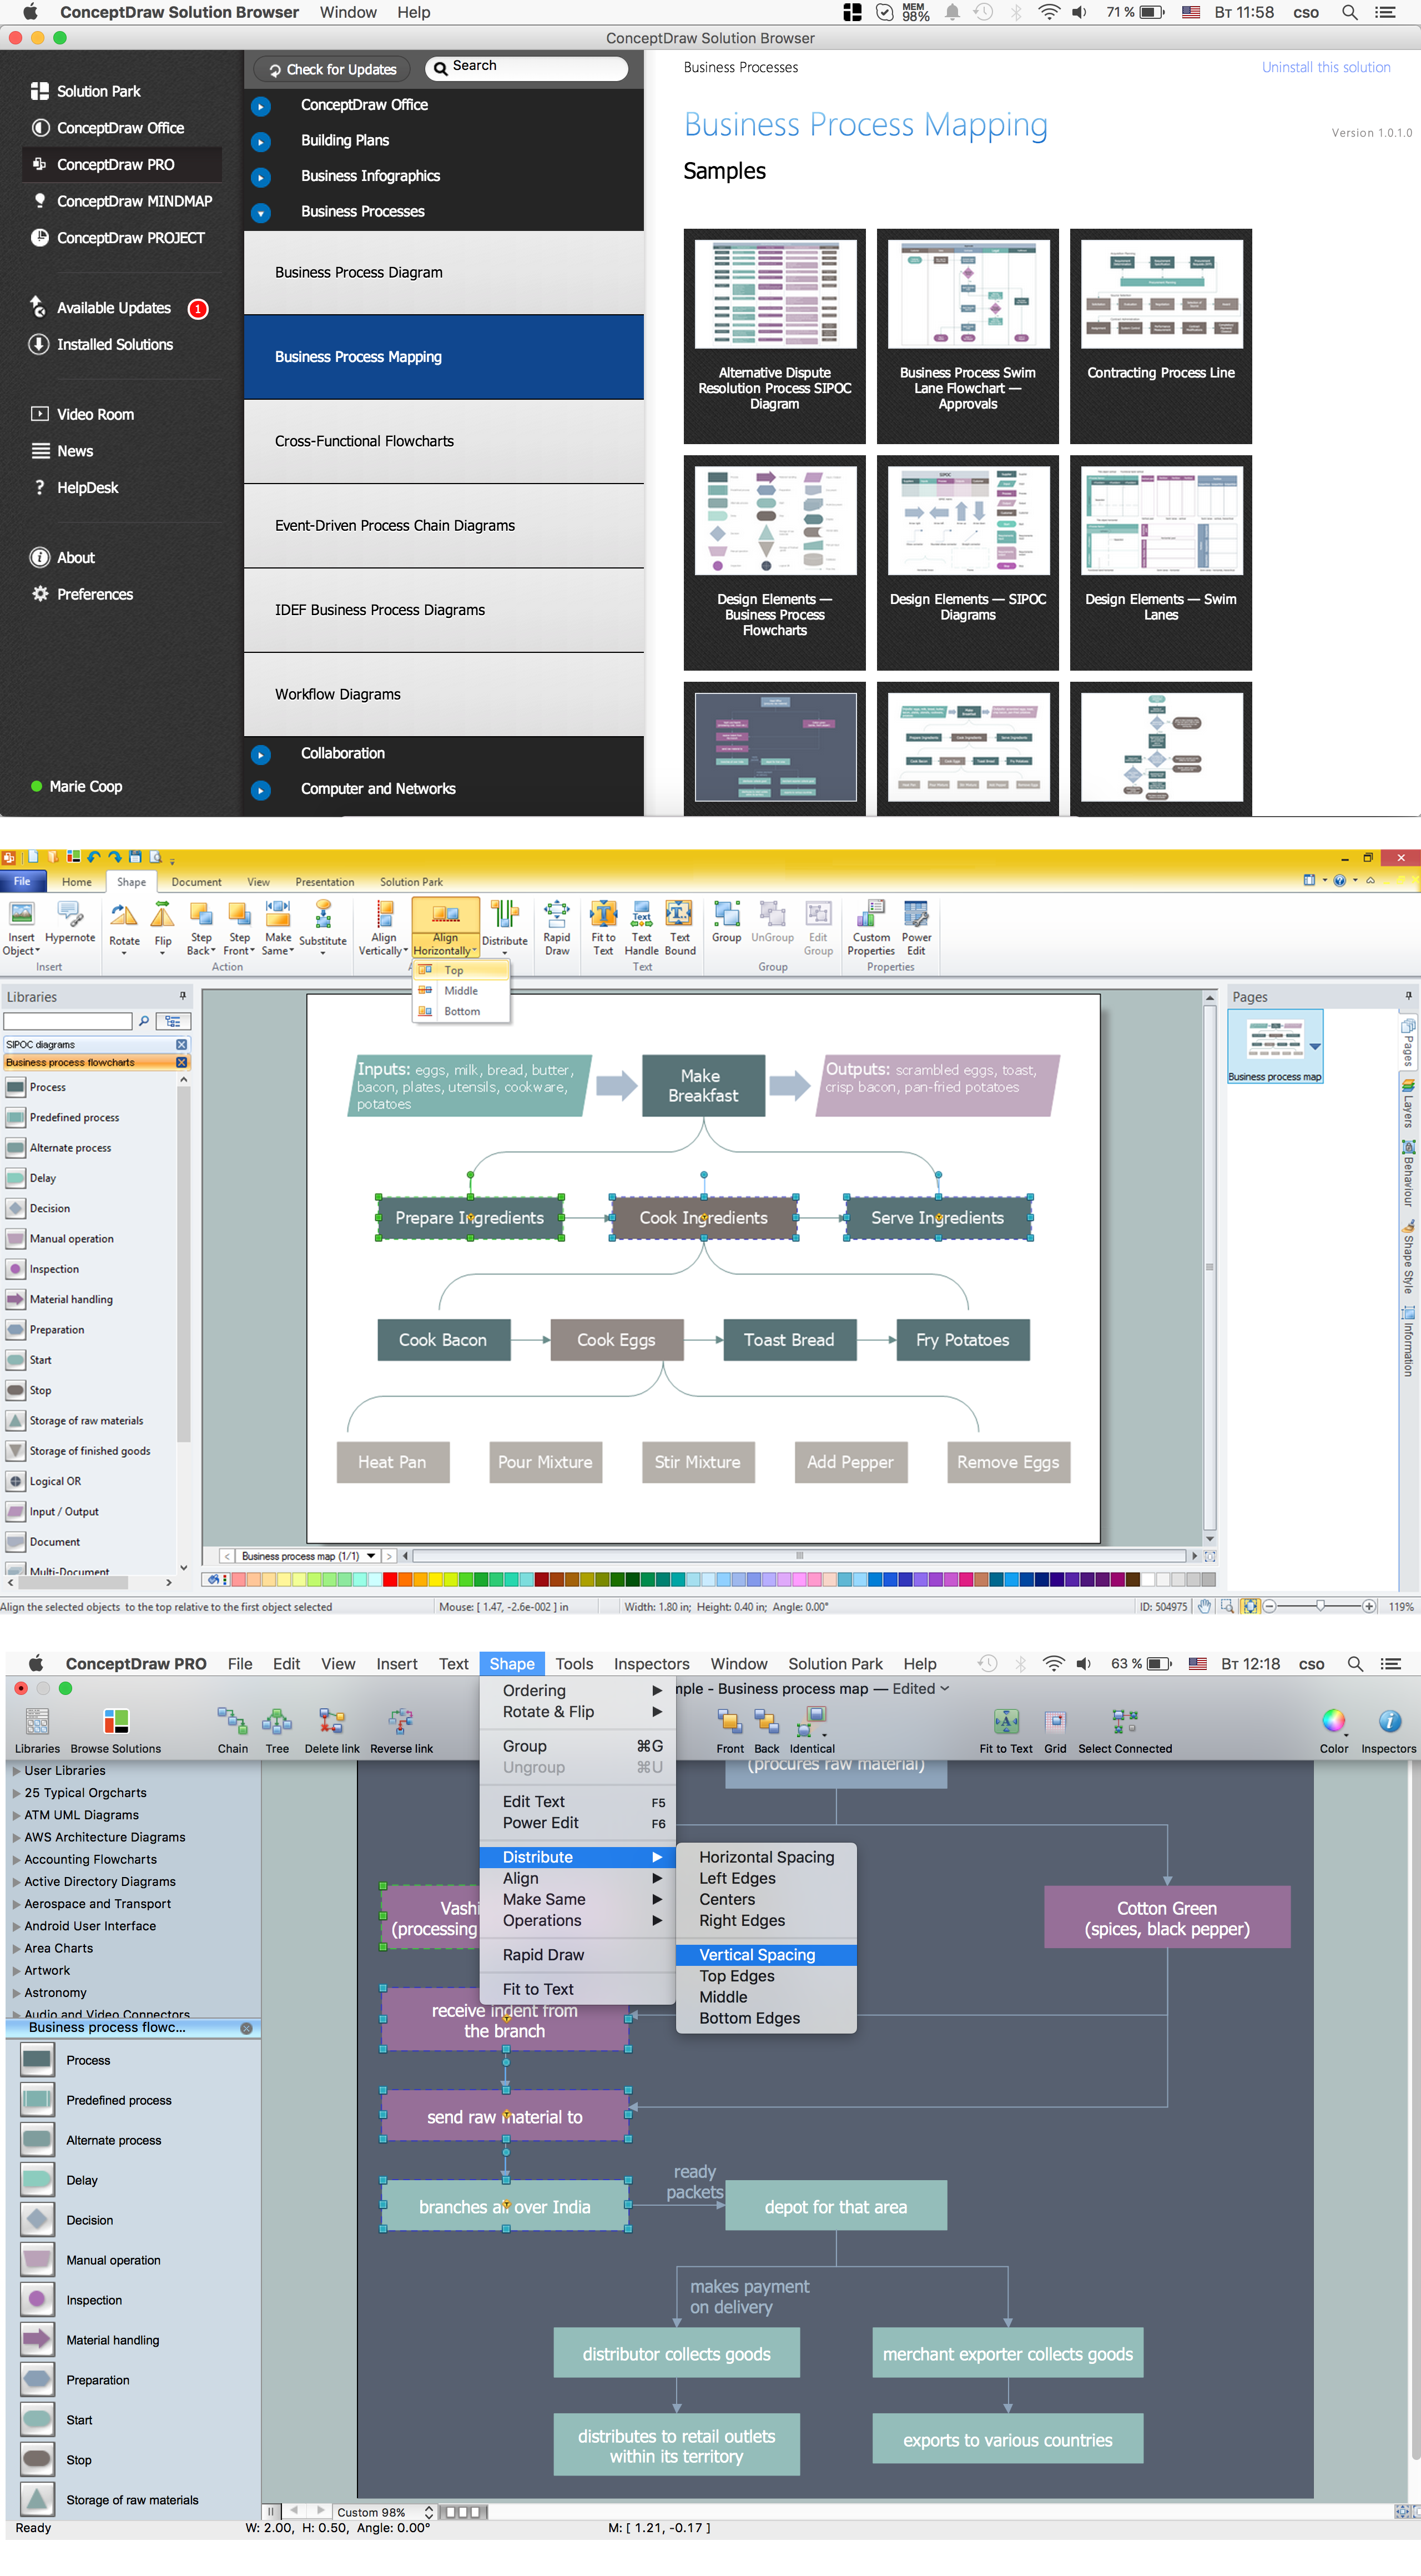
Picture: Business Process Flowchart Symbols
Related Solution: