Business Process Optimization
Business process optimization is one of the most important components of the business process management which helps increase the effectiveness of organization work. Business process optimization includes gathering information about process performance, defining the scale of the process, setting the project boundaries, identifying imperfections, actual and potential bottlenecks, and determination the opportunities for improvements and enhancements the processes, cost reduction and cost savings.
ConceptDraw DIAGRAM vector drawing software extended with Business Process Workflow Diagrams solution from the Business Processes area of ConceptDraw Solution Park ideally suits for effective business process optimization.

Example 1. Business Process Optimization
Powerful and helpful tools of Business Process Workflow Diagrams Solution will be incredibly helpful when implementing business process optimization and drawing Business Process Workflow diagrams, schematics and infographics.

Example 2. Business Process Workflow Diagrams Solution in ConceptDraw STORE
Business Process Workflow Diagrams Solution provides a lot of predesigned samples of Business Process Workflow Diagrams, which are available from ConceptDraw STORE, and 10 libraries with numerous vector objects of workflow chart elements, icons, arrows, connectors, and workflow clipart:
- Workflow Arrows
- Workflow Charts
- Workflow Connectors
- Workflow Departments
- Workflow Finance
- Workflow IT and Security
- Workflow Management
- Workflow Marketing and Sales
- Workflow Office
- Workflow Steps

Example 3. Organization Development and Business Process Reengineering
The business process optimization samples you see on this page were created in ConceptDraw DIAGRAM using the objects from the libraries of Business Process Workflow Diagrams Solution. An experienced user spent 5-10 minutes creating each of these examples.
Use the tools of Business Process Workflow Diagrams Solution for ConceptDraw DIAGRAM software for effective business process optimization.
All source documents are vector graphic documents. They are available for reviewing, modifying, or converting to a variety of formats (PDF file, MS PowerPoint, MS Visio, and many other graphic formats) from the ConceptDraw STORE. The Business Process Workflow Diagrams Solution is available for all ConceptDraw DIAGRAM or later users.
TEN RELATED HOW TO's:
You need to draw the Circular Arrows Diagram, Segmented Diagram or Circular Flow Diagram? Any of these diagrams can be fast and easy designed in ConceptDraw DIAGRAM software, which offers the Business Diagrams Solution from the Management Area with extensive drawing tools, predesigned samples and circular flow diagram template. The use of ready template is the easiest way of drawing.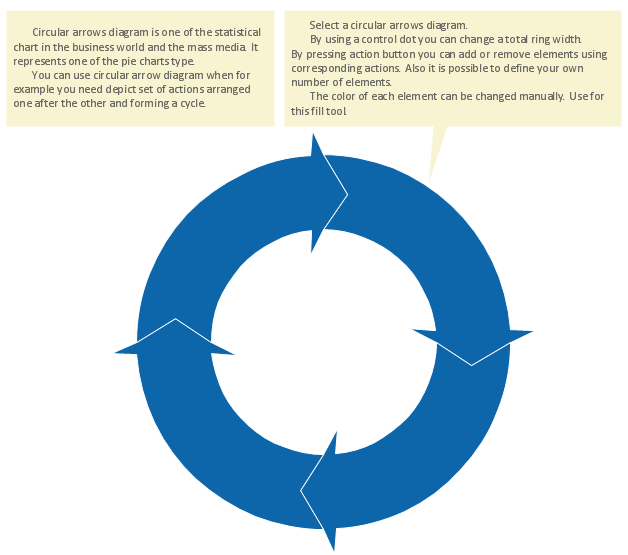
Picture: Circular Flow Diagram Template
Related Solution:
A requisition form is one of the documents used for accounting in different manufacturing processes. There are two main types of requisition: a purchasing requisition and material requisition and difference between them is significant. Creating a flowchart might help you in understanding all the details of accounting process.
Flowcharts are a best visual method for dividing a large and complicated procedure into a several little clear pieces. The main value-ability of an effective flowchart is its simpleness. Material requisition flowcharts are used to document the process of relationships between the different departments and the purchasing department within an organization. The flow chart gives the step-by-step guide on how is carried out the procurement process of the materials necessary for the functioning of the organization. This type of flowchart along with many other business flowcharts, one can easy create using ConceptDraw Flowcharts solution.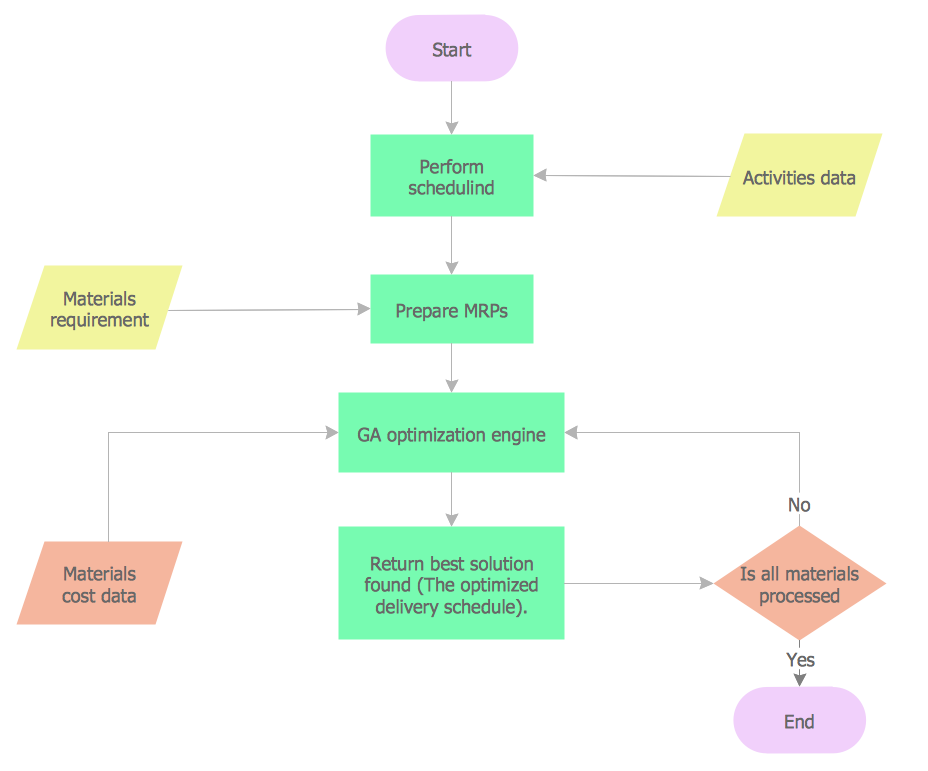
Picture: Material Requisition Flowchart. Flowchart Examples
Related Solution:
This sample shows the Bar Chart of the leverage ratios for two major investment banks. The leverage ratio is the ratio of the total debt to the total equity; it is a measure of the risk taken by the bank. The higher of the leverage ratio denotes the more risk, the greater risks can lead to the subprime crisis.
Picture: Financial Comparison Chart
Related Solution:
ConceptDraw DIAGRAM is a business flowchart software includes the wide flowchart examples package.
Picture: Basic Flowchart Examples
Related Solution:
The Value stream is a totality of all actions on the projection, order composition and production: starting from creation a product project to launching this product, from order to delivery, from extraction of raw materials to ready product manufacturing. Value stream mapping is a process of visualization of these actions and creation of a detailed and graphical map.
Picture: Value stream with ConceptDraw DIAGRAM
Related Solution:
ConceptDraw DIAGRAM software supplied with HR Flowcharts Solution can effectively help in labour-intensive process of human resource development.
Picture: Human Resource Development
Related Solution:
This sample shows the Scatter Plot without missing categories. It’s very important to no miss the data, because this can have the grave negative consequences. The data on the Scatter Chart are represented as points with two values of variables in the Cartesian coordinates. This sample can be used in the engineering, business, statistics, analytics, at the creating the financial and other types of reports.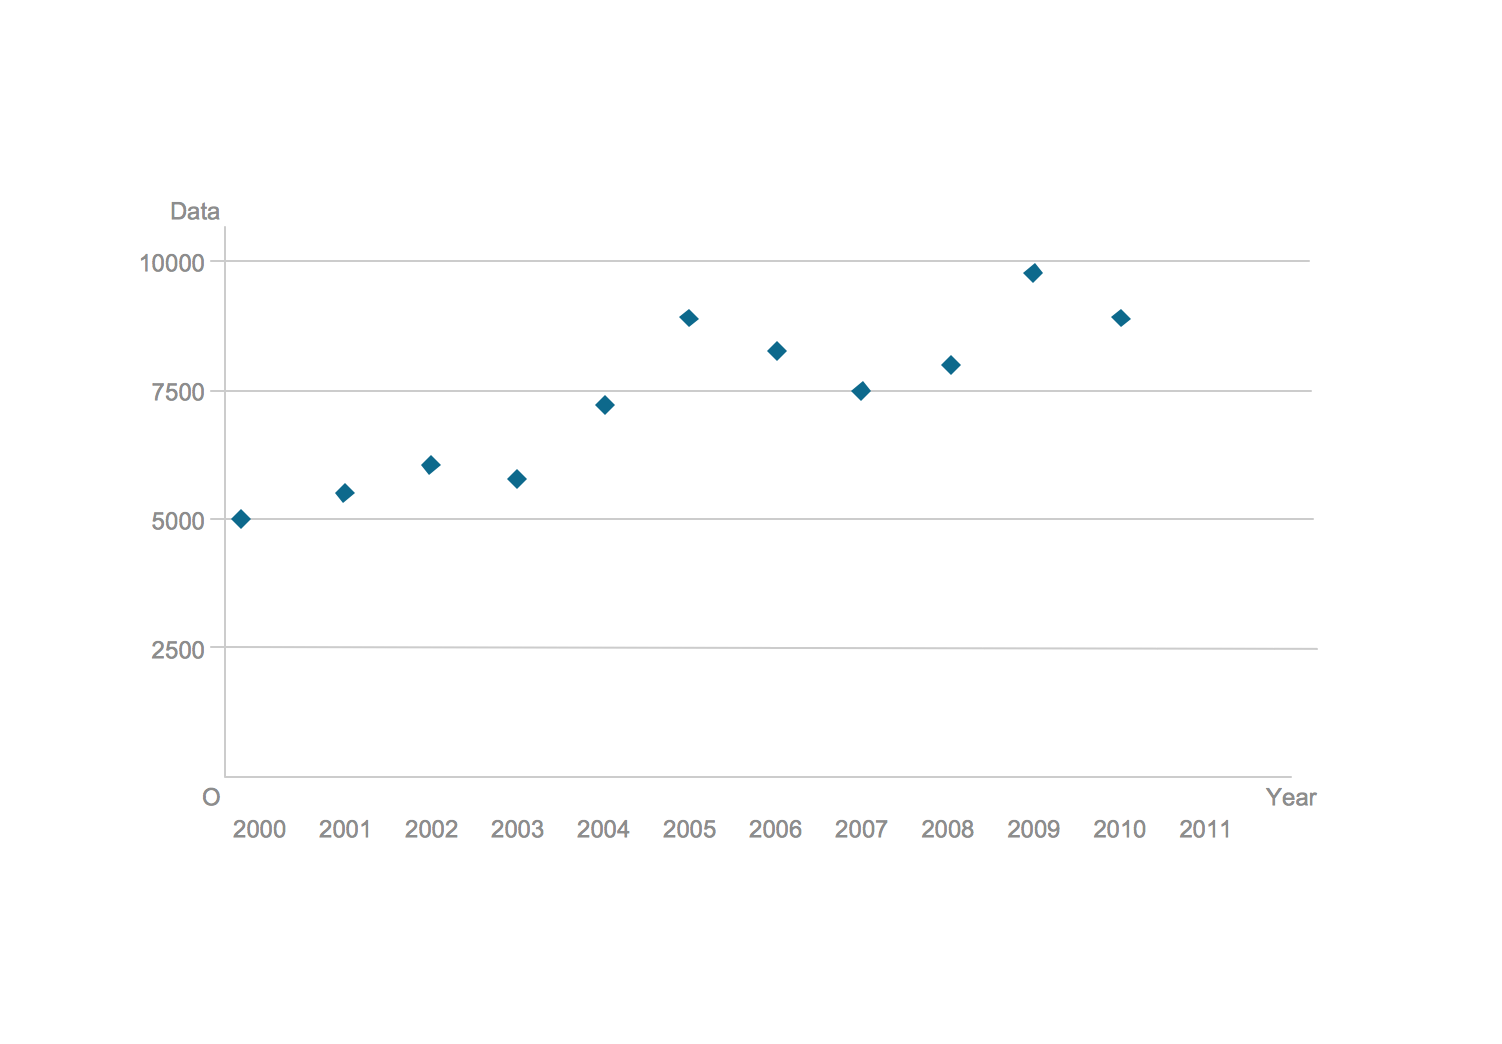
Picture: Blank Scatter Plot
Related Solution:
An event-driven process chain diagram is a flowchart used in business process analysis. It evolved from Architecture of Integrated Information Systems (ARIS) and utilised in the business process improvement and analysis. It is also used to facilitate enterprise resource planning.
An EPC diagram is a complex flowchart that shows different business processes through various workflows. The workflows are seen as functions and events that are connected by different teams or people, as well as tasks that allow business processes to be executed.
ConceptDraw DIAGRAM is a software for making EPC diagrams that allows managers visually present business process models for making decisions for business.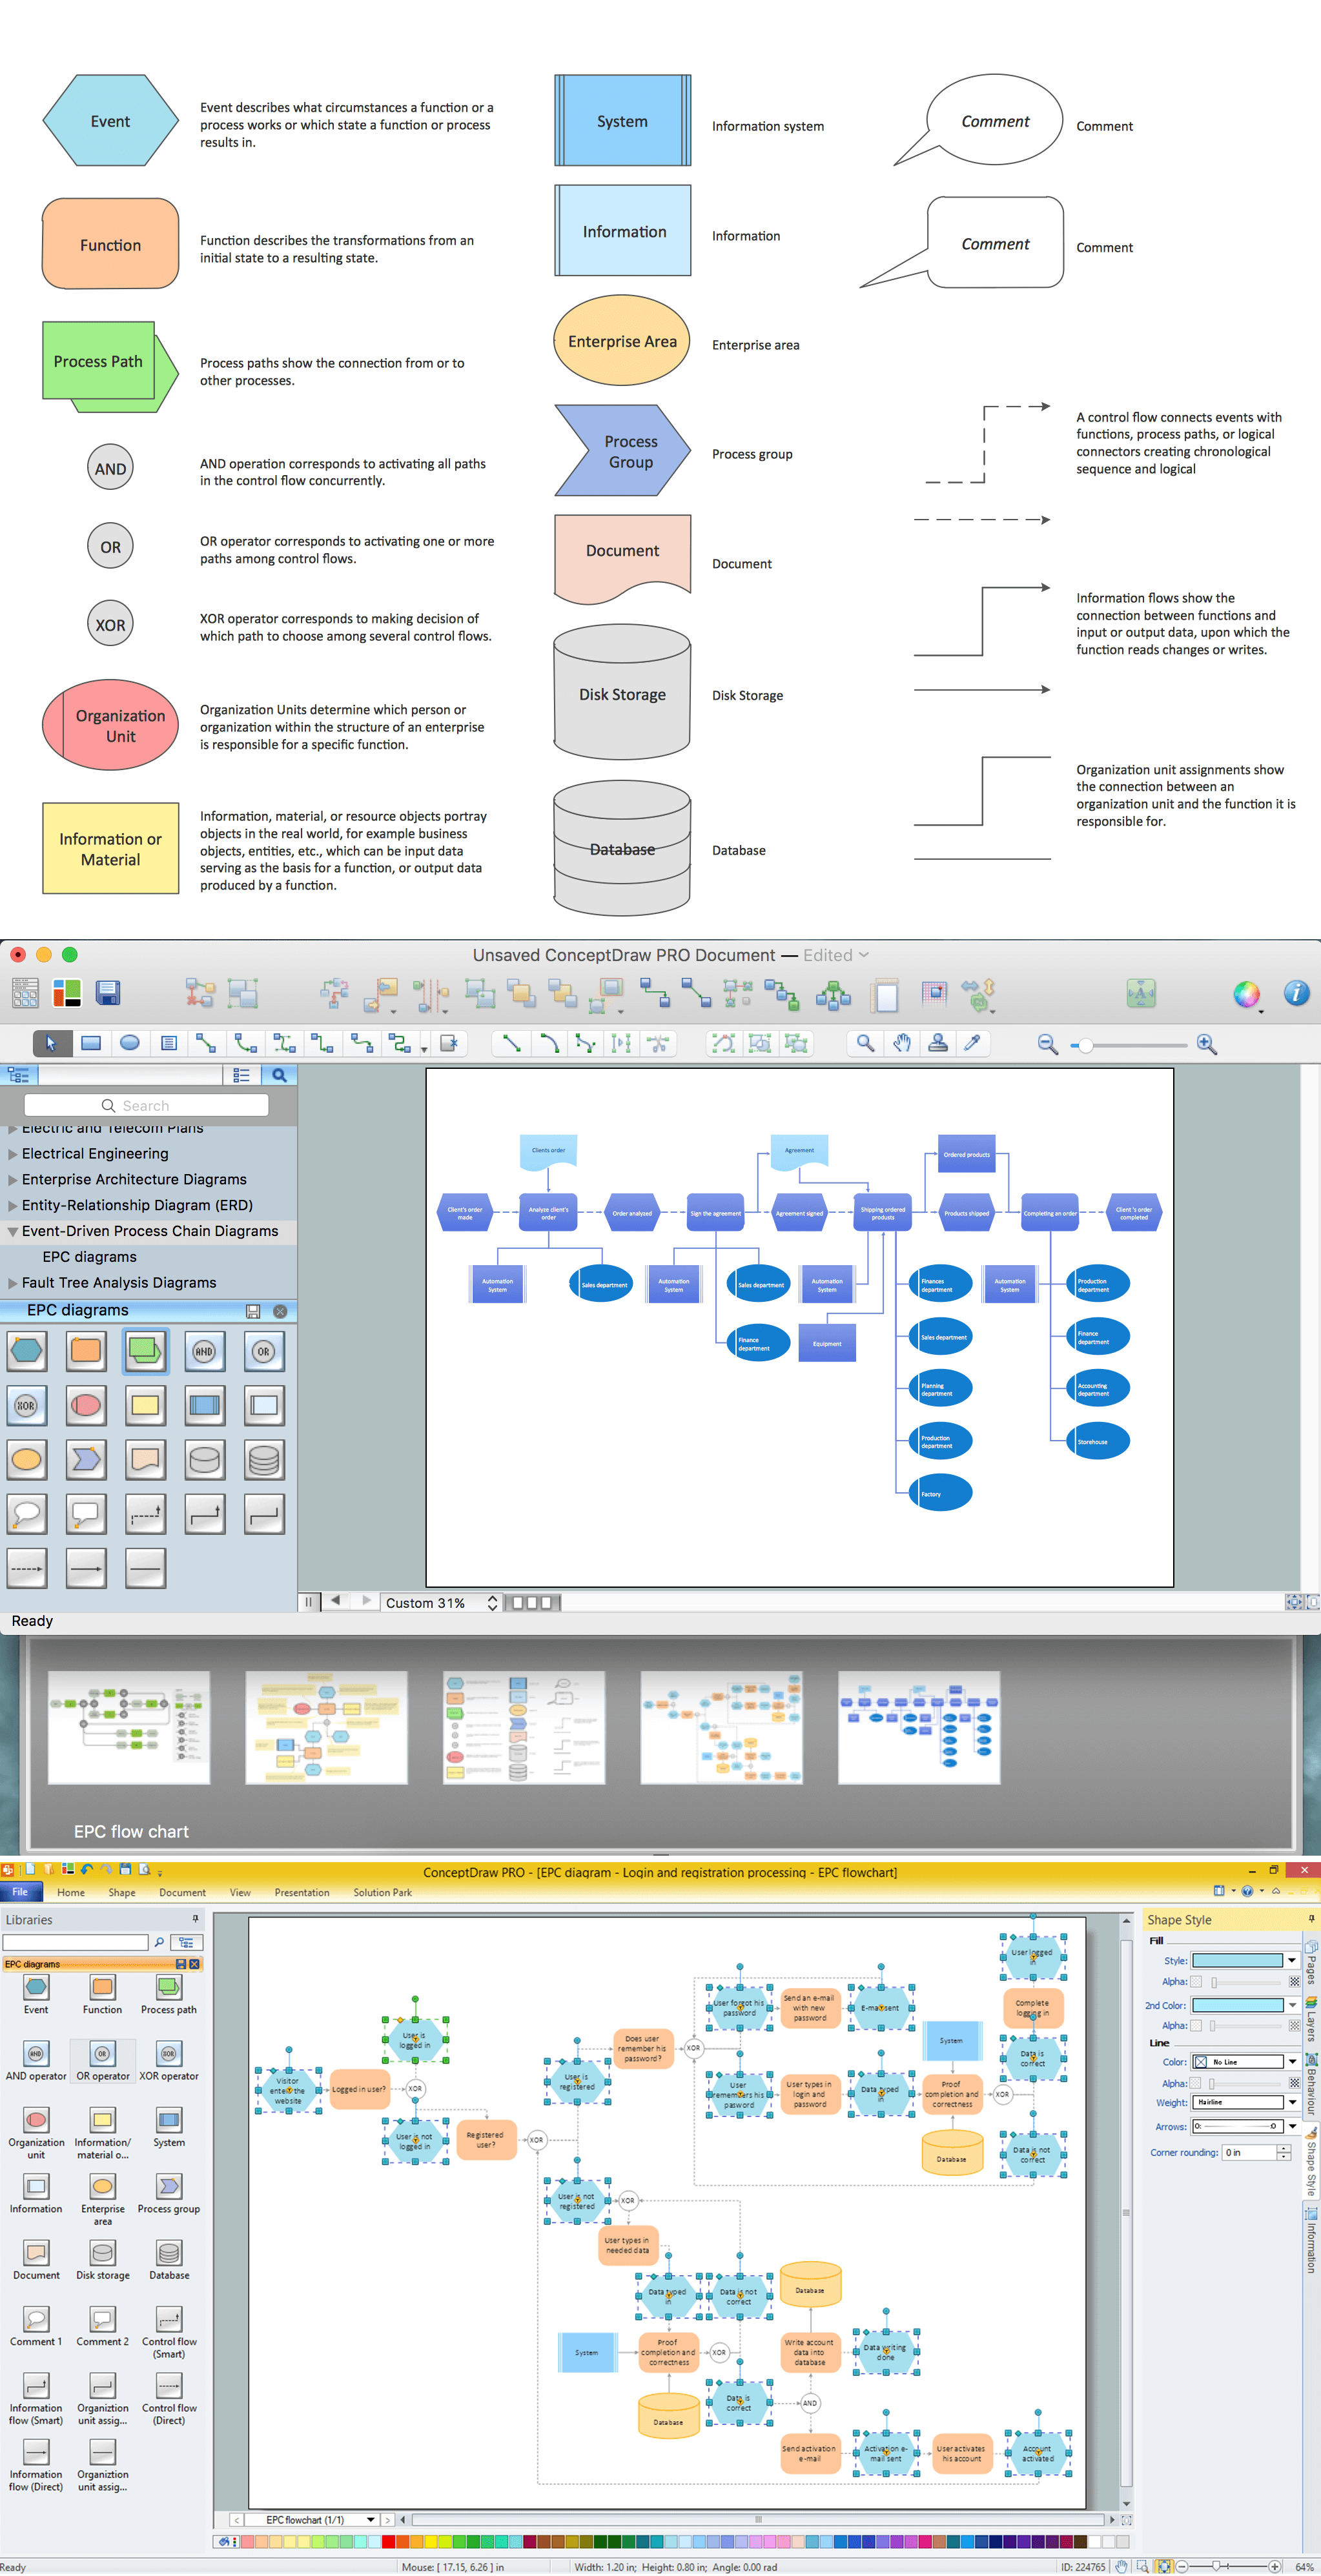
Picture: How to Draw EPC Diagram Quickly
Related Solution:
To draw a good diagram of a business workflow you should have a ready-to-use set of pre-designed objects you may drag-and-drop to your document focusing on the workflow structure and meaning, not drawing tools. ConceptDraw DIAGRAM with Workflow Diagrams solution provides complete set of design element you may use to draw a good diagram of a business workflow.
Picture: How to Draw a Good Diagram of a Business Workflow?
Related Solution:
Developing a software project supposes architecture first. To make it proper, you can use data flow diagram model in your current project.
The data flow diagram represents the Model of small traditional production enterprise that is made using Yourdon and Coad notation. It shows how the data is transfered through a process. According to the notation of Yourdon and Coad a process is represented by circles and data stores are drawn using parallel lines. This DFD was created using the ConceptDraw Data Flow Diagrams solution. Using this solution one can visualize data flow accordingly to the rules of two basic notations used for data flow modeling.
Picture: Data Flow Diagram Model
Related Solution:

