Optimize a Workflow
Work Processes
The first step to optimize a workflow is to get its visual depiction. Then you can analyse and optimize the workflow making changes to your workflow diagram. We recommend to use ConceptDraw DIAGRAM software extended with the Workflow Diagram solution to visualize and optimize your workflow. It allows you produce easy-to-change scalable vector graphic workflow and then present it to your team or partners.
ConceptDraw DIAGRAM is a professional diagramming software. To optimize of working processes and for presenting them in a simple visual manner, the Workflow Diagrams solution can be used. With the help of a workflow diagram templates one can make start optimization of company workflows.

Pic.1 Template of Workflow diagram.
The Workflow Diagrams solution extends ConceptDraw DIAGRAM software with samples, templates and library of vector stencils for drawing workflow diagrams. It represents the transferring of data, documents, and tasks during performance of a work process. Use workflow flowcharts to analyze the work processes, to show the path of the tasks, the responsible persons and the associated documents, to identify required resources, to optimize a workflow, and to discover its inherent weak points.
See also Samples:
TEN RELATED HOW TO's:
Audit Steps - The auditing process is an independent examination of data, statements, operations, records, financial or otherwise performances of an enterprise for any stated purpose. It is a complex process that includes 10 audit steps: Notification, Planning, Opening Meeting, Fieldwork, Communication, Draft Audit, Management Response, Final Meeting, Report Distribution, Feedback.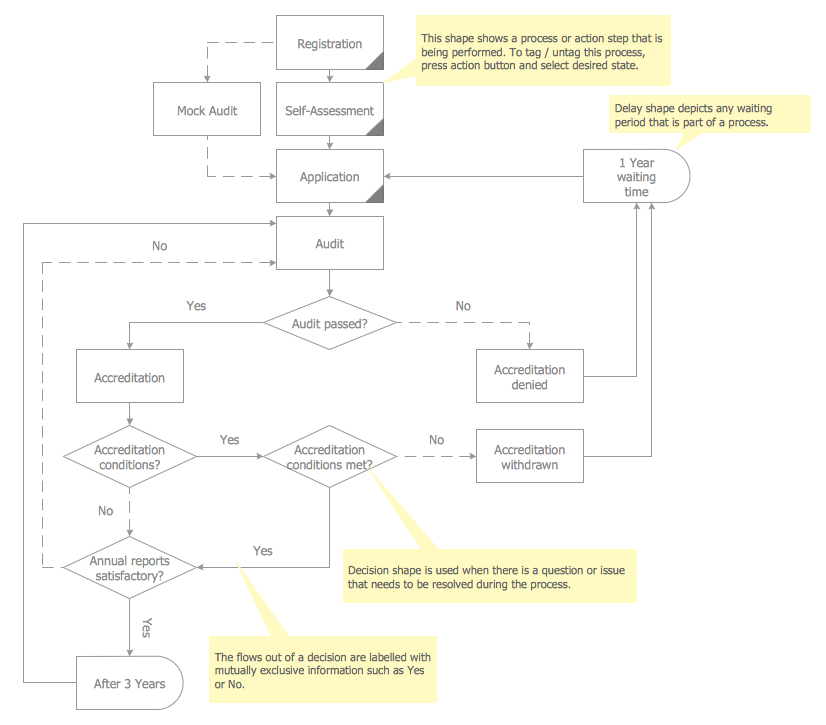
Picture: Audit Steps
Related Solution:
To begin managing a new project, you will need to define the individual Tasks that must be completed to deliver it. The default view for a new project in ConceptDraw PROJECT is the Gantt Chart.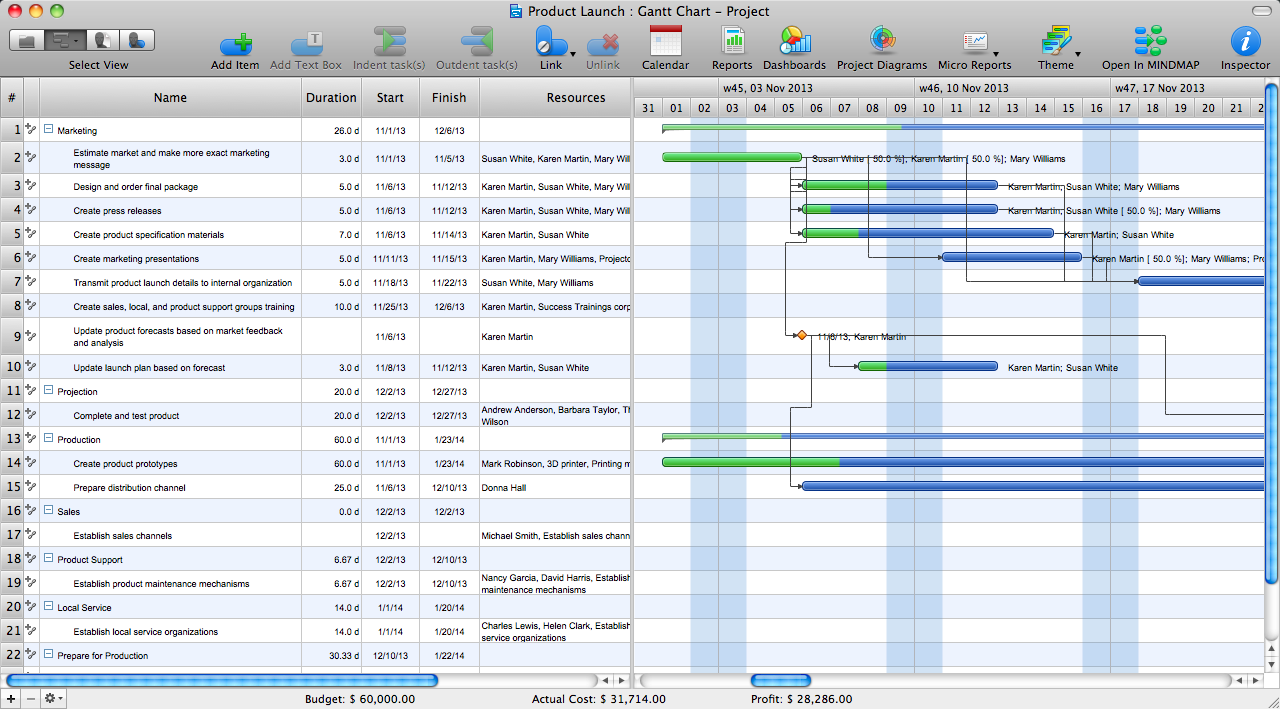
Picture: How to Create Gantt Chart
When trying to figure out the nature of the problems occurring within a project, there are many ways to develop such understanding. One of the most common ways to document processes for further improvement is to draw a process flowchart, which depicts the activities of the process arranged in sequential order — this is business process management. ConceptDraw DIAGRAM is business process mapping software with impressive range of productivity features for business process management and classic project management. This business process management software is helpful for many purposes from different payment processes, or manufacturing processes to chemical processes. Business process mapping flowcharts helps clarify the actual workflow of different people engaged in the same process. This samples were made with ConceptDraw DIAGRAM — business process mapping software for flowcharting and used as classic visio alternative because its briefly named "visio for mac" and for windows, this sort of software named the business process management tools.
This flowchart diagram shows a process flow of project management. The diagram that is presented here depicts the project life cycle that is basic for the most of project management methods. Breaking a project into phases allows to track it in the proper manner. Through separation on phases, the total workflow of a project is divided into some foreseeable components, thus making it easier to follow the project status. A project life cycle commonly includes: initiation, definition, design, development and implementation phases. Distinguished method to show parallel and interdependent processes, as well as project life cycle relationships. A flowchart diagram is often used as visual guide to project. For instance, it used by marketing project management software for visualizing stages of marketing activities or as project management workflow tools. Created with ConceptDraw DIAGRAM — business process mapping software which is flowcharting visio alternative or shortly its visio for mac, this sort of software platform often named the business process management tools.
Picture: Process Flowchart: A Step-by-Step Comprehensive Guide
Related Solution:
Activity diagram describes the business and operational step-by-step workflows of components in a system. An activity diagram shows the overall flow of control.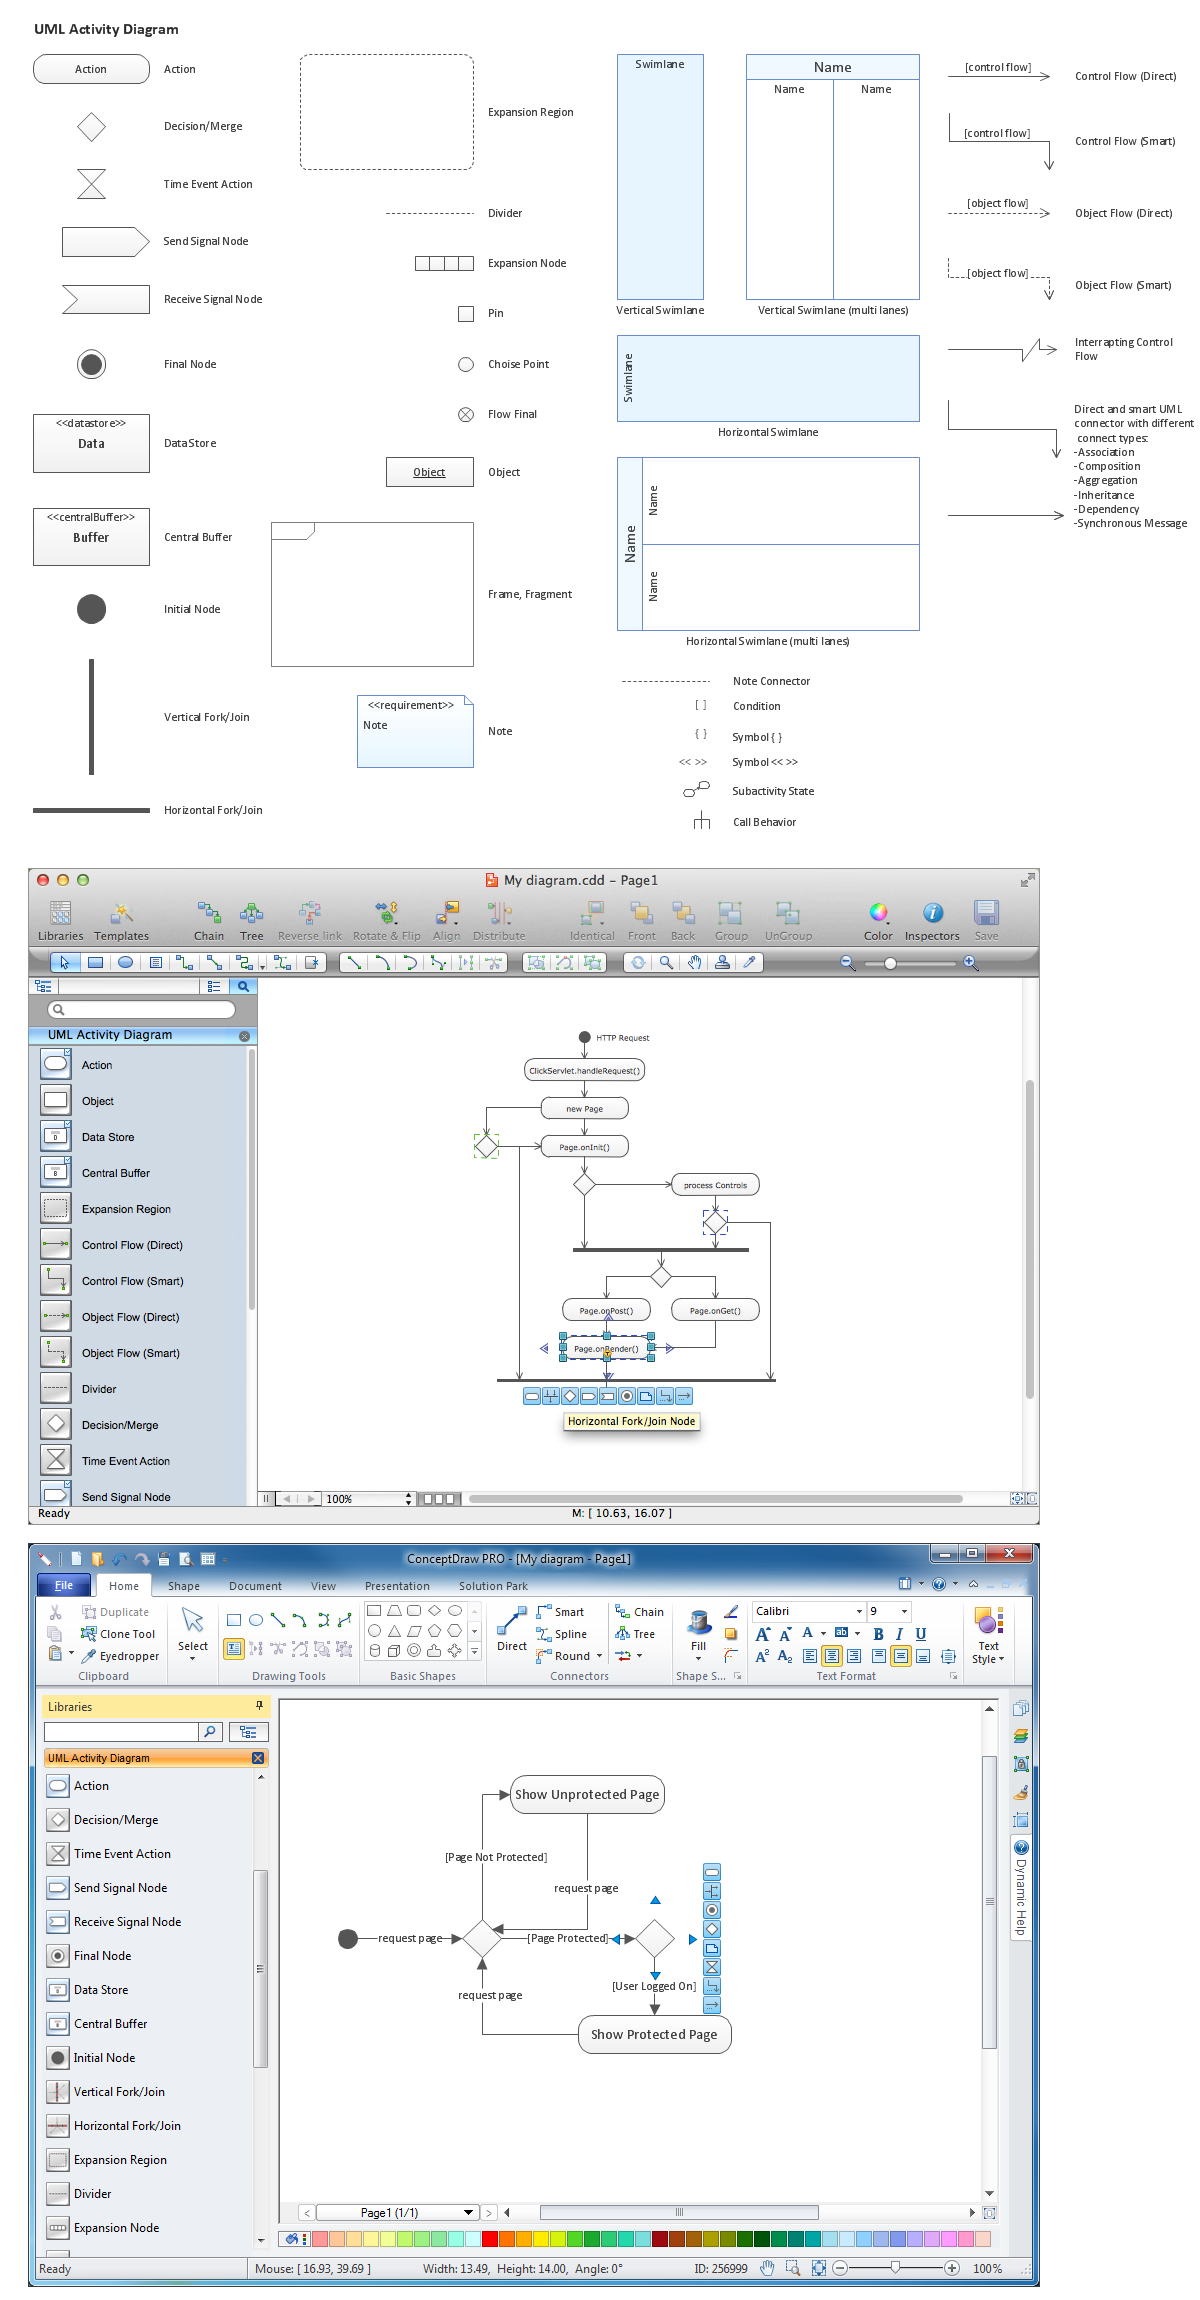
Picture: Diagramming Software for Design UML Activity Diagrams
As restaurant industry is growing rapidly nowadays, researches show that almost half of the adults have worked in a restaurant or a cafe. Moreover, many of them dream to start their own someday. Unfortunately, it takes a lot of time to write a business plan and to find a great location, although some know how to create a restaurant floor plan in minutes or how to plan budget effortlessly. Hiring employees can also cause a lot of headache, but this is crucial for further success, because every guest comes to restaurant for a good service and delicious food. It is also worth noting that restaurant concept is also important, because it defines target audience and influences the menu.
This diagram represents the floor plan of an ongoing sports-theme establishment - restaurant, cafe, or other food service. A number of widescreen monitors installed along the perimeter provide visitors the opportunity to follow the course of a match from anywhere in the dining room of restaurant or cafe. The most of sports fans believe that food and alcohol is a big part of any sports show. That is why the dining room takes the most space - almost 60% of the total establishment space. Nearly all sports fans consume beverages while watching sports - beer, soda or water at least. Thus, the restaurant floor plan designers added a large lavatory there. Moreover, project developers considered unnecessary the gender division of such delicate place - perhaps they guess that only men are watching football, or believe that alcohol will eliminate the most of gender differences.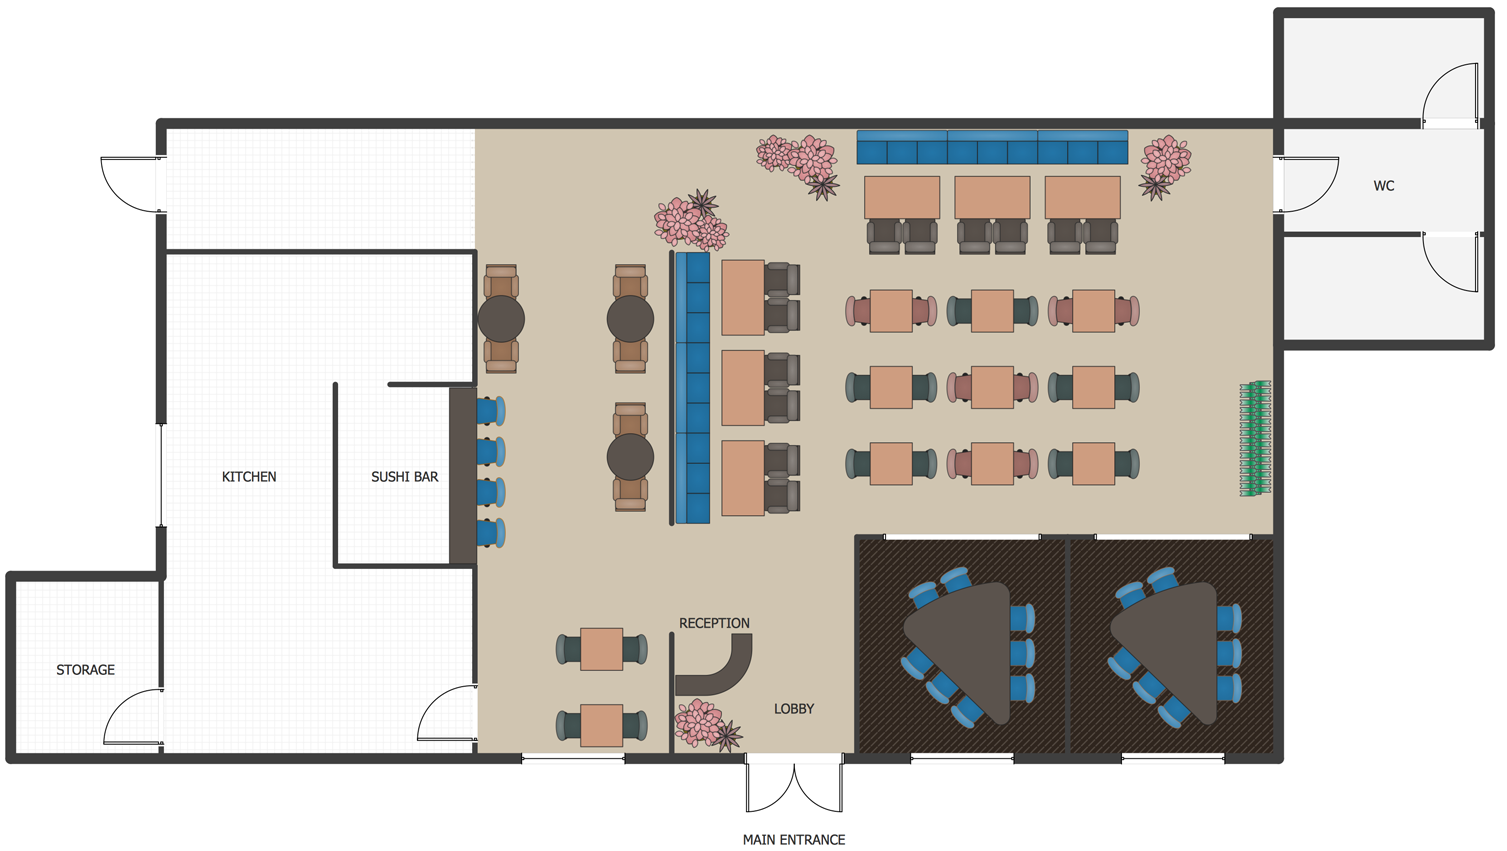
Picture: How To Create Restaurant Floor Plan in Minutes
Related Solution:
The Total Quality Management Diagram solution helps you and your organization visualize business and industrial processes. Create Total Quality Management diagrams for business process with ConceptDraw software.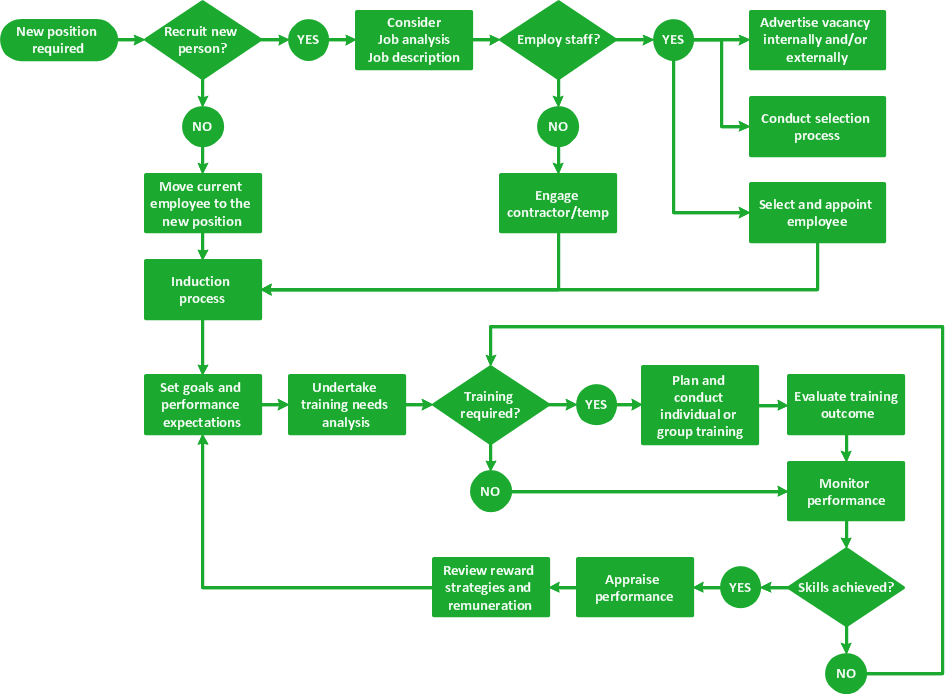
Picture: TQM Software — Build Professional TQM Diagrams
Related Solution:
Event-Driven Process chain Diagrams for improvement throughout an organisation. Best software for Process Flow Diagram. The Event-driven Process Chain (EPC) Diagrams allows managers to plan processes and resources.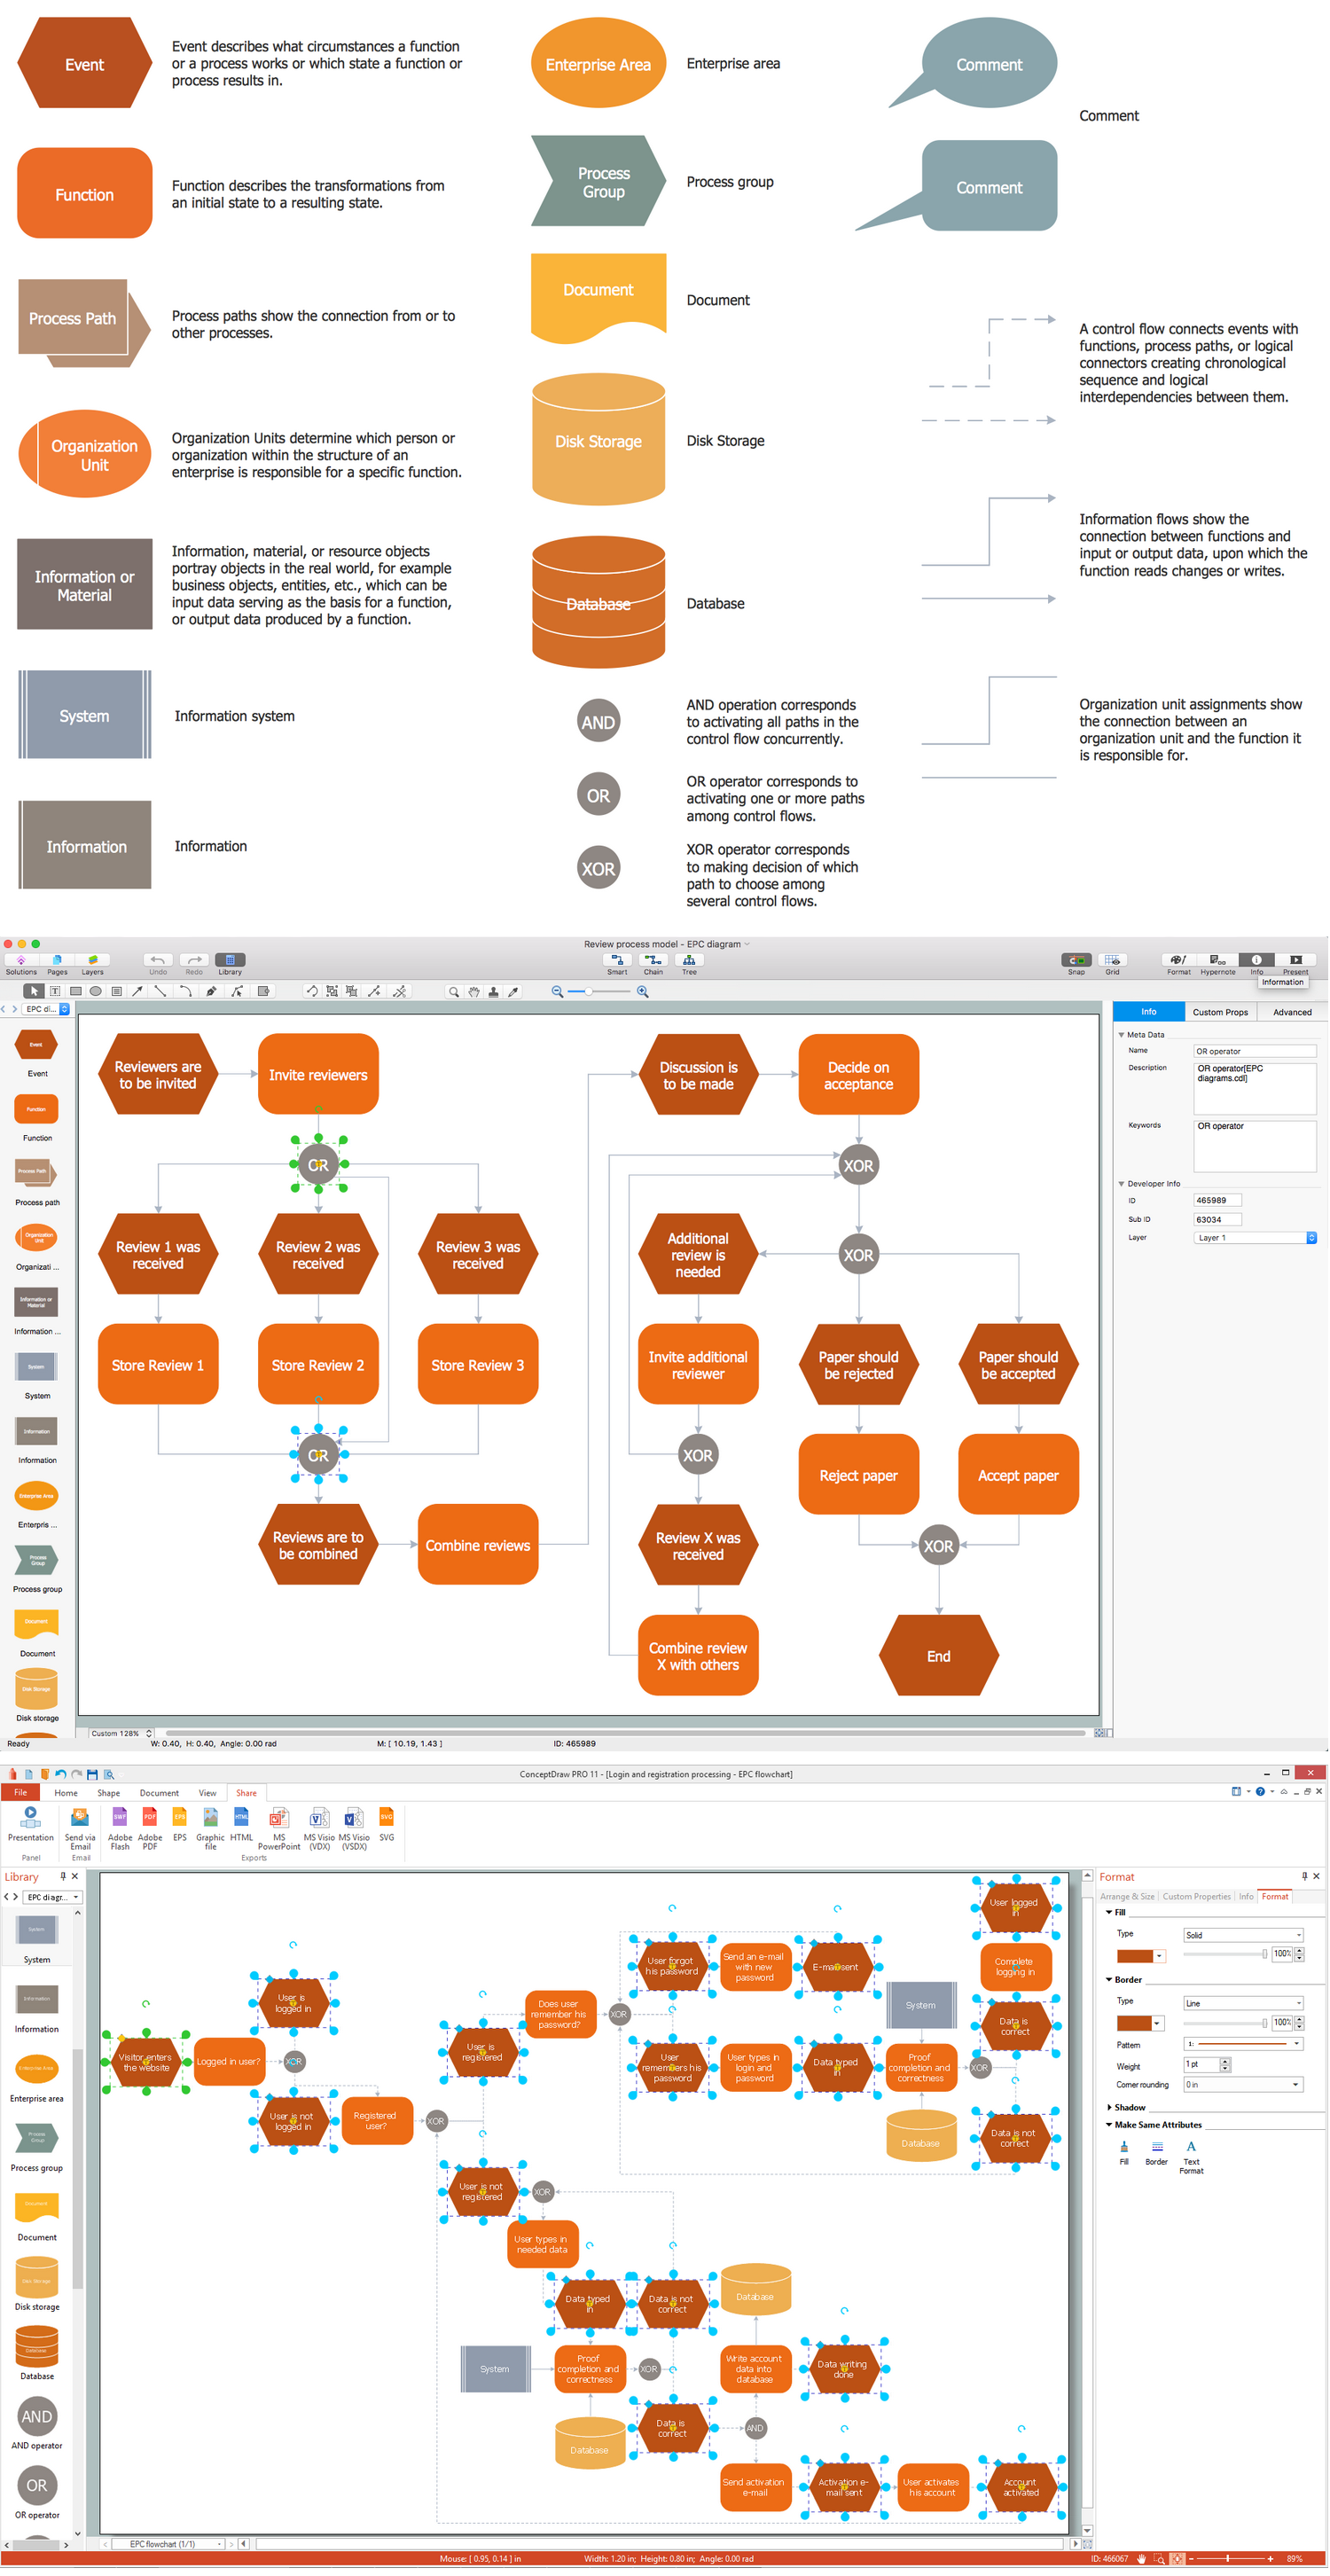
Picture: Business process Flow Chart — Event-Driven Process chain (EPC) diagrams
Related Solution:
ConceptDraw DIAGRAM is a business flowchart software includes the wide flowchart examples package.
Picture: Basic Flowchart Examples
Related Solution:
Diagramming is an astonishing way to visualize business processes. The list of the most common business process flowchart symbols is quite long starting from basic flowcharts, continuing with SIPOC diagrams. Business process modeling was never easier than now, with special ConceptDraw Business Process Mapping solution.
To carry out all professional standard requirements for business processes mapping, it is necessarily to follow the special graphical notations. ConceptDraw Business Process Mapping solution offers an exhaustive suite of tools to aid business process mapping. There are three vector libraries SIPOC Diagrams, Business Process Flowcharts, and Swim Lanes that contains totally more than 50 symbols of standard BPM notations. This is all that professionals need to effectively evaluate and manage quality in business processes.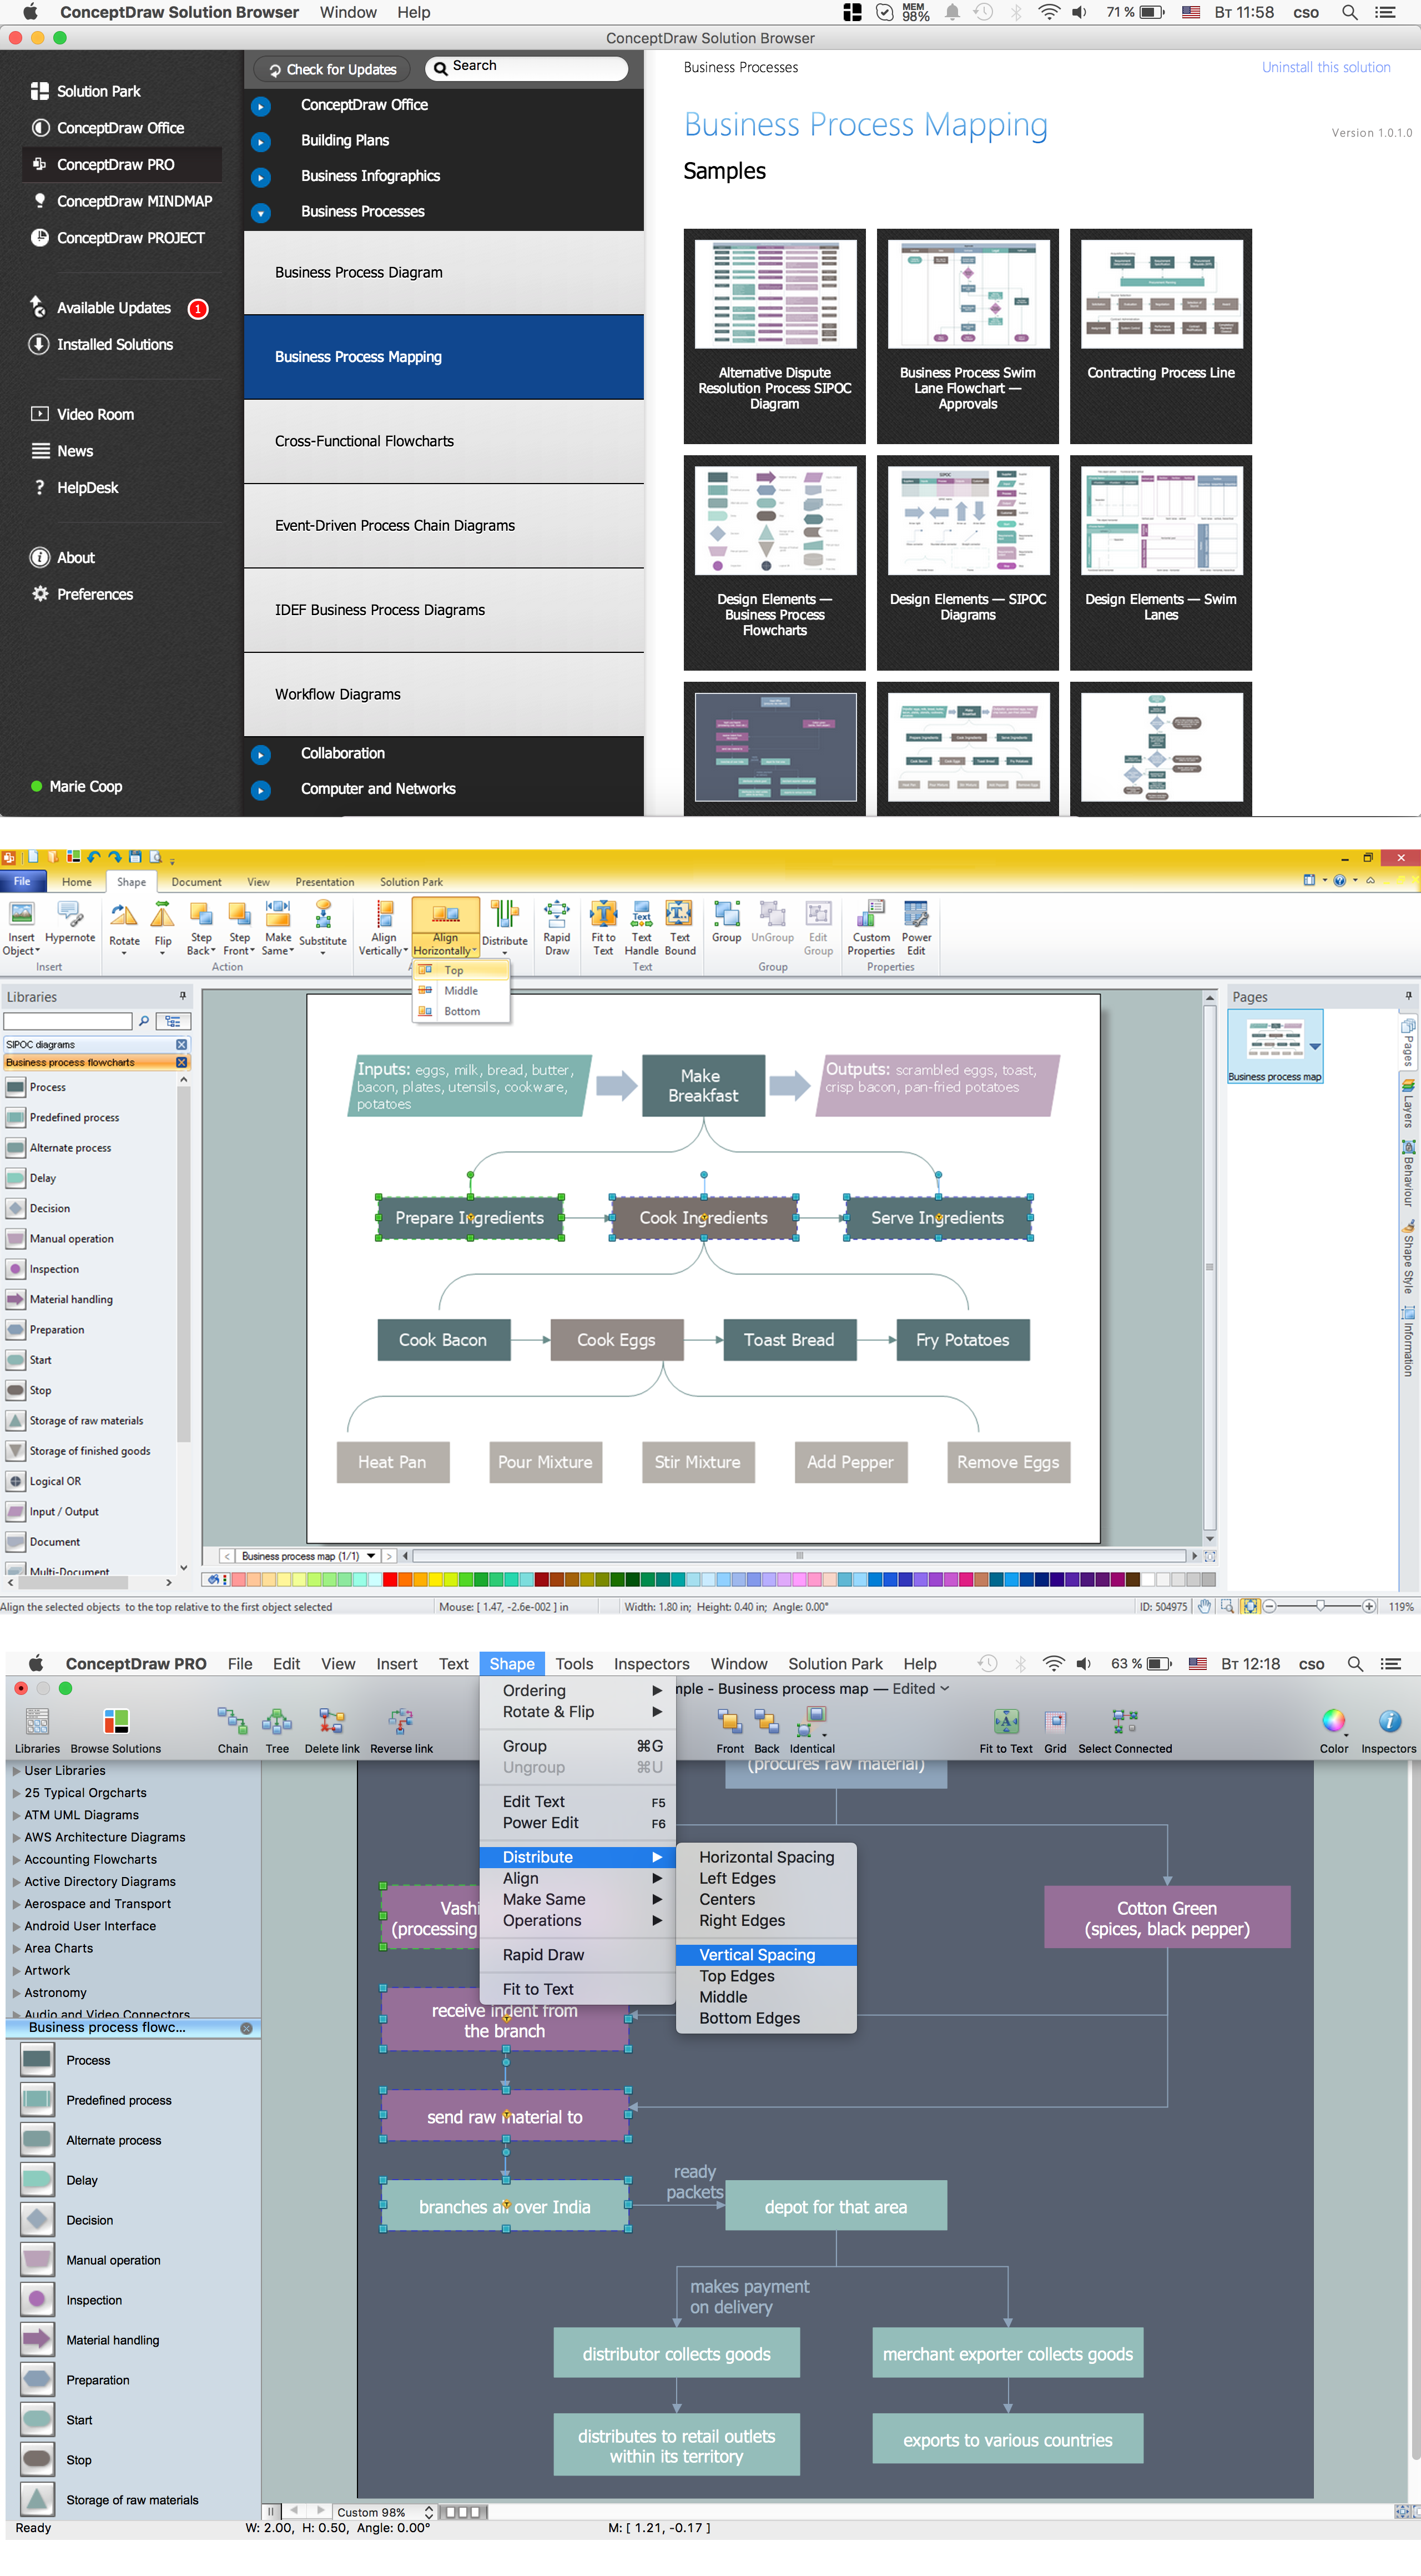
Picture: Business Process Flowchart Symbols
Related Solution:
Mathematical Drawing Software - Draw mathematical illustration diagrams easily from examples and templates!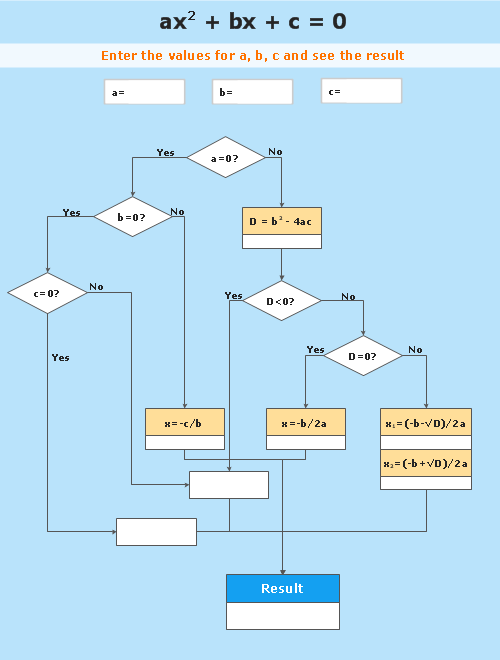
Picture: Basic Diagramming
Related Solution: