
Pic.1 Workflow diagram - Workflow Template.
The Workflow Diagrams solution extends ConceptDraw DIAGRAM software with samples, templates and library of vector stencils for drawing workflow diagrams. It represents the transferring of data, documents, and tasks during performance of a work process. Use workflow flowcharts to analyze the work processes, to show the path of the tasks, the responsible persons and the associated documents, to identify required resources, to optimize a workflow, and to discover its inherent weak points.
See also Samples:
TEN RELATED HOW TO's:
Working with information can be quite tedious, furthermore, some data can be quite difficult to perceive without any graphic representation. So, to facilitate your work, you can use business diagrams, such as simple flowcharts or Gantt charts for project management and orgcharts for clarifying your company structure. You can use a proper software, like ConceptDraw Pro, draw them on paper, or use whiteboards, but it is more convenient to use a digital tool.
This diagram shows a cross-functional flowchart that was made fore telecom service provider. A workflow of a common telecommunication service provider has a rather branched structure. Thus, it is useful to have a flow chart to visualize the sequences and interrelations of the work flow steps. Business process flowchart contains 17 processes and 4 decision points,that are distributed through 2 lines depicting the participants involved. Also there are connectors that show the data flow within processes. This flowchart displays a detailed model of the telecom service trading process, as well as all participants in the process and how they interact with each other.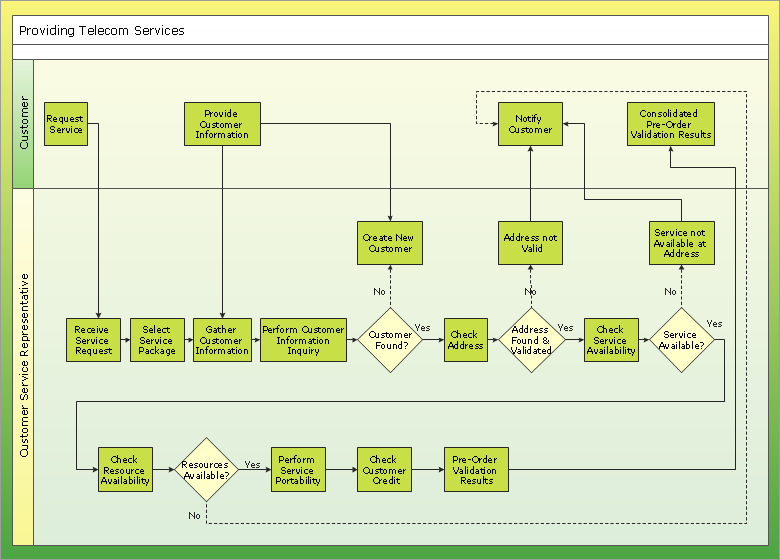
Picture: Business diagrams & Org Charts with ConceptDraw DIAGRAM
Create professional business process diagrams using ConceptDraw Activities library with 34 objects from BPMN.
Picture: Business Process Model and Notation Elements: Activities
A full-featured project management solution with all the necessary functions right at your fingertips. Generates an extensive variety of reports on project and task statuses.
These videos provide a series of lessons that will enhance the understanding of all our users, from people just starting out with the software, through to expert users.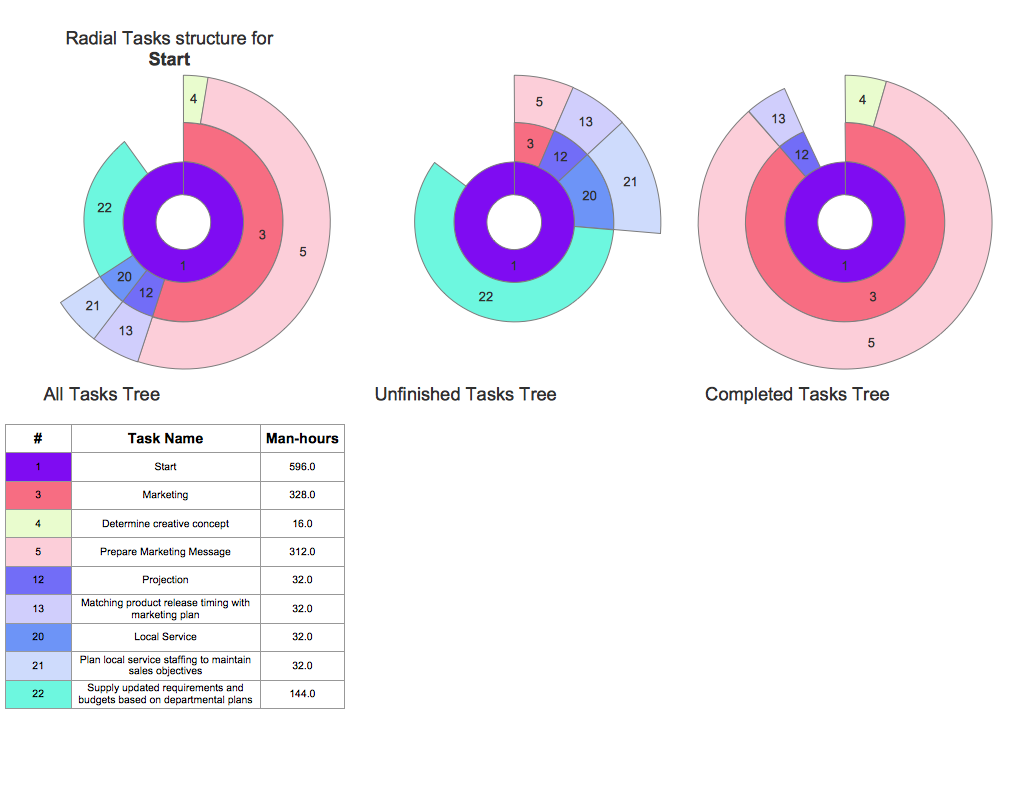
Picture: Project — Working With Tasks
Use ConceptDraw DIAGRAM software as a powerful audit application. 🔸 Create professional Audit Workflow Diagrams and Audit Process Flowcharts to ✔️ plan and implement audit process, ✔️ enhance financial transparency, ✔️ improve financial reporting, ✔️ streamline operations, ✔️ improve business efficiency, ✔️ identify risks and issues, ✔️ prevent financial fraud, ✔️ track progress, ✔️ enhance trust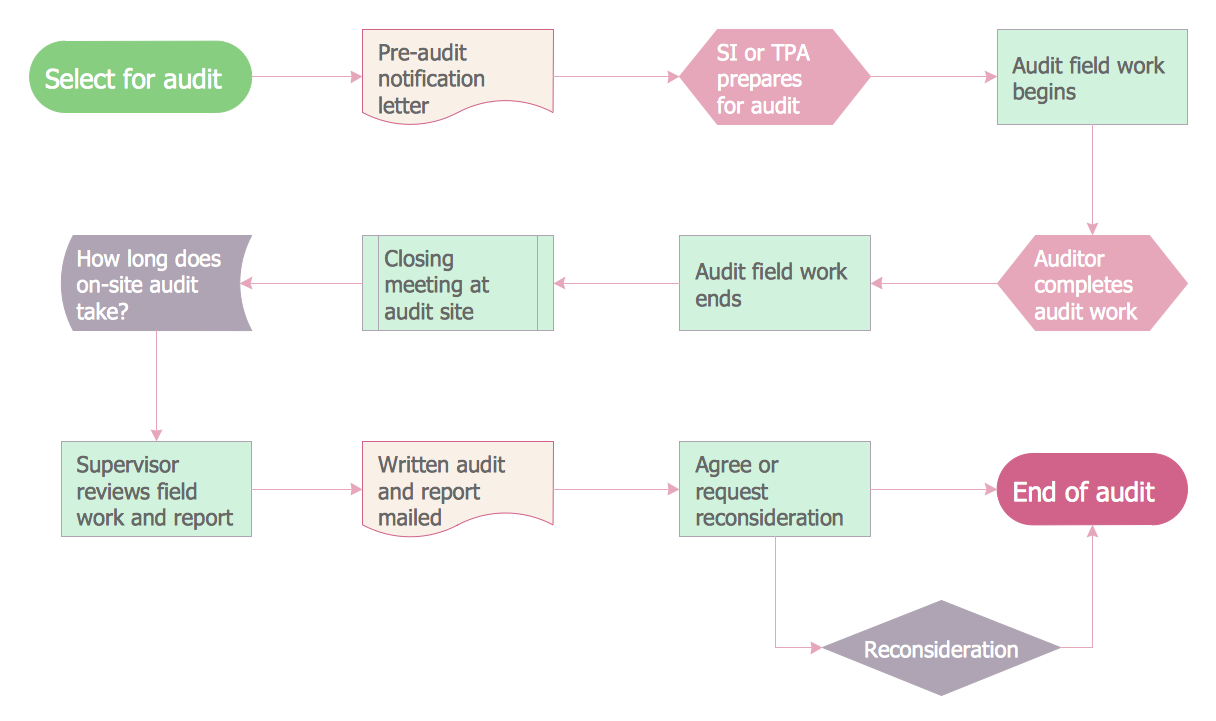
Picture: Understanding the Audit Process: A Comprehensive Guide. Audit Process Flowchart
Related Solution:
This method of problem analysis is widely used in IT, manufacture industries and chemical engineering. If you want to take a fresh look on your problem, you can draw a fishbone diagram with ConceptDraw DIAGRAM software, which supports both MAC OS and Windows. You can see and download fishbone diagram samples and templates in ConceptDraw Solution Park.
This Fishbone (Ishikawa) diagram can be applied as template for performing the cause and effect analysis of a service industry problems. It can help to determine factors causing problems. Causes in this diagram are categorized according to the 4S’s principle that means Surroundings, Suppliers, Systems and Skills. Grouping causes allows to reveal main interactions between different events. This diagram was made using ConceptDraw Fishbone diagrams solution. It can help to reveal the causes effected a complicated issue. Of course it can be used together with other methods of approaching to the problem solving.
Picture: Draw Fishbone Diagram on MAC Software
Related Solution:
ConceptDraw Network Diagram Software - Network design software for network drawings with abundant examples and templates.
Create computer network designs, diagrams and schematics using ConceptDraw.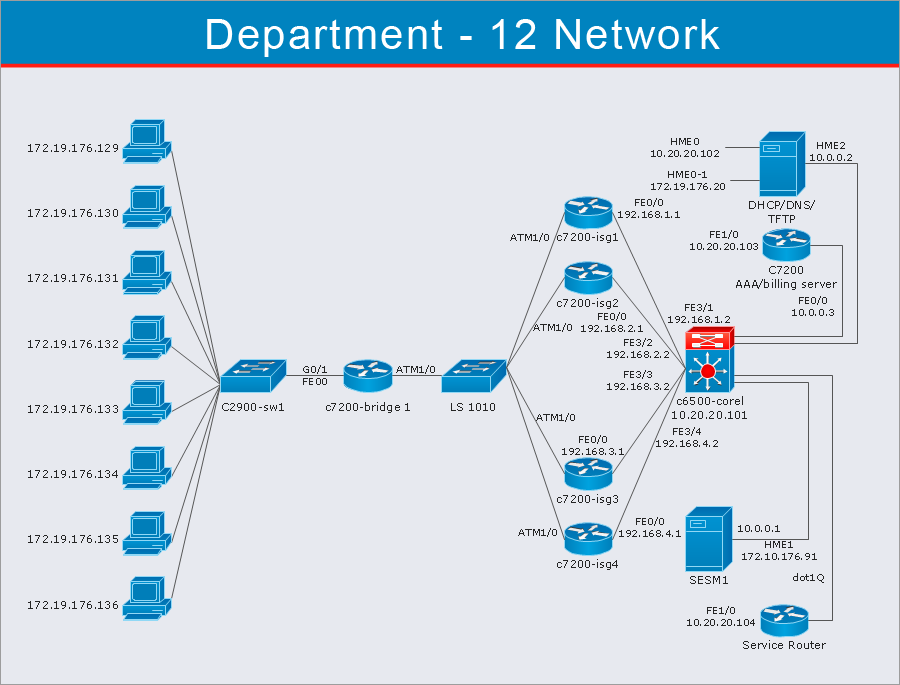
Picture: Network Diagram Software
Helps to create professionally looking and detailed Sales Flowcharts with all sales steps visually represented on them.
Use the Sales Flowcharts Solution for ConceptDraw DIAGRAM software to create your own Sales Flowcharts of any complexity quickly, easily and effectively to use them successfully in your work activity.
ConceptDraw DIAGRAM diagramming and vector drawing software supplied with unique Sales Flowcharts solution from the Marketing area of ConceptDraw Solution Park allows fast and easy visualize all sales steps of the sales process on a sales process Map or sales process flowchart, and then realize them easily.
Picture: Sales Steps
Related Solution:
Drawing of Family Emergency Plan is quite complex process. How can you make it? Usually you draw it accurately on the sheet of paper and this process takes much time. ConceptDraw DIAGRAM diagramming and vector drawing software offers you Fire and Emergency Plans Solution - the new method of quickly drawing Family Emergency Plan of any complexity.
Picture: Family Emergency Plan
Related Solution:
ConceptDraw DIAGRAM software supplied with HR Flowcharts Solution can effectively help in labour-intensive process of human resource development.
Picture: Human Resource Development
Related Solution:
Accounting is a powerful tool used for gaining quantitative information about the finances. The accounting process is a series of activities which begins with a transaction and ends with closing of books, and includes recording the income and expenditure of an organization.
ConceptDraw DIAGRAM diagramming and vector drawing software offers the Accounting Flowcharts Solution from the Finance and Accounting Area of ConceptDraw Solution Park which is perfect for accounting process visualization and for creation Accounting Process Flowcharts.
Picture: Accounting Process
Related Solution: