Business Structure
Each business is created, exists and develops according to its type of business structure. Creating new business or developing existing, you may need a powerful software for representing its business structure. In this case ConceptDraw DIAGRAM diagramming and vector drawing software extended with 25 Typical Orgcharts solution from the Management area is exactly what you need.

Example 1. Business Structure - Software Company Org Chart
25 Typical Orgcharts Solution includes 25 templates:
- Flat Org Chart templates,
- Hierarchical Org Chart templates,
- Matrix Org Chart templates.
Not depending which business structure you have, you will surely find among them a suitable template to depict it.

Example 2. Organizational Chart Library - Design Elements
25 Typical Orgcharts Solution provides also 2 libraries with ready-to-use 40 vector graphics and icons:
- Organizational Chart library
- Organizational Chart (people) library
 Library - Design Elements")
Example 3. Organizational Chart (people) Library - Design Elements
Use all these tools for developing, design and realization the Business Structure of any complexity without efforts!

Example 4. Hierarchical Org Chart Template
This template is one of 25 templates included in paid add-on 25 Typical Orgcharts Solution for ConceptDraw DIAGRAM Solution Park. It is convenient for using as the base for Business Structure Chart design.
Use the 25 Typical Orgcharts Solution for ConceptDraw DIAGRAM software to create your own professional looking Business Organization Chart of any complexity quick, easy and effective.
All source documents are vector graphic documents. They are available for reviewing, modifying, or converting to a variety of formats (PDF file, MS PowerPoint, MS Visio, and many other graphic formats) from the ConceptDraw STORE. The 25 Typical Orgcharts Solution is available for all ConceptDraw DIAGRAM users.
TEN RELATED HOW TO's:
One of the most visible trends in today's information technology (IT) industry is the placement of databases to the cloud. Microsoft Azure is one of such useful cloud services which is quite popular among applications developers and offers them extensive and effective Azure management tools.
ConceptDraw DIAGRAM diagramming and vector drawing software enhanced with Azure Architecture Solution from the Computer and Networks area of ConceptDraw Solution Park offers all needed tools for designing Azure management illustrations and Azure Architecture Diagrams.
Picture: Azure Management
Related Solution:
ConceptDraw DIAGRAM diagramming and vector drawing software extended with Cisco Network Diagrams Solution from the Computer and Networks Area is the best for creating Cisco Network Diagrams thanks to numerous predesigned Cisco network icons.
Picture: Cisco Network Icons
Related Solution:
Communication is the main challenge and the key success factor for organizational project management in company with remote projects. Communicating visually via Skype you bring all projects together to achieve corporate goals.
Picture: Remote Projects in Corporate Strategy
Related Solution:
Sometimes it's difficult to find a path in work processes or to understand the requirements, especially when you are a newcomer. To get your thoughts straight, create a workflow diagram, and put everything on it. This will not only help you to get into the workflow, but also show it’s weaknesses.
This illustration captures the workflow process of payment an invoice for the electricity consumed by certain enterprise. It was drawn in ConceptDraw DIAGRAM using its solution for Workflow Diagrams. Making a workflow charts means that you need to depict consistently all processes engaged to the workflow process. Then, you should connect them with symbols meaning study and analysis. Next, add symbols of decisions. A work flow diagram made precisely and correctly can help to clarify your work flow to any person.
Picture: Workflow Diagram
Related Solution:
ConceptDraw DIAGRAM software enhanced with Organizational charts solution is an essential tool to ✔️ show the internal structure of an organization, ✔️ outline the hierarchy, ✔️ display key roles or job titles, ✔️ show relationships among employees or departments, ✔️ facilitate communication and cooperation, ✔️ visualize reporting relationships
Picture: Organization Chart Software: A Comprehensive Guide
Related Solution:
Venn diagrams are illustrations used in the branch of mathematics known as set theory.
Use ConceptDraw DIAGRAM to quick and easy design your own Venn Diagram of any complexity.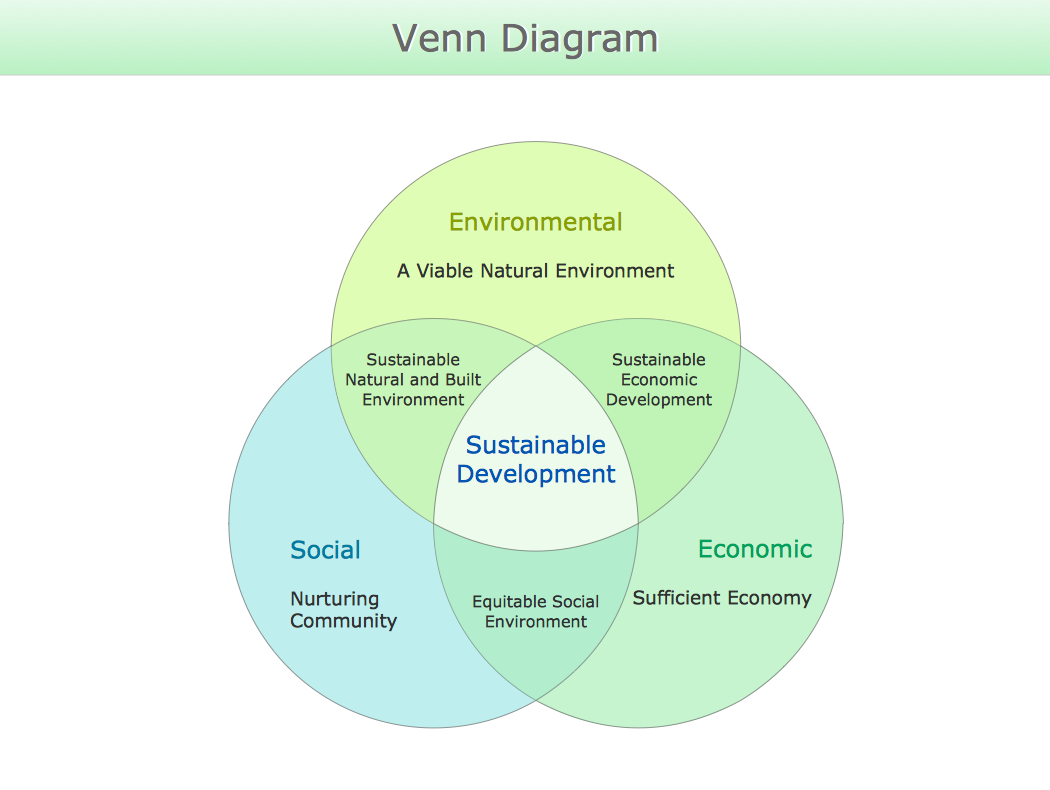
Picture: Venn Diagram
Related Solution:
The Sales Process is a complex approach for selling a product or service which assumes many steps including the sales planning, realization of the sales marketing and management strategies, sales process analysis, etc. Now we have a ConceptDraw DIAGRAM software extended with unique Sales Flowcharts solution from the Marketing area of ConceptDraw Solution Park which ideally suits for the planning and realization the company's sales process.
Picture: The Sales Process
Related Solution:
ConceptDraw DIAGRAM software extended with unique HR Flowcharts Solution is the best for designing various flowcharts and diagrams in the field of human resources management.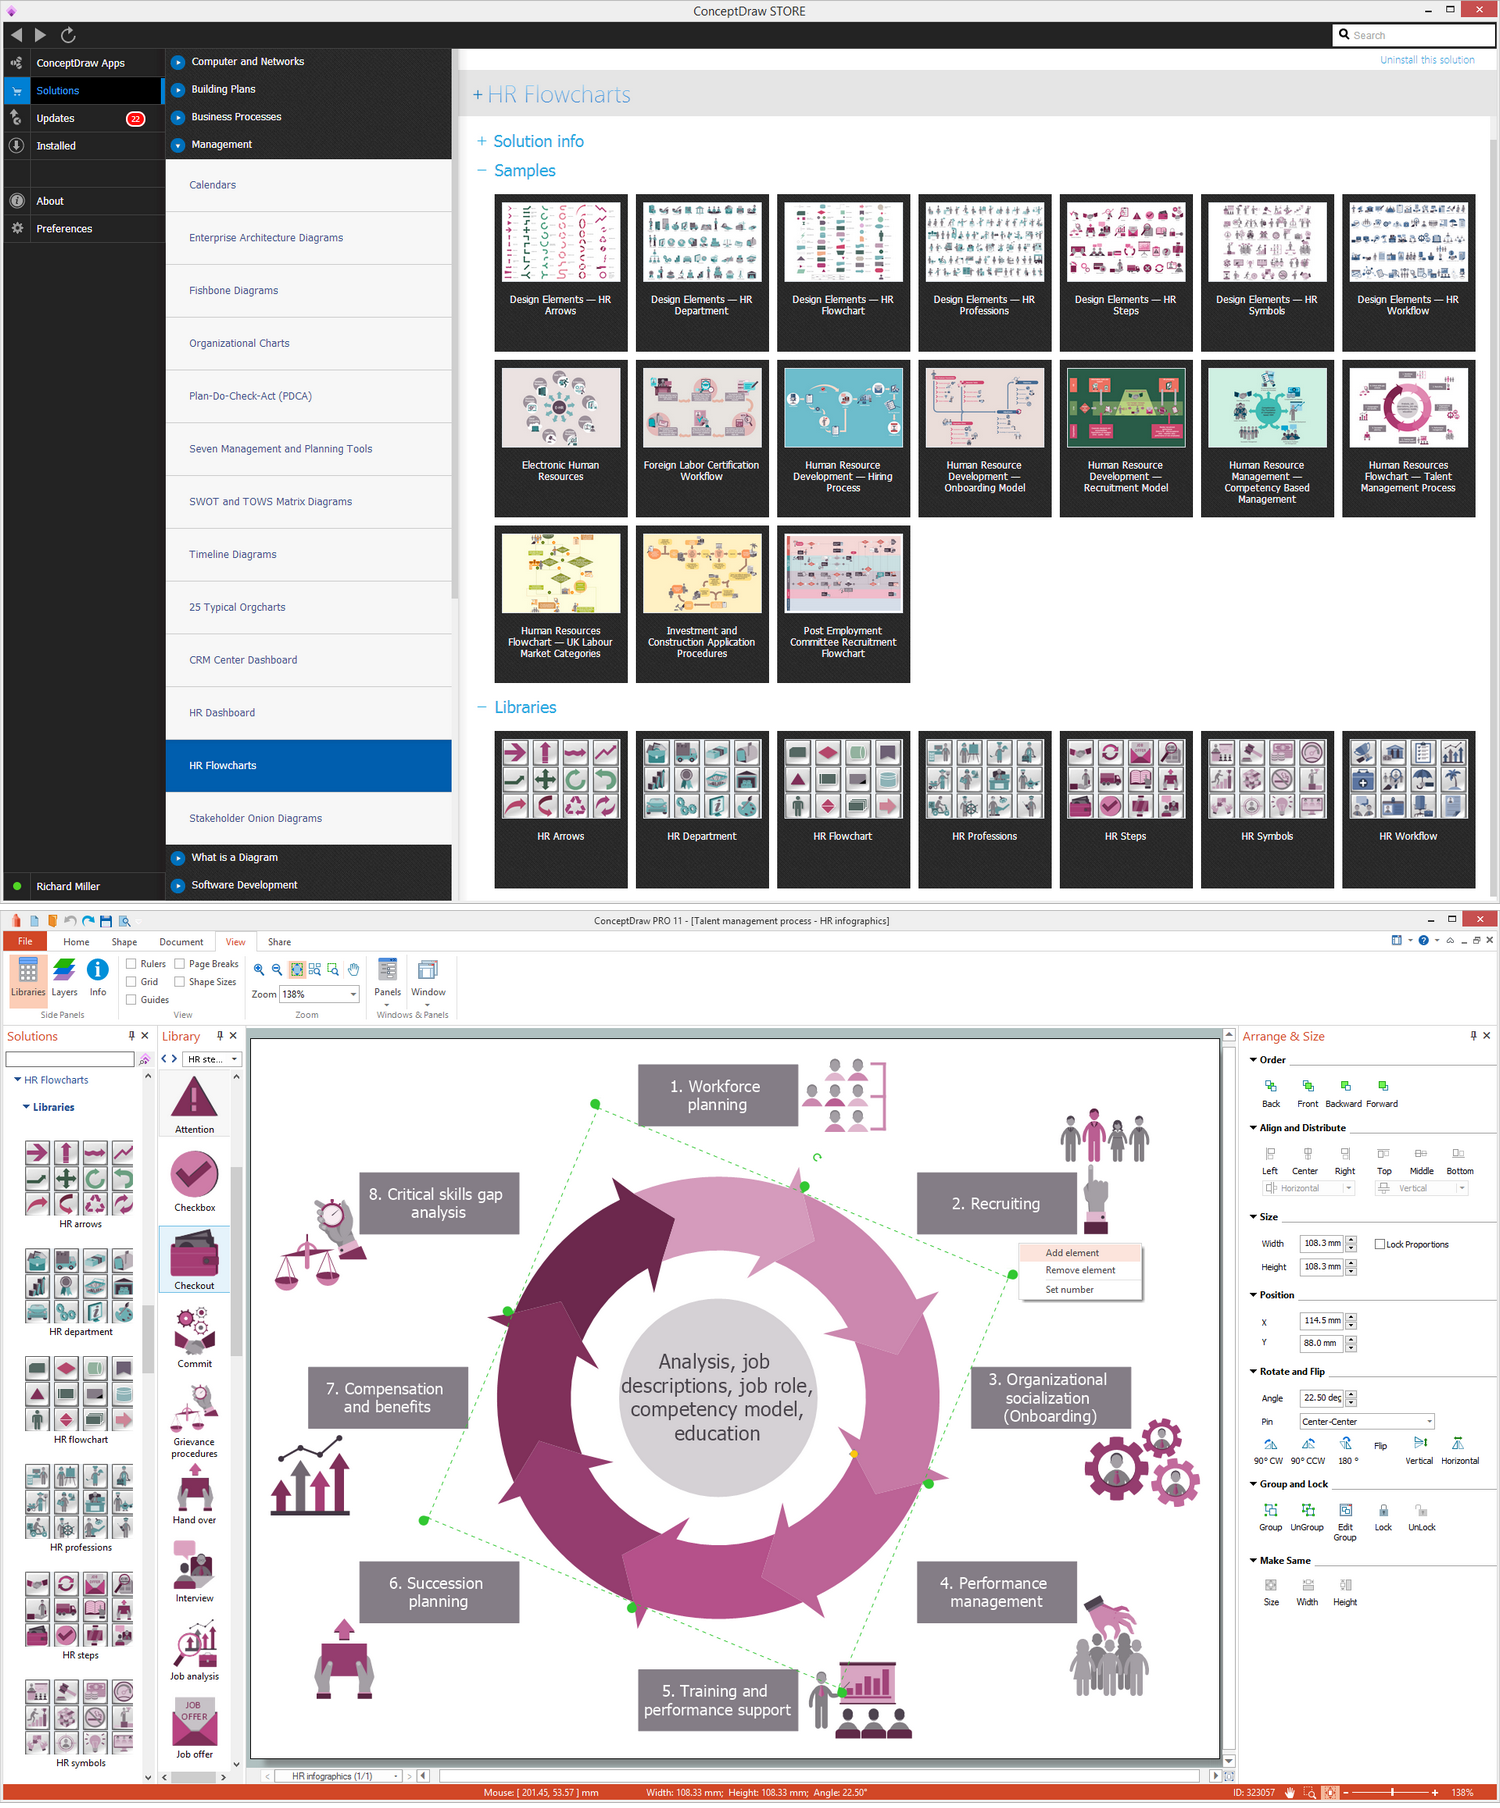
Picture: Human Resources
Related Solution:

 Library - Design Elements")
