Business Tools Perceptual Mapping
Perception Mapping helps organizations measure and transform all aspects of their business, people and culture. Perception Mapping allows to represent the complex relationships graphically, helps identify potential problems of the organization and make the best decisions.
The perception maps are widely used in marketing strategy and market analysis, in analytics. The perception maps are used for developing the market positioning strategy for product or service. They measure the factors that consumers use when make the purchase decisions. On the perception map the position of the product or company is displayed relative to their competition.

Sample 1. Perceptual map.
This sample shows the Perceptual map. It was created in ConceptDraw DIAGRAM diagramming and vector drawing software using the Matrices Solution from the Marketing area of ConceptDraw Solution Park.
Use the ready-to-use objects, templates and samples from the Matrices Solution for ConceptDraw DIAGRAM to create your own Perceptual maps of any complexity quick and easy.
The Perceptual maps created with ConceptDraw DIAGRAM are vector graphic documents and are available for reviewing, modifying, and converting to a variety of formats (image, HTML, PDF file, MS PowerPoint Presentation, Adobe Flash or MS Visio).
TEN RELATED HOW TO's:
Successful quality management implemented in a company of any size is a critical component of a company organization.
Picture: What is a Quality Management
Related Solution:
ConceptDraw PROJECT is an effective tool for new and experienced users with a fine balance of usability and powerful functionality.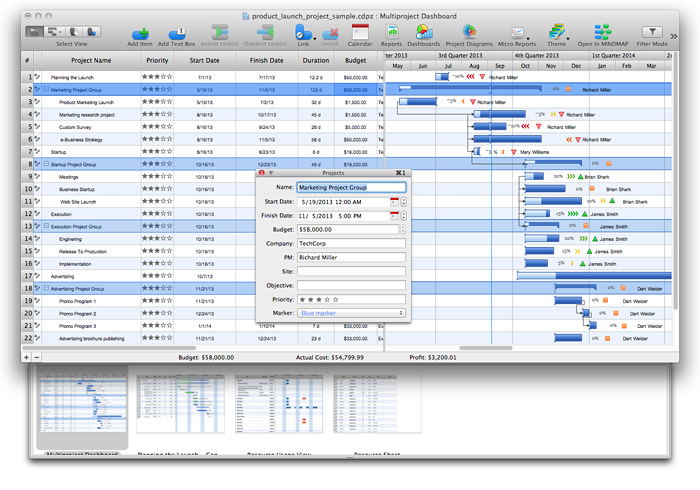
Picture: ConceptDraw PROJECT Software Overview
Do you need to draw a check order process flowchart?
Use the intuitive product - ConceptDraw.
Picture: Check Order Process Flowchart. Flowchart Examples
Related Solution:
A competent delegation of responsibilities between workers guarantees business success in most cases. At first sight, it might seem that workflow diagram symbols are quite similar to a regular flowchart. But workflow diagram is a more accurate way to present working processes.
Workflow diagrams are helpful for a working process analyzation, to depict a pathway of process issues, personalize responsibilities and identify resources that will help to optimize a workflow. Generally, Workflow diagram deploys flowchart symbols for displaying work process steps and relationships. But, often it require some additions and improvements to become more professional and illustrative. The Workflow solution for ConceptDraw DIAGRAM provides the user with a big library of symbols that are designed especially for workflow diagrams.
Picture: Workflow Diagram Symbols
Related Solution:
ConceptDraw DIAGRAM diagramming and vector drawing software extended with Seven Basic Tools of Quality solution from the Quality area of ConceptDraw Solution Park provides effective tools for quality control and helps design any types of quality-related diagrams.
Picture: Seven Basic Tools of Quality — Quality Control
Related Solution:
Many professionals have to solve problems every day. Designing of the process algorithm contribute to understand where the problem is in the process. A Flowchart is a graphical tool that most usable for breaking down processes.
Definition of flowchart - a diagram that shows step-by-step progression through a procedure or system especially using connecting lines and a set of conventional symbols.
All the icons, symbols and connectors needed for creating standardized notation flowcharts are contained within Software Flow Chart.
Picture: Software Flow Chart
Related Solution:
House of Quality Matrix Software - Use the predesigned objects from the Involvement Matrix Objects Library from the Seven Management and Planning Tools Solution to create professional looking House of Quality Matrices in minutes.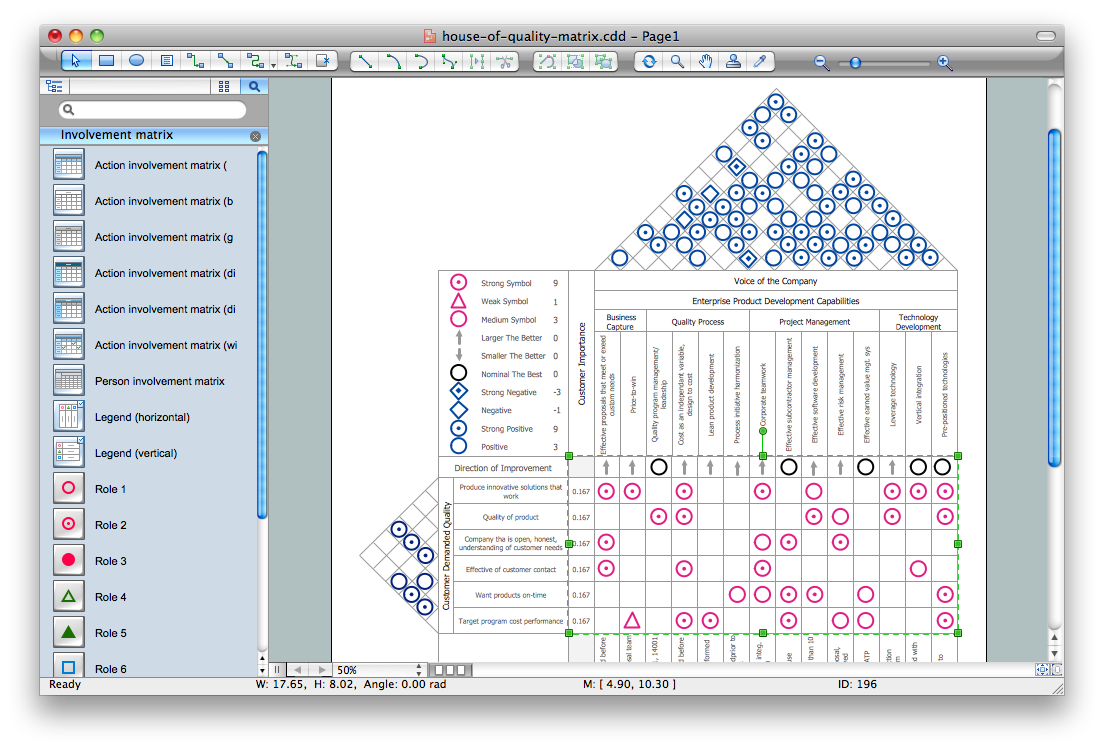
Picture: House of Quality Matrix Software
Related Solution:
This sample shows the UML Class Diagram of delivery system. On this diagram you can see the classes that are connected with aggregation and composition associations indicated with the multiplicity. This sample can be used by delivery services, postal services.
Picture: UML Diagram for System
Related Solution:
ConceptDraw DIAGRAM is the best Value Stream Mapping software. The graphical representation of a process is a powerful tool. It helps in the diagnosis of process efficiency and allows companies to develop improved processes.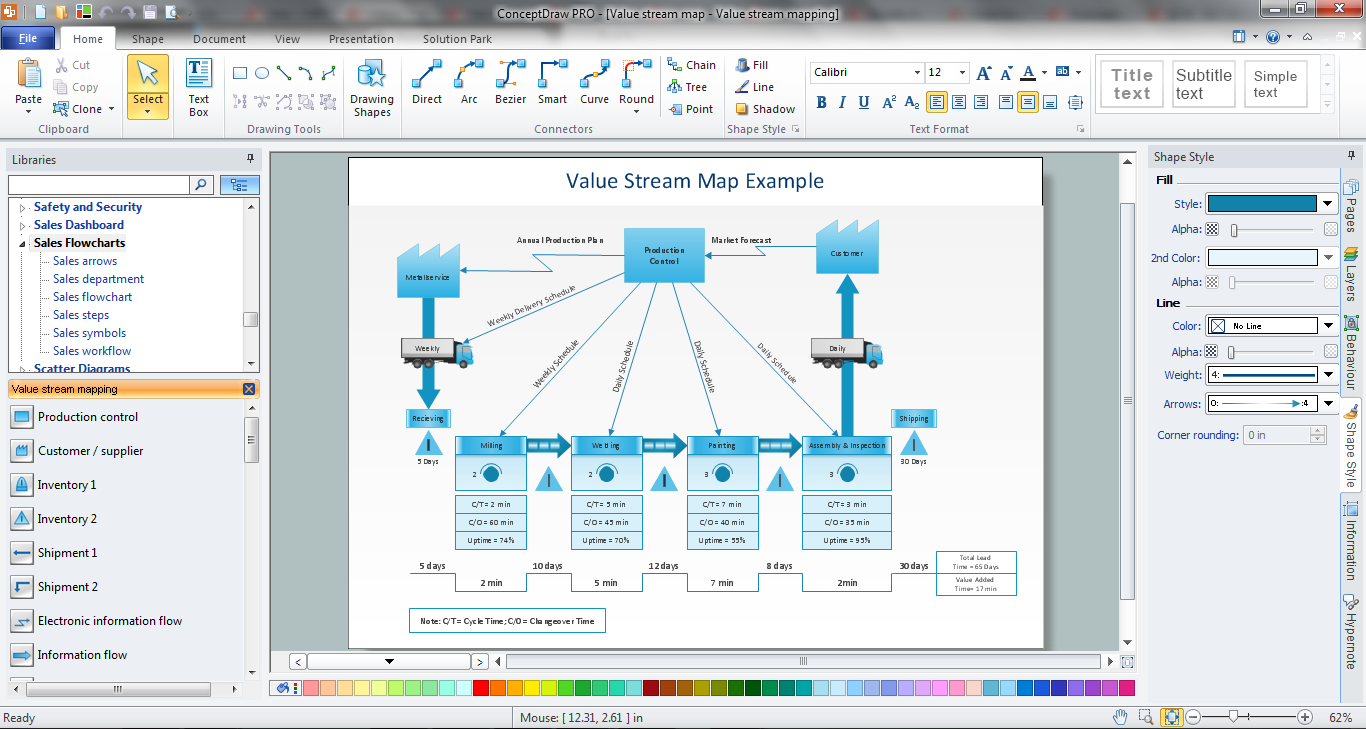
Picture: Value Stream Mapping Software
Related Solution:
Describing the way data flows through an information system might become a subject of a study. One of the kinds on a data flow diagram is called Gane Sarson Diagram after its authors, and it slightly differs from other notations. Process symbols in this notation are depicted as rounded rectangles connected with arrows representing data flows.
This is a sample of data flow diagram. It demonstrates utilization of the Gane-Sarson notation for making DFD on the example of an online appointment system of the Health Centre. This sample is used the vector objects library of Gane-Sarson DFD notation supplied by the ConceptDraw solution for data flow diagramming. It contains all symbols of the Gane-Sarson notation including connectors, jumps, and processes. This solution can be successfully utilized to generate DFDs for business documentation, and presentations.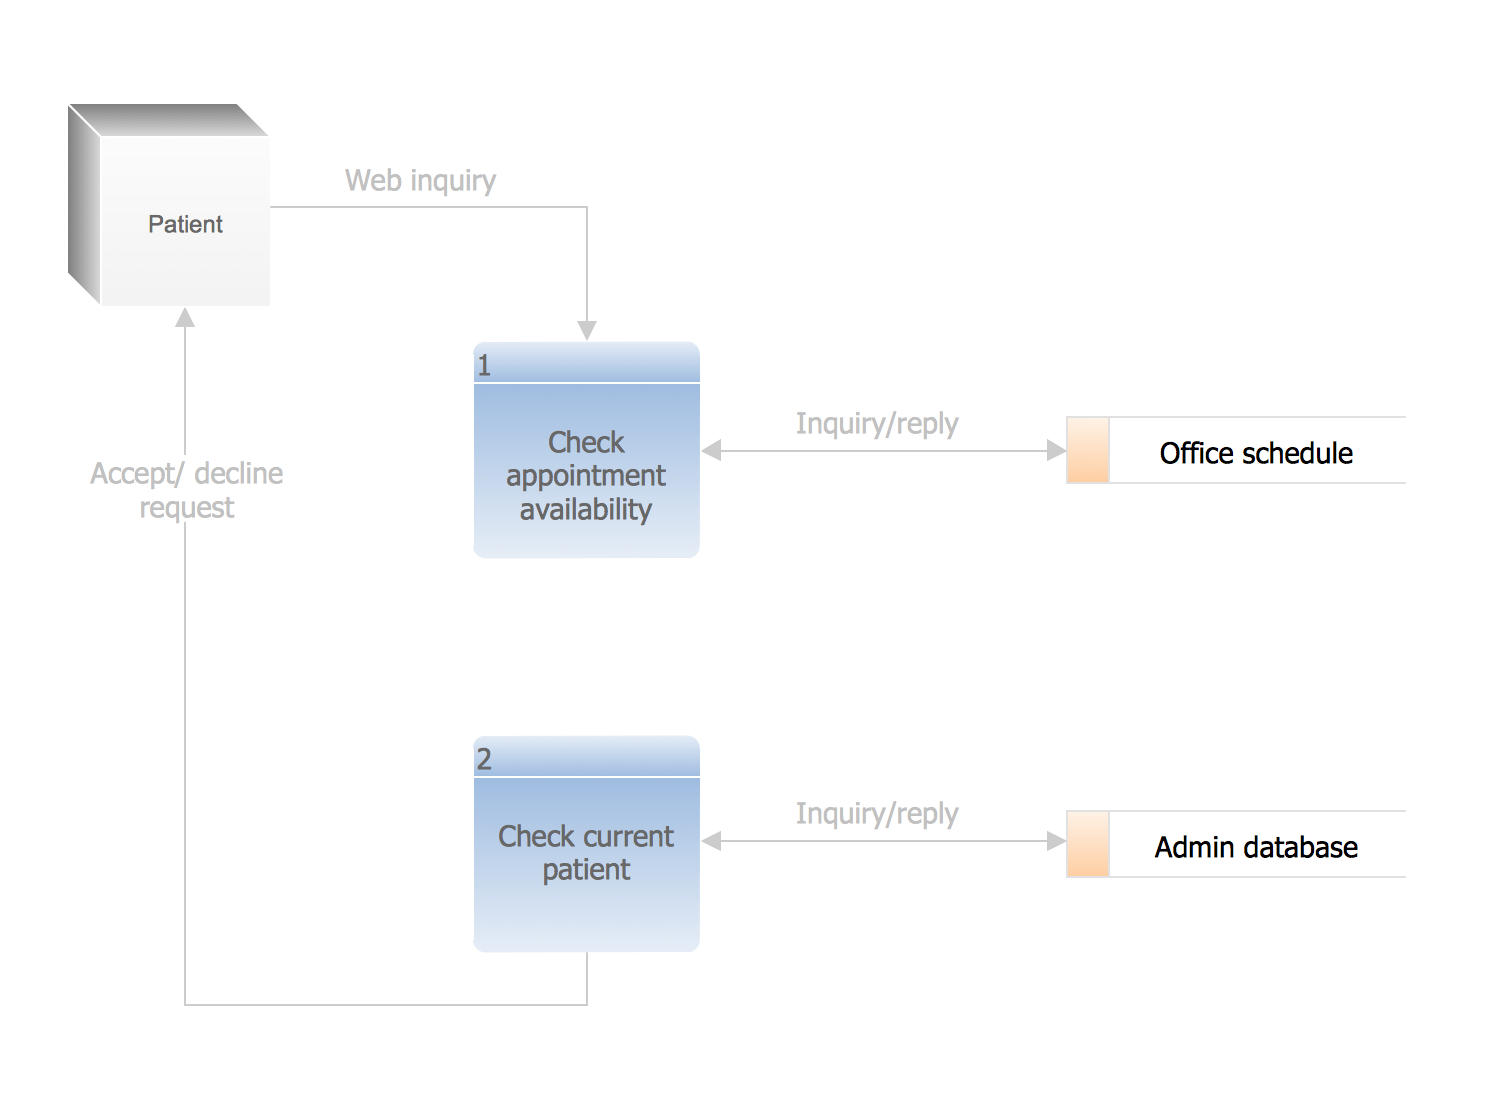
Picture: Gane Sarson Diagram