Cause and Effect Analysis
When you have some problems you need first to explore the reasons which caused them. Cause and Effect Analysis is a perfect way to do this. It is a diagram-based methodology developed by Kaoru Ishikawa in 1960s as a quality control tool. This methodic connects Brainstorming with a Mind Mapping, it lets to identify all possible causes of a problem, define bottlenecks and represent all this on the Ishikawa (Fishbone) diagram which looks like the fish skeleton.
ConceptDraw DIAGRAM software enhanced with Fishbone Diagrams solution from the Management area of ConceptDraw Solution Park gives the ability to draw fast and easy Fishbone diagram that identifies many possible causes for an effect. Causes can be derived from brainstorming sessions, further they are often categorized and can show relationships among various factors. Causes are usually grouped into major categories to identify the sources of variation.

Example 1. Cause and Effect Analysis
Fishbone Diagrams Solution extends ConceptDraw DIAGRAM ector graphics and diagramming software with the ability to visualize cause and effect analysis thanks to the Fishbone Diagrams library with numerous ready-to-use vector objects.

Example 2. Fishbone Diagrams Library Design Elements
Fishbone Diagrams Solution provides also collection of different Fishbone Diagram samples and quick-start templates. All they are available for viewing and editing from ConceptDraw STORE.

Example 3. Fishbone Diagram - Inability to Meet Project Deadlines
The samples you see on this page were created in ConceptDraw DIAGRAM using the tools of the Fishbone Diagrams Solution. An experienced user spent 10 minutes creating each of these samples.
Use the Fishbone Diagrams Solution for ConceptDraw DIAGRAM Solution Park for easy and effective cause and effect analysis.
All source documents are vector graphic documents. They are available for reviewing, modifying, or converting to a variety of formats (PDF file, MS PowerPoint, MS Visio, and many other graphic formats) from the ConceptDraw STORE. The Fishbone Diagrams Solution is available for all ConceptDraw DIAGRAM or later users.
FIVE RELATED HOW TO's:
The Value Stream Map is one of the key tools of lean practitioners. It helps aptly describe the manufacturing processes both complex and simple. It supports process improvement, allows identifying waste, and reducing process cycle times. Use ConceptDraw DIAGRAM extended with Value Stream Mapping solution to document processes starting with a professionally designed Value Stream Mapping template.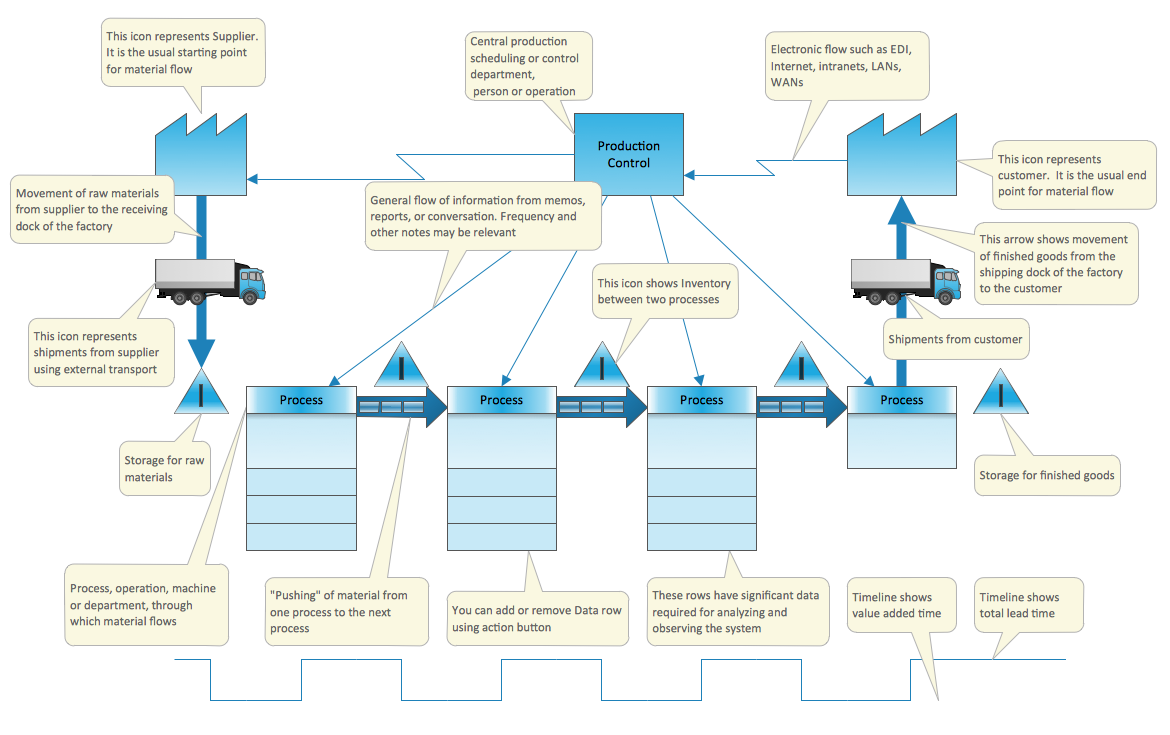
Picture: Value Stream Mapping Template
Related Solution:
Problems are obstacles and challenges that one should overcome to reach the goal. They are an inseparable part of any business, and the success of an enterprise often depends on ability to solve all problems effectively. The process of problem solving often uses rational approach, helping to find a suitable solution.
Using Fishbone Diagrams for Problem Solving is a productive and illustrative tool to identify the most important factors causing the trouble. ConceptDraw DIAGRAM extended with Fishbone Diagrams solution from the Management area of ConceptDraw Solution Park is a powerful tool for problem solving with Fishbone Ishikawa diagram graphic method.
Picture: Using Fishbone Diagrams for Problem Solving
Related Solution:
Fishbone diagram is a powerful tool used for solving business problems and obstacles. ConceptDraw DIAGRAM software extended with Fishbone Diagrams solution from the Management area of ConceptDraw Solution Park is a helpful tool for cause and effect analysis. It gives the ability to easy identify many possible causes and factors which cause the effects and to draw Fishbone Diagrams for problem solving.
Picture: Cause and Effect Analysis - Fishbone Diagrams for Problem Solving
Related Solution:
The Cause and Effect diagram introduced by Kaoru Ishikawa in 1968 is a method for analyzing process dispersion. It can help you to dive into a problem and find an effective solution, identify and represent the possible causes for an effect, analyze the complex business problems and successfully solve them.
You can design your Cause and Effect diagram on a paper, but more effective way is to use specific software - ConceptDraw DIAGRAM is a powerful Cause and Effect Diagram Software. It helps you create Cause and Effect diagram known also as Fishbone diagram or Ishikawa diagram from templates and examples.
Picture: Cause and Effect Diagram Software
Related Solution:
When trying to figure out the nature of the problems occurring within a project, there are many ways to develop such understanding. One of the most common ways to document processes for further improvement is to draw a process flowchart, which depicts the activities of the process arranged in sequential order — this is business process management. ConceptDraw DIAGRAM is business process mapping software with impressive range of productivity features for business process management and classic project management. This business process management software is helpful for many purposes from different payment processes, or manufacturing processes to chemical processes. Business process mapping flowcharts helps clarify the actual workflow of different people engaged in the same process. This samples were made with ConceptDraw DIAGRAM — business process mapping software for flowcharting and used as classic visio alternative because its briefly named "visio for mac" and for windows, this sort of software named the business process management tools.
This flowchart diagram shows a process flow of project management. The diagram that is presented here depicts the project life cycle that is basic for the most of project management methods. Breaking a project into phases allows to track it in the proper manner. Through separation on phases, the total workflow of a project is divided into some foreseeable components, thus making it easier to follow the project status. A project life cycle commonly includes: initiation, definition, design, development and implementation phases. Distinguished method to show parallel and interdependent processes, as well as project life cycle relationships. A flowchart diagram is often used as visual guide to project. For instance, it used by marketing project management software for visualizing stages of marketing activities or as project management workflow tools. Created with ConceptDraw DIAGRAM — business process mapping software which is flowcharting visio alternative or shortly its visio for mac, this sort of software platform often named the business process management tools.
Picture: Process Flowchart
Related Solution:

