Cause and Effect Diagram
ConceptDraw DIAGRAM software extended with Fishbone Diagrams solution from the Management area of ConceptDraw Solution Park is perfect for Cause and Effect Diagram creating. It gives the ability to draw fishbone diagram that identifies many possible causes for an effect or a problem.
Causes and Effects are usually grouped into major categories to identify these sources of variation. Causes and Effects in the diagram show relationships among various factor. Fishbone diagram shows factors of Equipment, Process, People, Materials, Environment and Management, all affecting the overall problem.
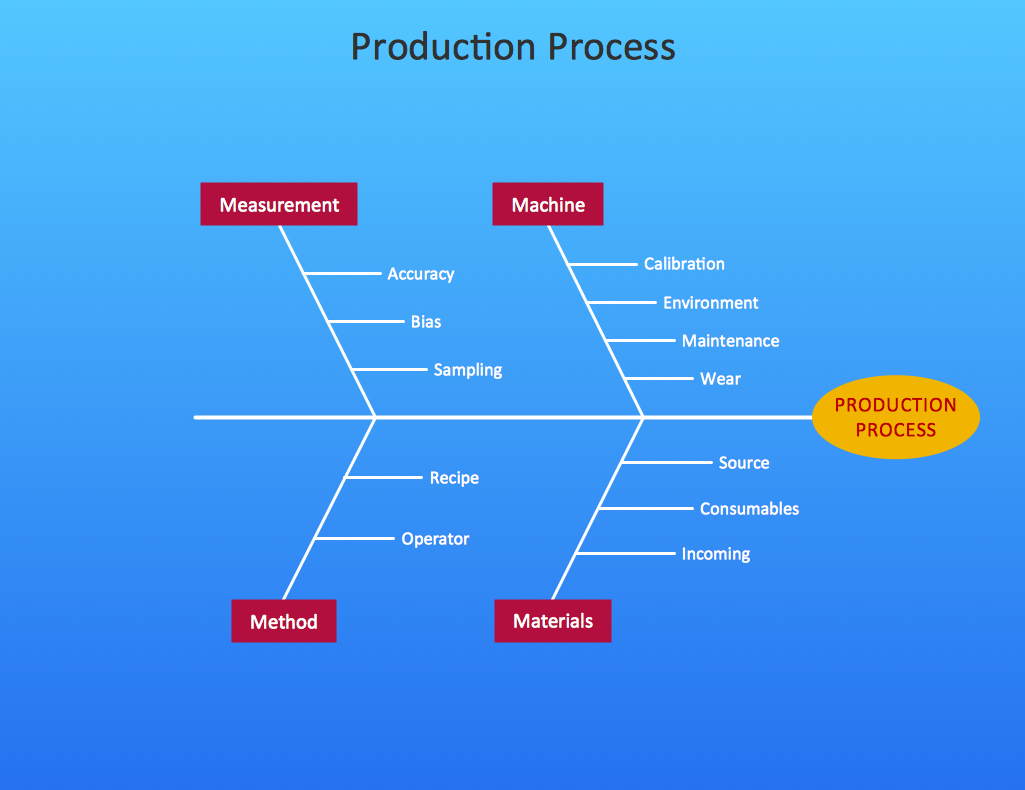
Example 1. Cause and Effect Diagram - Production Process
Fishbone Diagrams Solution from ConceptDraw Solution Park extends ConceptDraw DIAGRAM ector graphics and diagramming software with the ability to draw professional looking Cause and Effect Diagram without efforts.

Example 2. Fishbone Diagrams Library Design Elements
It offers you the Fishbone Diagrams library with numerous collection of ready-to-use vector objects, and also set of predesigned Fishbone, Ishikawa, and Cause and Effect Diagrams.

Example 3. Cause and Effect Diagram - Increase in Productivity
The Cause and Effect Diagram samples you see on this page were created in ConceptDraw DIAGRAM software using the tools of the Fishbone Diagrams Solution. An experienced user spent 10 minutes creating each of these Cause and Effect Diagrams.
Use the Fishbone Diagrams Solution for ConceptDraw DIAGRAM Solution Park for quick, easy and effective Cause and Effect Diagram creating.
All source documents are vector graphic documents. They are available for reviewing, modifying, or converting to a variety of formats (PDF file, MS PowerPoint, MS Visio, and many other graphic formats) from the ConceptDraw STORE. The Fishbone Diagrams Solution is available for all ConceptDraw DIAGRAM or later users.
TEN RELATED HOW TO's:
This method of problem analysis is widely used in IT, manufacture industries and chemical engineering. If you want to take a fresh look on your problem, you can draw a fishbone diagram with ConceptDraw DIAGRAM software, which supports both MAC OS and Windows. You can see and download fishbone diagram samples and templates in ConceptDraw Solution Park.
This Fishbone (Ishikawa) diagram can be applied as template for performing the cause and effect analysis of a service industry problems. It can help to determine factors causing problems. Causes in this diagram are categorized according to the 4S’s principle that means Surroundings, Suppliers, Systems and Skills. Grouping causes allows to reveal main interactions between different events. This diagram was made using ConceptDraw Fishbone diagrams solution. It can help to reveal the causes effected a complicated issue. Of course it can be used together with other methods of approaching to the problem solving.
Picture: Draw Fishbone Diagram on MAC Software
Related Solution:
Cause and Effect Fishbone Diagram is one of the popular productivity and management tools widely used in business organizations. It is also known as Fishbone Diagram, because it looks like a fish skeleton. Cause and Effect Diagram provides a structured way which helps to identify all possible causes of a problem. Cause and Effect Diagram can be applied anywhere where exists a causal relationship.
Now the problem of complexity the Cause and Effect Fishbone Diagram creating is solved thanks to the ConceptDraw DIAGRAM diagramming and vector drawing software extended with Fishbone Diagrams solution from the Management area.
Picture: Cause and Effect Fishbone Diagram
Related Solution:
The Value Stream Map is one of the key tools of lean practitioners. It helps aptly describe the manufacturing processes both complex and simple. It supports process improvement, allows identifying waste, and reducing process cycle times. Use ConceptDraw DIAGRAM extended with Value Stream Mapping solution to document processes starting with a professionally designed Value Stream Mapping template.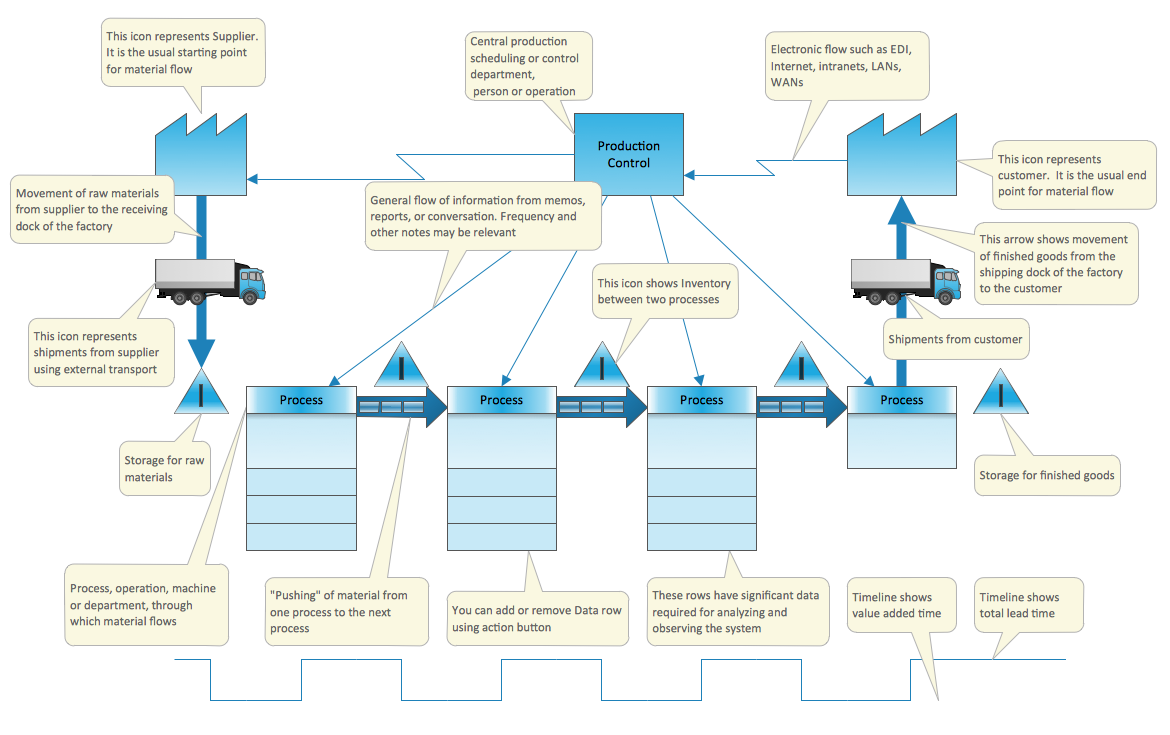
Picture: Value Stream Mapping Template
Related Solution:
ConceptDraw DIAGRAM creates drawings, diagrams and charts with great visual appeal in Mac OS X.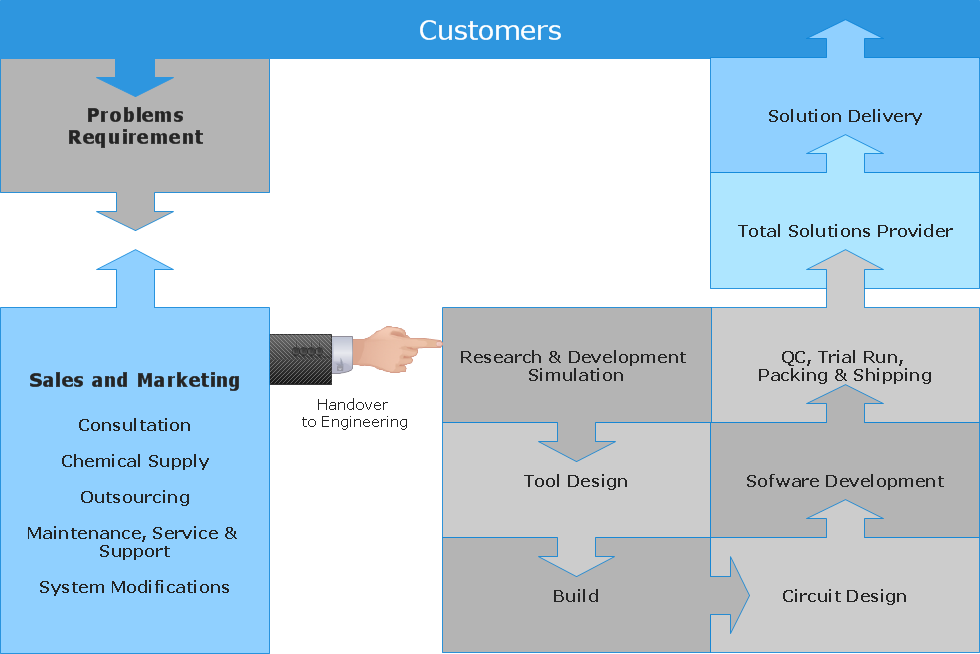
Picture: Best Vector Drawing Application for Mac OS X
Related Solution:
Every engineering project starts from a terms of reference document. The next stage of developing is a technical drawing, which requires using appropriate software. However, revisions and discussions about requirements are possible at any stage of development.
This technical drawing demonstrates a schematic flow diagram of pulp reclaiming. This diagram of magnetite pulp reclaiming is created using ConceptDraw Chemical and Process engineering solution, The solution delivers more than 460 vector graphic icons and connectors. Generally, it is intended for designing process and instrumentation diagrams (P&ID) for chemical and process engineering. block flow diagrams (BFD), process flow diagrams (PFD) for chemical industry.
Picture: Technical Drawing Software
Related Solution:
The Total Quality Management Diagram solution helps your organization visualize business and industrial processes. Create Total Quality Management diagrams for business process with ConceptDraw software.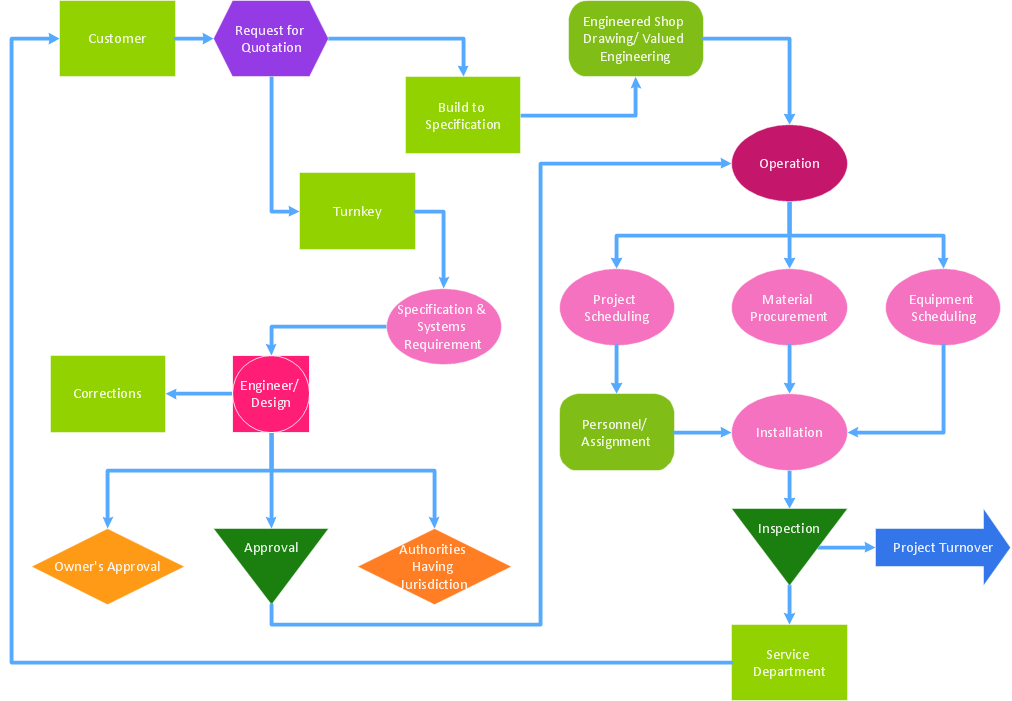
Picture: Definition TQM Diagram
Related Solution:
The Total Quality Management Diagram solution helps you and your organization visualize business and industrial processes. Create Total Quality Management diagrams for business process with ConceptDraw software.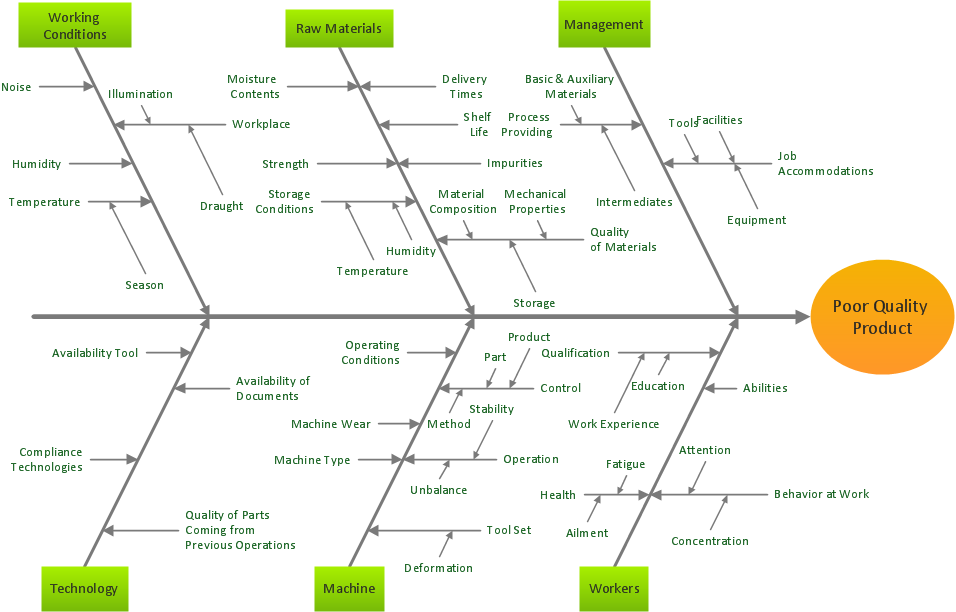
Picture: Total Quality Management Business Diagram
Related Solution:
Fishbone Diagram, also referred as Cause and Effect diagram or Ishikawa diagram, is a fault finding and problem solving tool. Construction of Ishikawa diagrams is quite complicated process and has a number of features.
Fishbone Diagrams solution included to ConceptDraw Solution Park contains powerful drawing tools and a lot of examples, samples and templates. Each Fishbone diagram example is carefully thought-out by experts and is perfect source of inspiration for you.
Picture: Fishbone Diagram Example
Related Solution:

