Chart Examples
Graph and chart examples
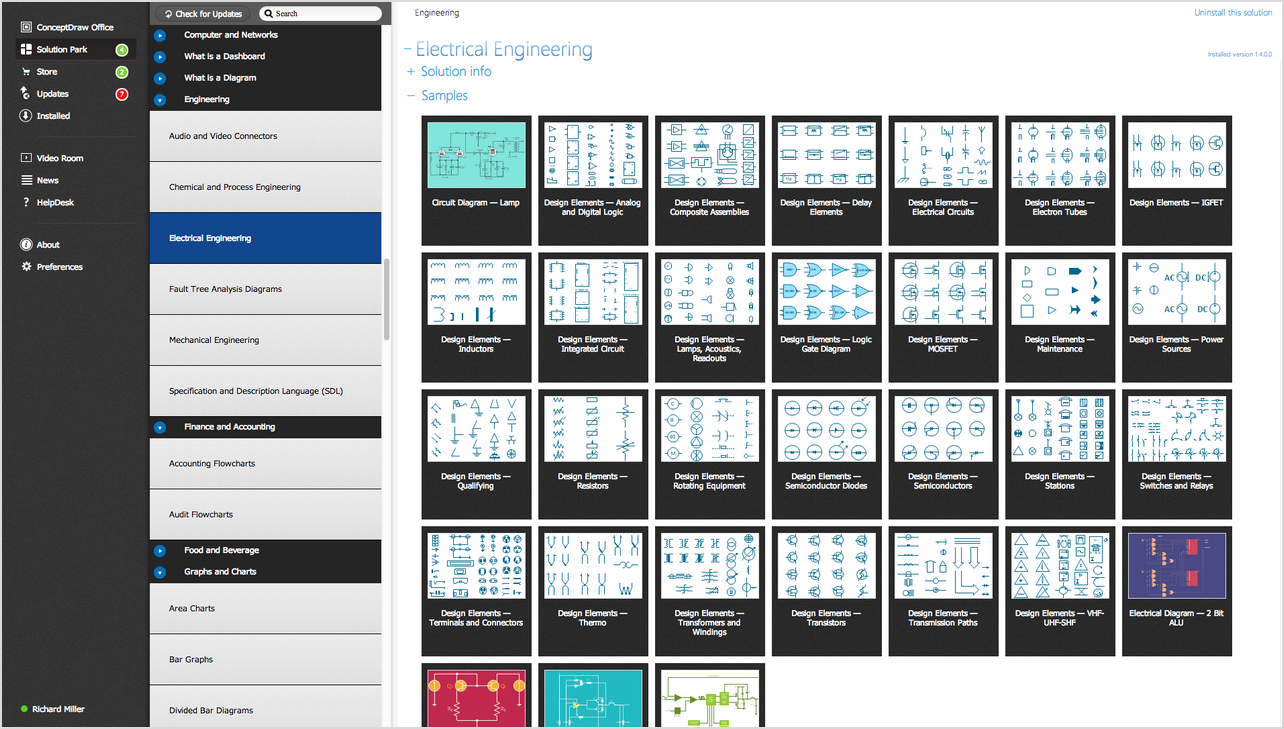
Solutions from the Graphs and Charts area of ConceptDraw Solution Park provide examples and templates of the most popular graphs and charts as pie and donut charts, bar and column graphs, line and scatter charts that show how you can visualize your numerical data using ConceptDraw DIAGRAM diagramming and vector drawing software.
You can easy customize these example charts to quickly create your own graphs for visual data comparison and illustration of business documents, infographics, presentations and websites.
Pie
 Pie Chart
 Exploded Pie Chart
 Percentage Pie Chart
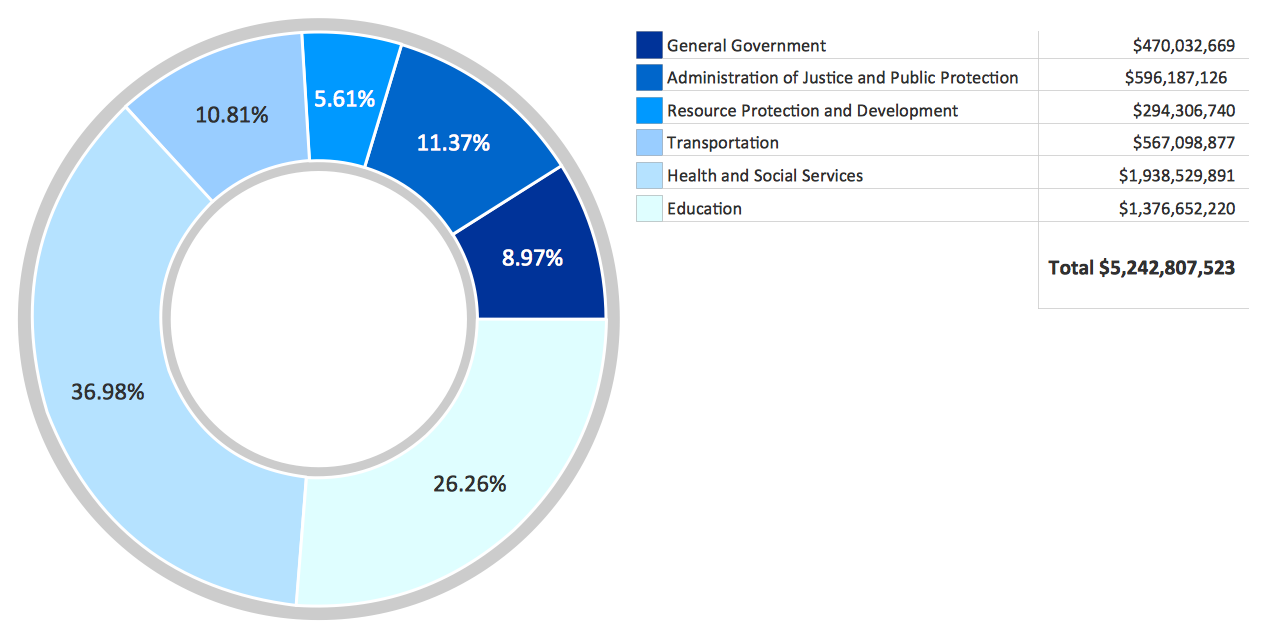 Donut Chart
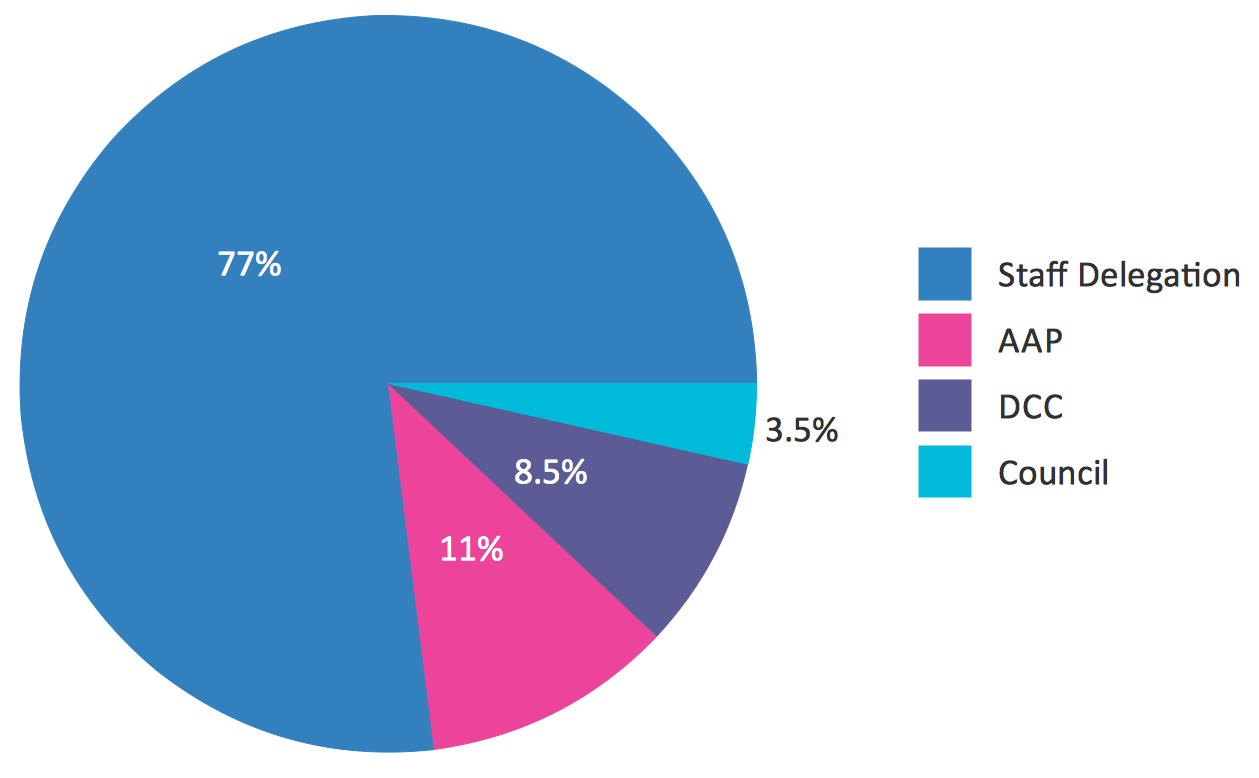
 Percentage Pie Chart
 Column Chart
 3D Column Chart
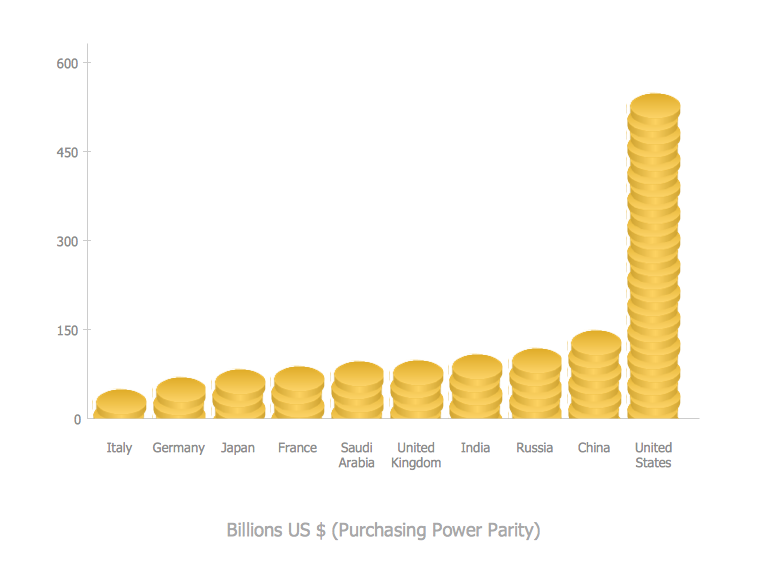
 Cylindrical Column Chart
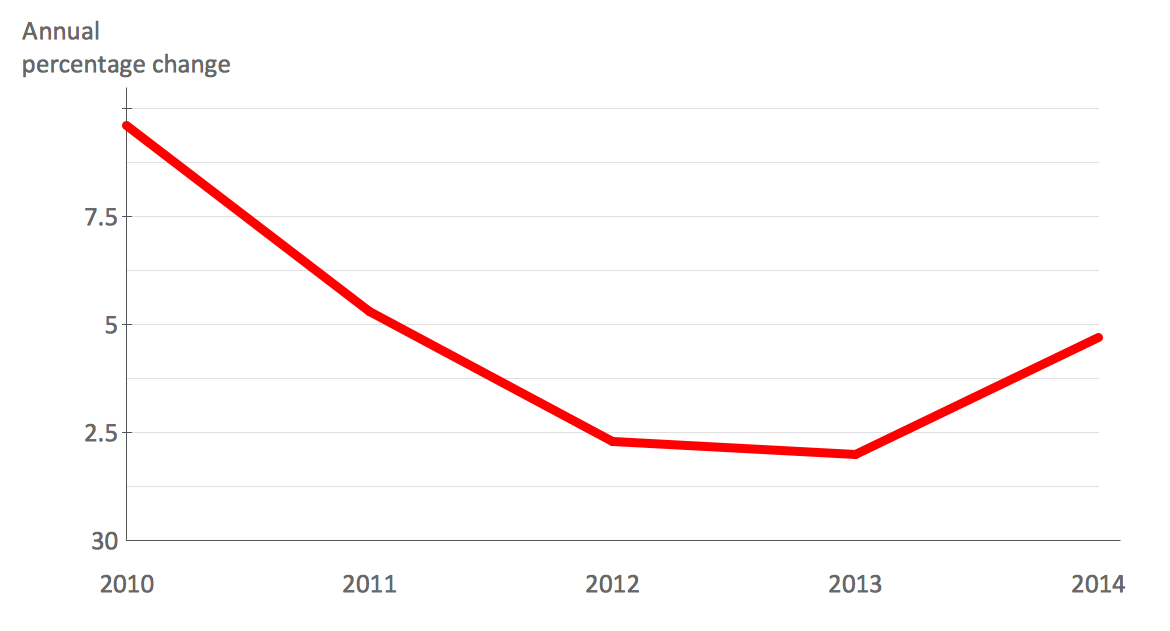 Line Graph - Anual Percentage Change
 Line Graph -
  Line Graph -
  Line Graph -
  Line Graph - Anual Percentage Change
 Line Graph -
  Double Bar Chart
 Horizontal Bar Chart
 Vertical Bar Chart


 Scatter Chart
 Scatter Chart
 Scatter Chart