Chemical Process Flow Diagram
A chemical process is a combination of steps during which at specific conditions starting materials are converted into other products. A few types of diagrams are used in the chemical industry and provide specific details: Block Flow Diagram, Process Flow Diagram, Piping & Instrumentation Diagram.
Block Flow Diagram (BFD) gives an overview of the chemical plant and the process flow, but without details. BFD shows the main pieces of equipment and the chemical process steps. The equipment of the process industry is shown in rectangular boxes in the diagram.
Process Flow Diagram (PFD) is a diagram, which represents the chemical engineering processes and is more detailed than the Block Flow Diagram. It is also called the flow sheet and shows the main path of the process flow, details about major equipment, subsystems, and relationships between the components. It can include the main parameters of the chemical plant and process.
Piping & Instrumentation Diagram (P&ID) or a Process and Instrumentation Diagram is the detailed Process Flow Diagram. It includes more details about the used equipment, types, and diameters of pipes and valves, vents, fittings, drain lines, etc.
Chemical Process Flow Diagram is one of the primary and most used tool for chemical engineers. Process Flow Diagrams have multiple purposes and a lot of benefits. PFDs give a representation of the inputs and outputs, how the components interact with each other, which actions involved in a process help to make it more efficient and contribute to achieving successfully the primary targets. They show the general arrangement of the process units in an enterprise, help to standardize the chemical processes, and ensure their reliability and repeatability. Chemical Process Flow Diagrams provide an understanding of any chemical manufacturing process, show the major operational units and their interconnections. Sometimes PFDs include the state conditions like pressure, temperatures, etc.
With a Process Flow Diagram, the entire process taking place is in full view of the working personnel. This helps to understand the nuances and features of a specific chemical process, reveal weak points, indicate possible problematic points, unnecessary steps, bottlenecks, uncover errors in the process chain, and other inefficiencies. PFDs assist in studying a process for efficiency, making necessary changes and improvements to achieve the maximal result, prevent confusion and errors. Therefore PFD is a way to continuous improvement of the existing process, optimization of the potential, and also modeling a new process.
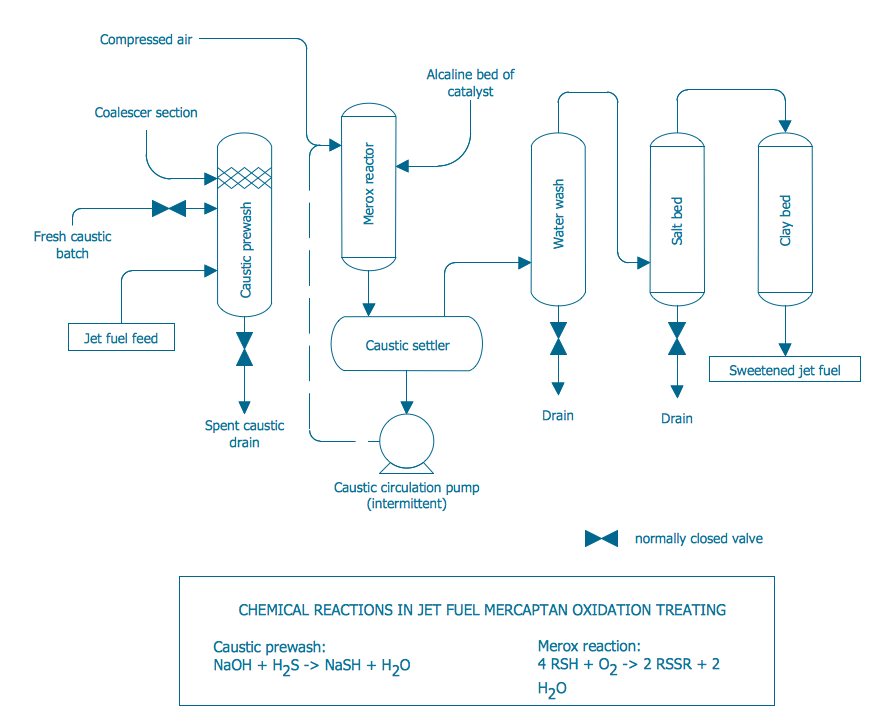
Example 1. Chemical Process Flow Diagram
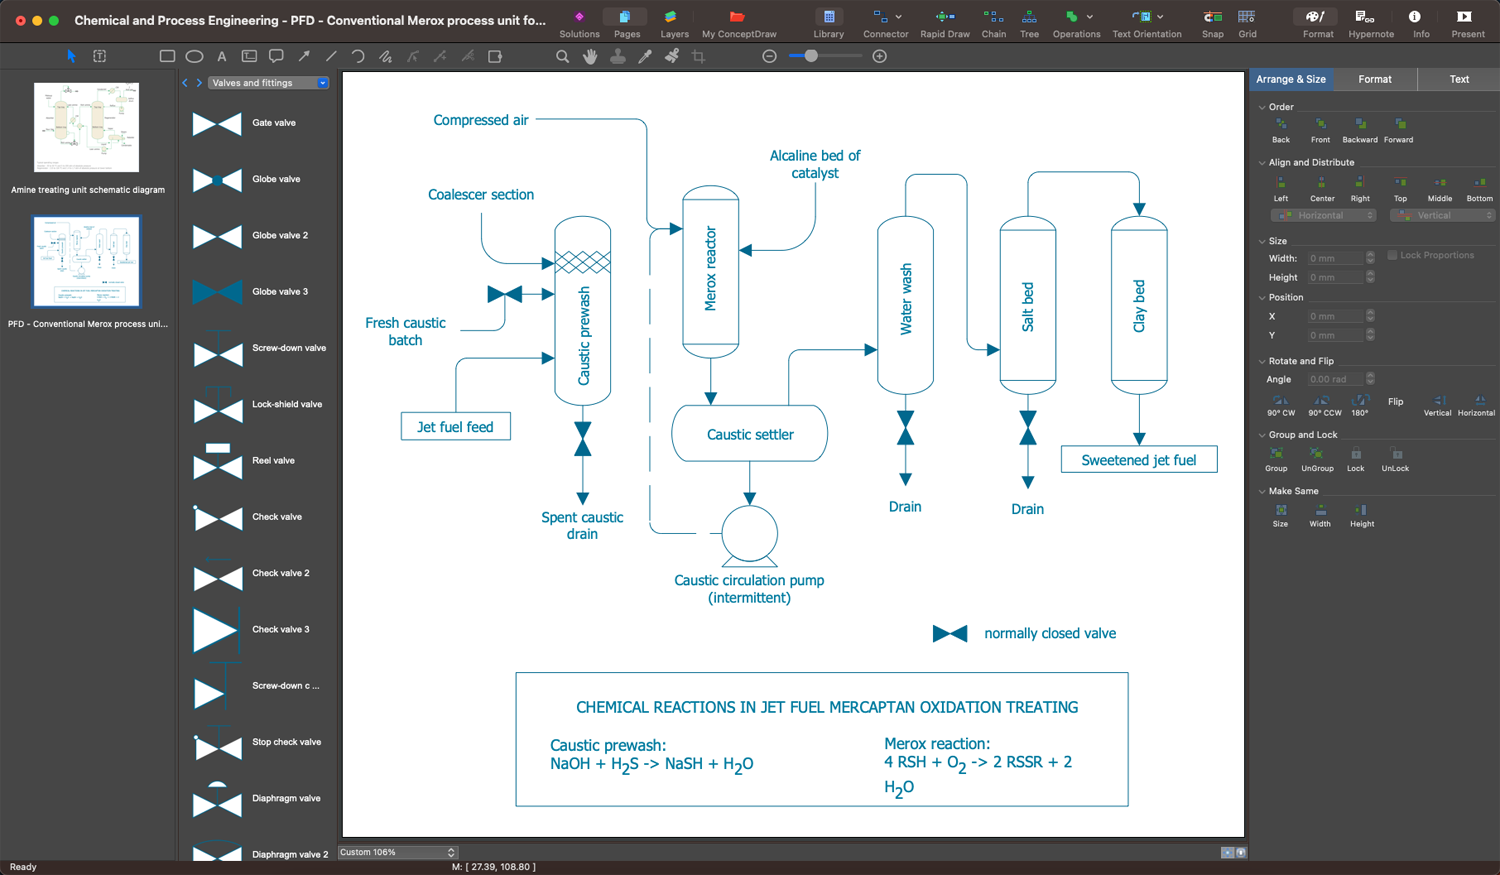
Chemical and Process Engineering solution for ConceptDraw DIAGRAM software is an innovative and sustainable solution, which helps to visualize both simple and complex chemical engineering processes quickly and easily through an easy-to-use user interface and an extensive selection of predesigned shapes, symbols, and icons.
Identify the process needs, illustrate start and end points, all activities that will be involved, and the sequence of steps using the appropriate shapes from the solution libraries. Create Process Flow Diagrams easily and use them to document and standardize the processes at the enterprise, realize compliance control of your process flows, create comprehensive reports, improve communication among the team members working on a project, analyze and identify where improvements can be made, and increase the efficiency of quality control and training of employees.

Example 2. Chemical and Process Engineering Library Design Elements
The extensive selection of vector stencils and icons offered by solution libraries makes it possible to create the Chemical Process Flow Diagram of any complexity easily and quickly. These include design elements — chemical and process engineering, flow chart elements, industrial equipment, instruments, and many more vector stencils. Each block of the Process Flow Diagram depicts a stage in a process or a single piece of equipment. The process flow is usually shown from left to right and the arrows show the direction of the flow.

Example 3. Chemical Process Flow Diagram — Typical Oil Refinery
The set of Process Diagrams you see on this page was created in ConceptDraw DIAGRAM software using the Chemical and Process Engineering Solution. These samples successfully demonstrate solution's capabilities and professional results you can achieve. An experienced user spent 10-20 minutes creating each of them.
Use the Chemical and Process Engineering Solution for ConceptDraw DIAGRAM software to create your own professional-looking Process Diagrams of any complexity quick, easy and effective, and then successfully use them in your work and scientific activity.
All source documents are vector graphic documents. They are available for reviewing, modifying, or converting to a variety of formats (PDF file, MS PowerPoint, MS Visio, and many other graphic formats) from the ConceptDraw STORE. The Chemical and Process Engineering Solution is available for all ConceptDraw DIAGRAM users.