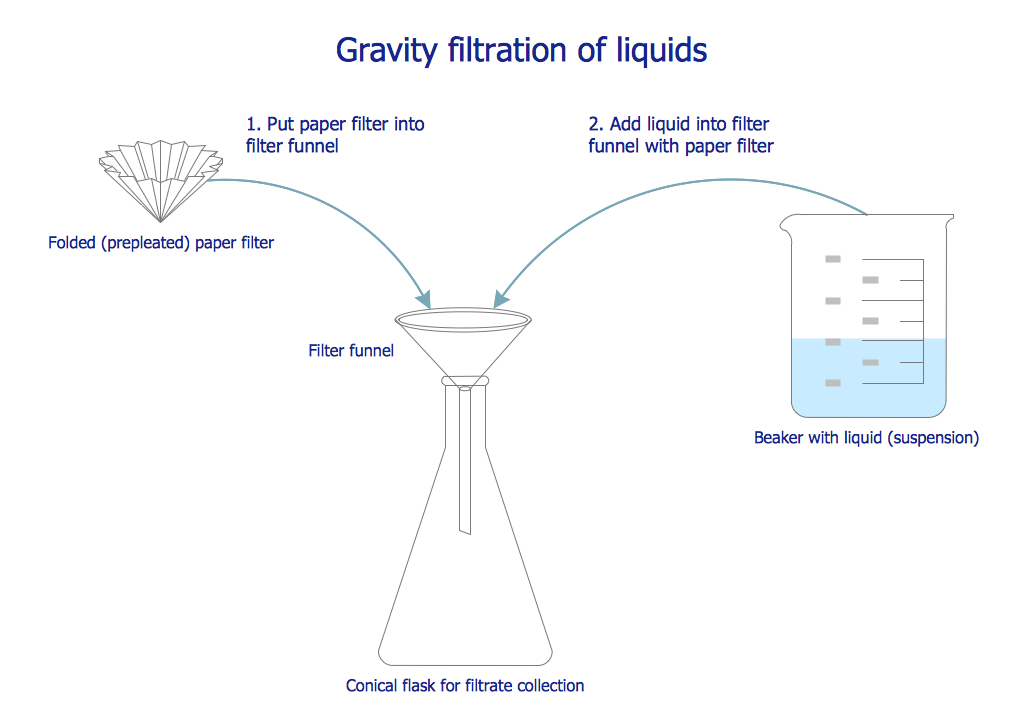
Sample 1. Chemistry symbols and meanings – Chemistry Gravity Filtration of Liquids
This sample was created in ConceptDraw DIAGRAM using the Chemistry Solution. It shows the process of liquid gravity filtration through a prepleated paper filter. An experienced user spent 5 minutes creating this sample.
Use the Chemistry Solution for ConceptDraw DIAGRAM software to create your own professional looking chemical drawings, diagrams, schemes and illustrations of any complexity quick, easy and effective, and then successfully use them.
The chemical schemes designed with ConceptDraw DIAGRAM are vector graphic documents and are available for reviewing, modifying, converting to a variety of formats (image, HTML, PDF file, MS PowerPoint Presentation, Adobe Flash or MS Visio), printing and send via e-mail in one moment.
TEN RELATED HOW TO's:
To keep data in tables is useful, but tables are not convenient for presentations or communication. Create clearly and simply a tables with Conceptdraw DIAGRAM.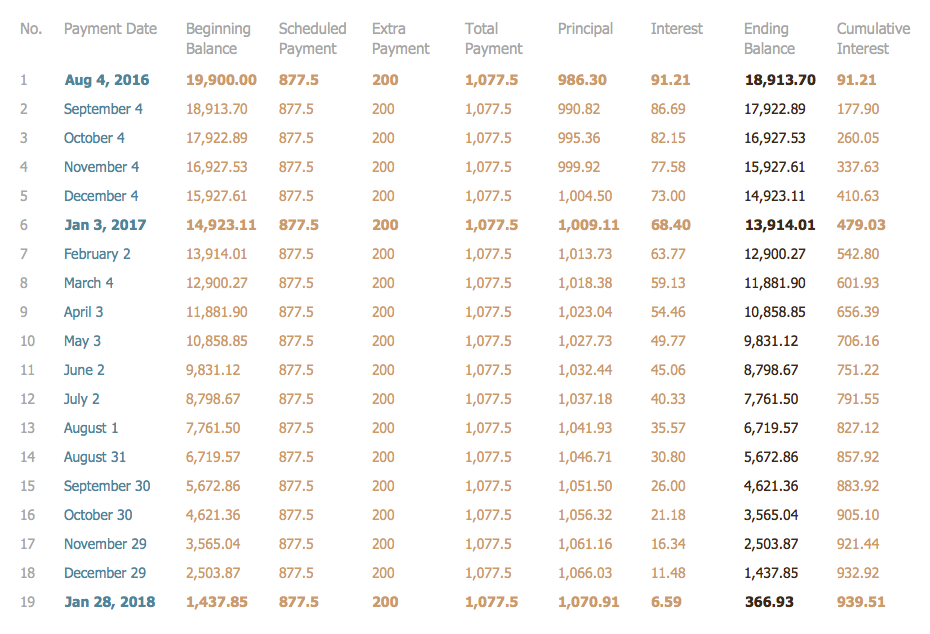
Picture: Tables’ Beauty
Related Solution:
The ER diagram is constructed from the specific ERD graphic elements. There are used 2 types of ERD notations: Chen and Crow's Foot.
A complete set of work flow shapes, notation & symbols for ERD, entity relationship stencils, included in Entity-Relationship Diagram (ERD) solution for ConceptDraw DIAGRAM software, makes drawing diagrams based on ERD notation as smooth as possible.
Picture: Notation & Symbols for ERD
Related Solution:
The critical importance of house electrical plans. 🔸 Learn how to create efficient electrical layouts using the ConceptDraw DIAGRAM app. Enhance ✔️ safety, ✔️ functionality, and ✔️ compliance with electrical codes in your home projects with our comprehensive guide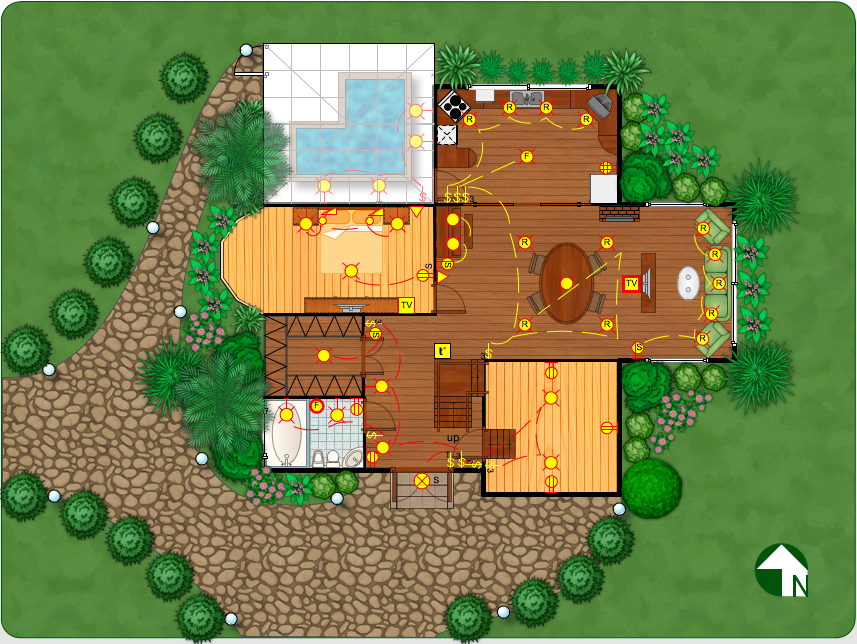
Picture:
Importance of House Electrical Plans
How to Create Electrical Layouts
with ConceptDraw DIAGRAM App
Related Solution:
Use the ConceptDraw DIAGRAM software that has vector clipart of numerous cable connectors, examples, and templates for drawing different types of audio and video connection diagrams. Paste icon of the receiver or another device to page and layout sockets and plugs. Further connect plugs with each other, and now you have well-designed connection diagram.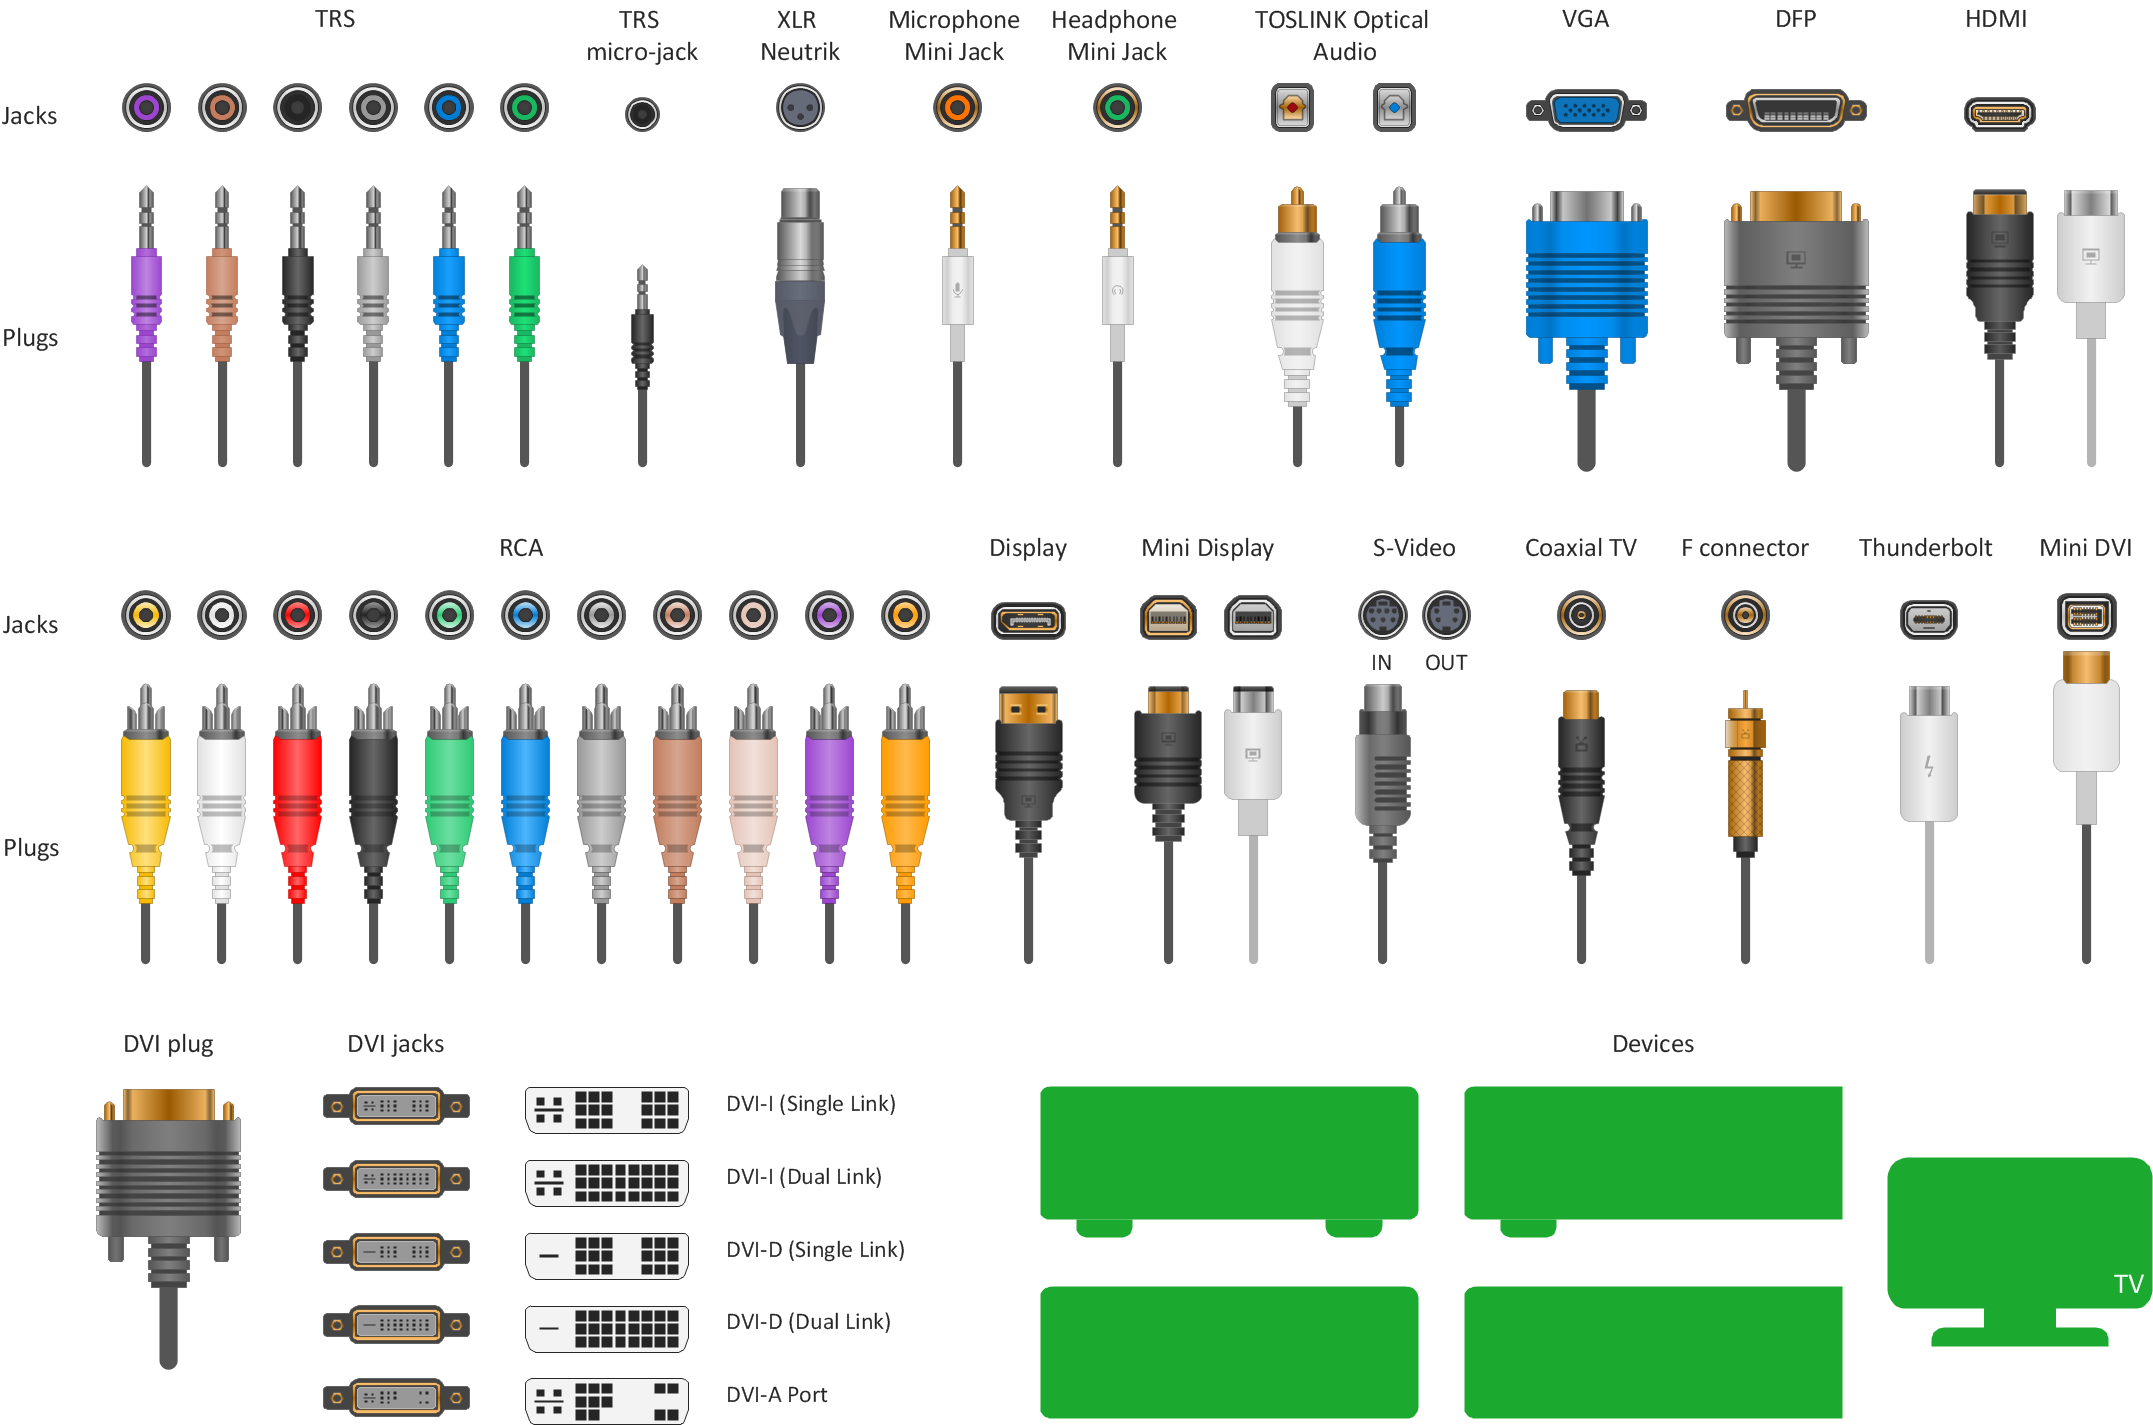
Picture: How to Make Audio and Video Connections
Related Solution:
Project progress on web: delivering project status to remote teams and stakeholders via Skype.
Picture: How To Show Project Progress Peport on Web
Related Solution:
When it comes to system construction, a class diagram is the most widely used diagram. UML Class Diagrams is a type of static structure diagram that is used for general conceptual modeling of the systematics of the application. Such a diagram would illustrate the object-oriented view of a system. The object orientation of a system is indicated by a class diagram. It describes the structure of a system by showing the general issues,classes of a system, attributes, operations, interfaces, inheritance, and the relationships between them.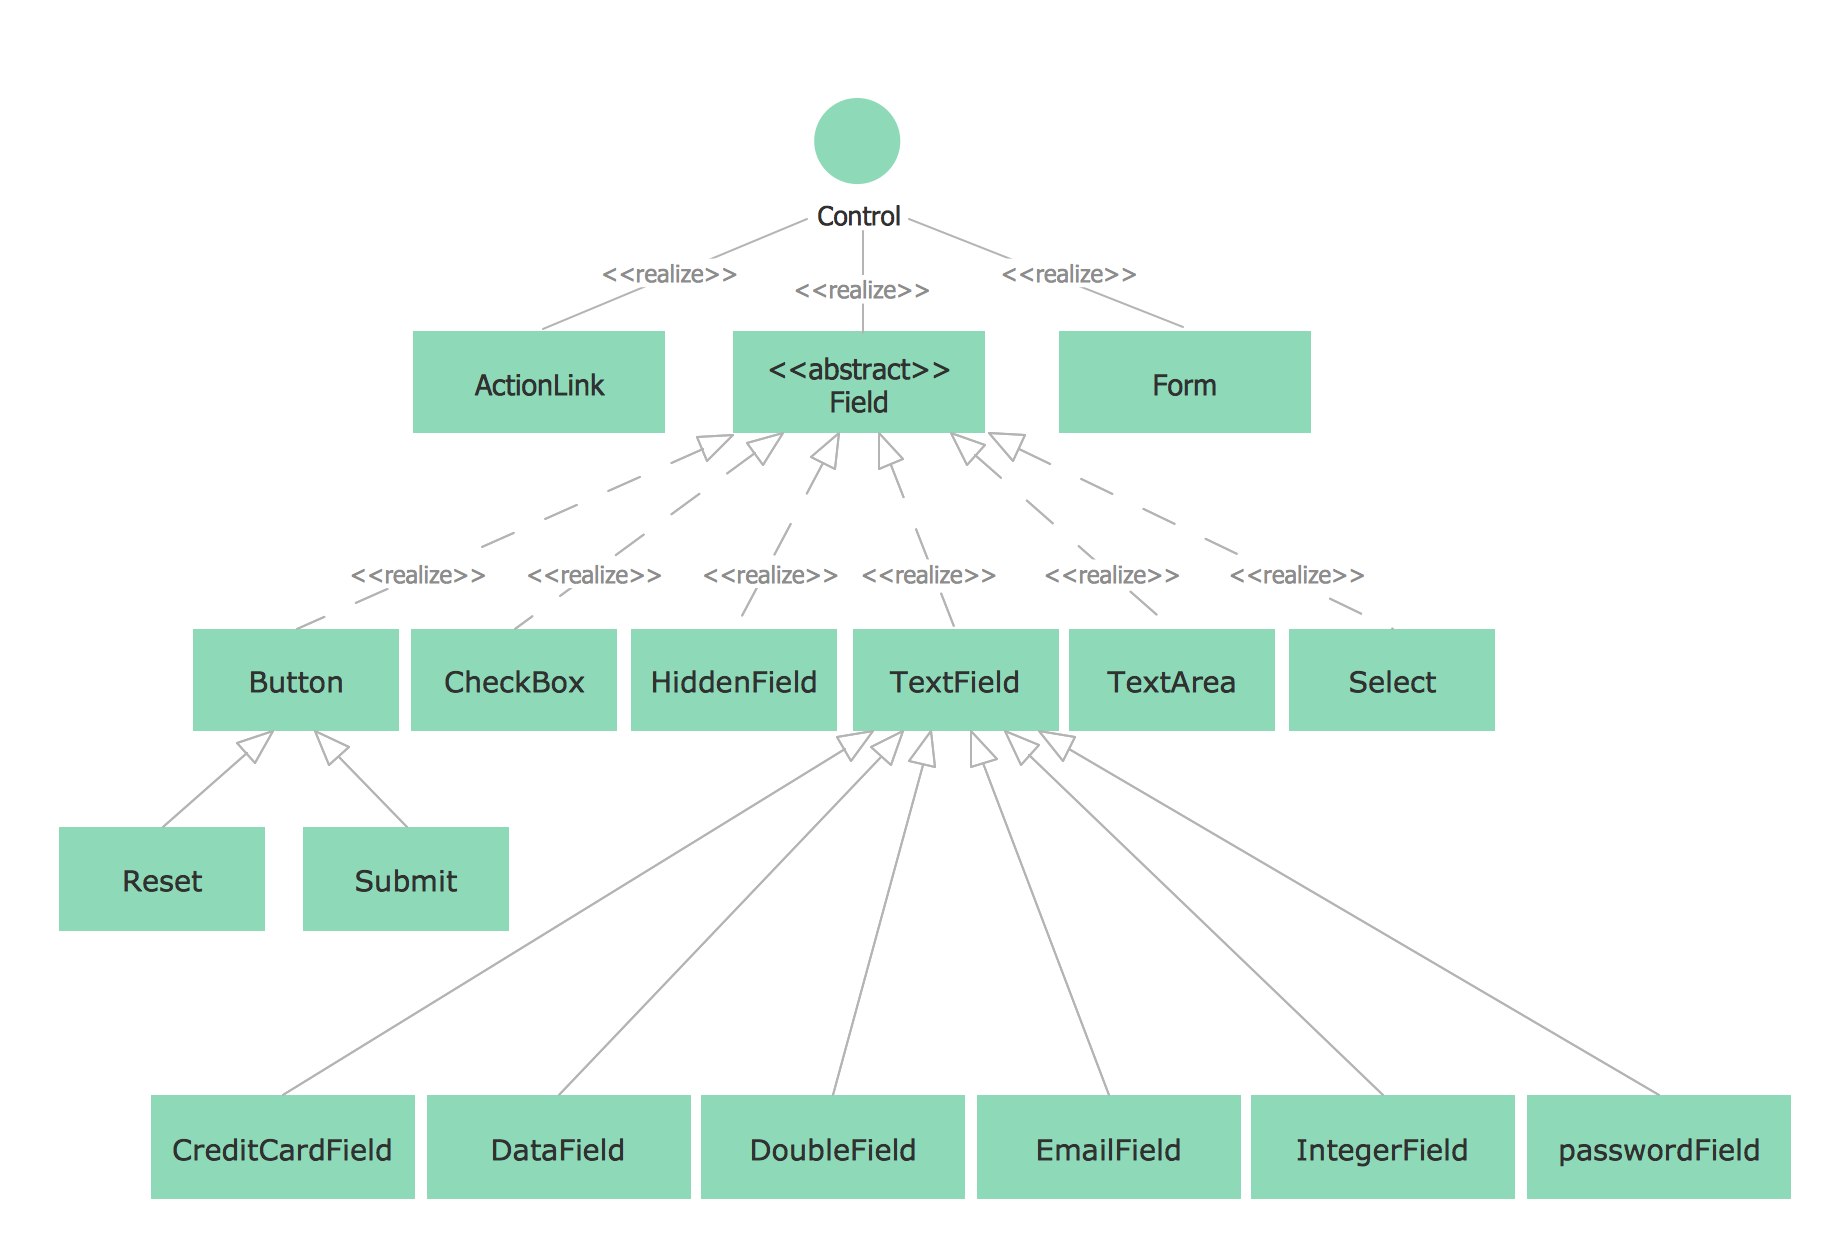
Picture: UML Class Diagram Notation
Related Solution:
Astronomy solution provides the Stars and Planets library with wide variety of solar system symbols. You can find here vector objects of solar system, of stars and planets of the universe.
To quickly draw any astronomy illustration: create new document and simply drag the needed solar system symbols from the Stars and Planets library, arrange them and add the text. You can also use the predesigned templates and samples from the ConceptDraw STORE as the base for your own sun solar system illustrations, astronomy and astrology drawings.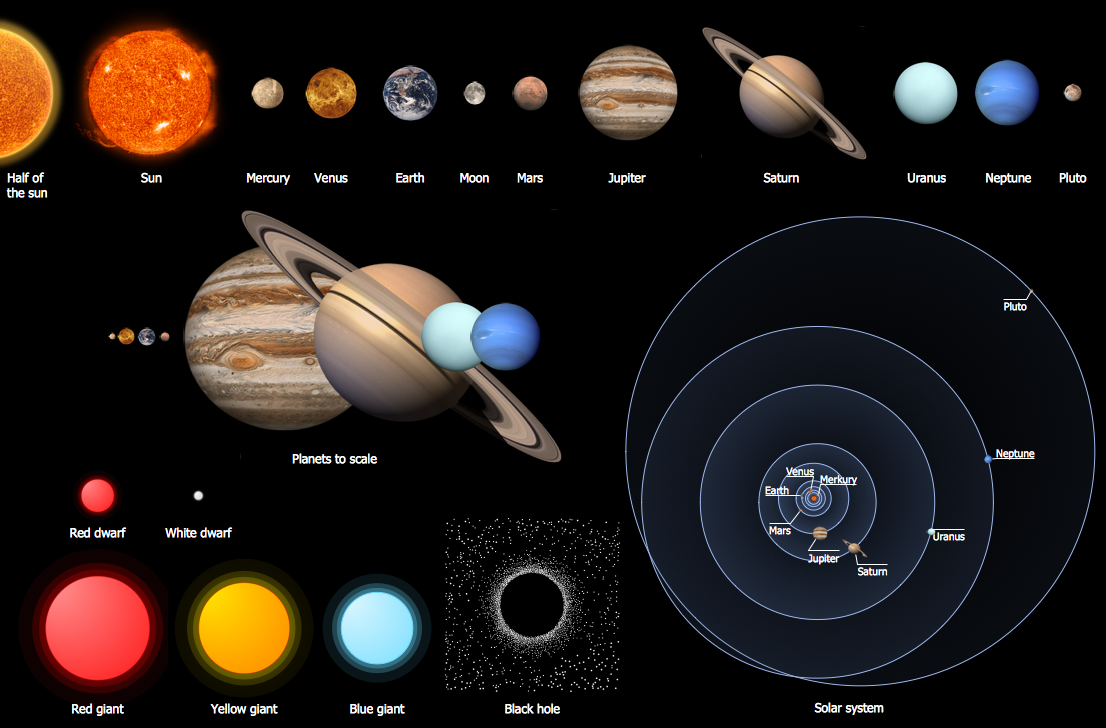
Picture: Solar System Symbols
Related Solution:
This sample was created in ConceptDraw DIAGRAM diagramming and vector drawing software using the Computer and Networks solution from Computer and Networks area of ConceptDraw Solution Park.
This sample shows the Point-to-point network topology.
Network topology is the topological structure of the computer network.
Point-to-point network topology is a simple topology that displays the network of exactly two hosts (computers, servers, switches or routers) connected with a cable. Point-to-point topology is widely used in the computer networking and computer architecture.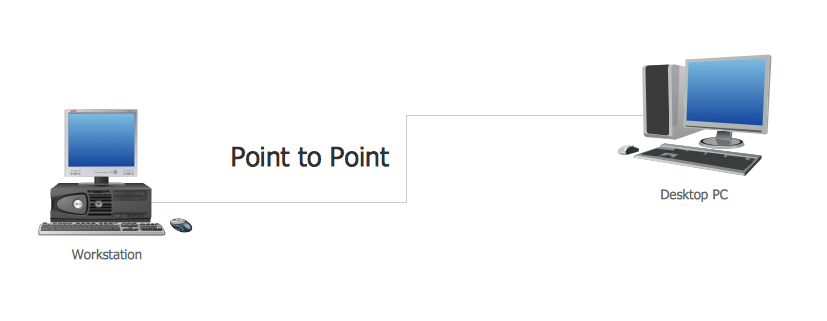
Picture: Point to Point Network Topology
Related Solution:
The Process Flowchart or Process Flowchart Diagram (PFD) is a visual representation relations between major parts of the system, the steps in a process, and even connections between various systems. The possibility to easy create professional-looking and attractive Process Flowcharts, Business Process Diagrams and Maps which visualize the steps of complex processes is provided by Business Process Diagram Solution from the Business Processes Area of ConceptDraw Solution Park and 16 libraries with 230 process flowchart symbols from BPMN 1.2 and BPMN 2.0.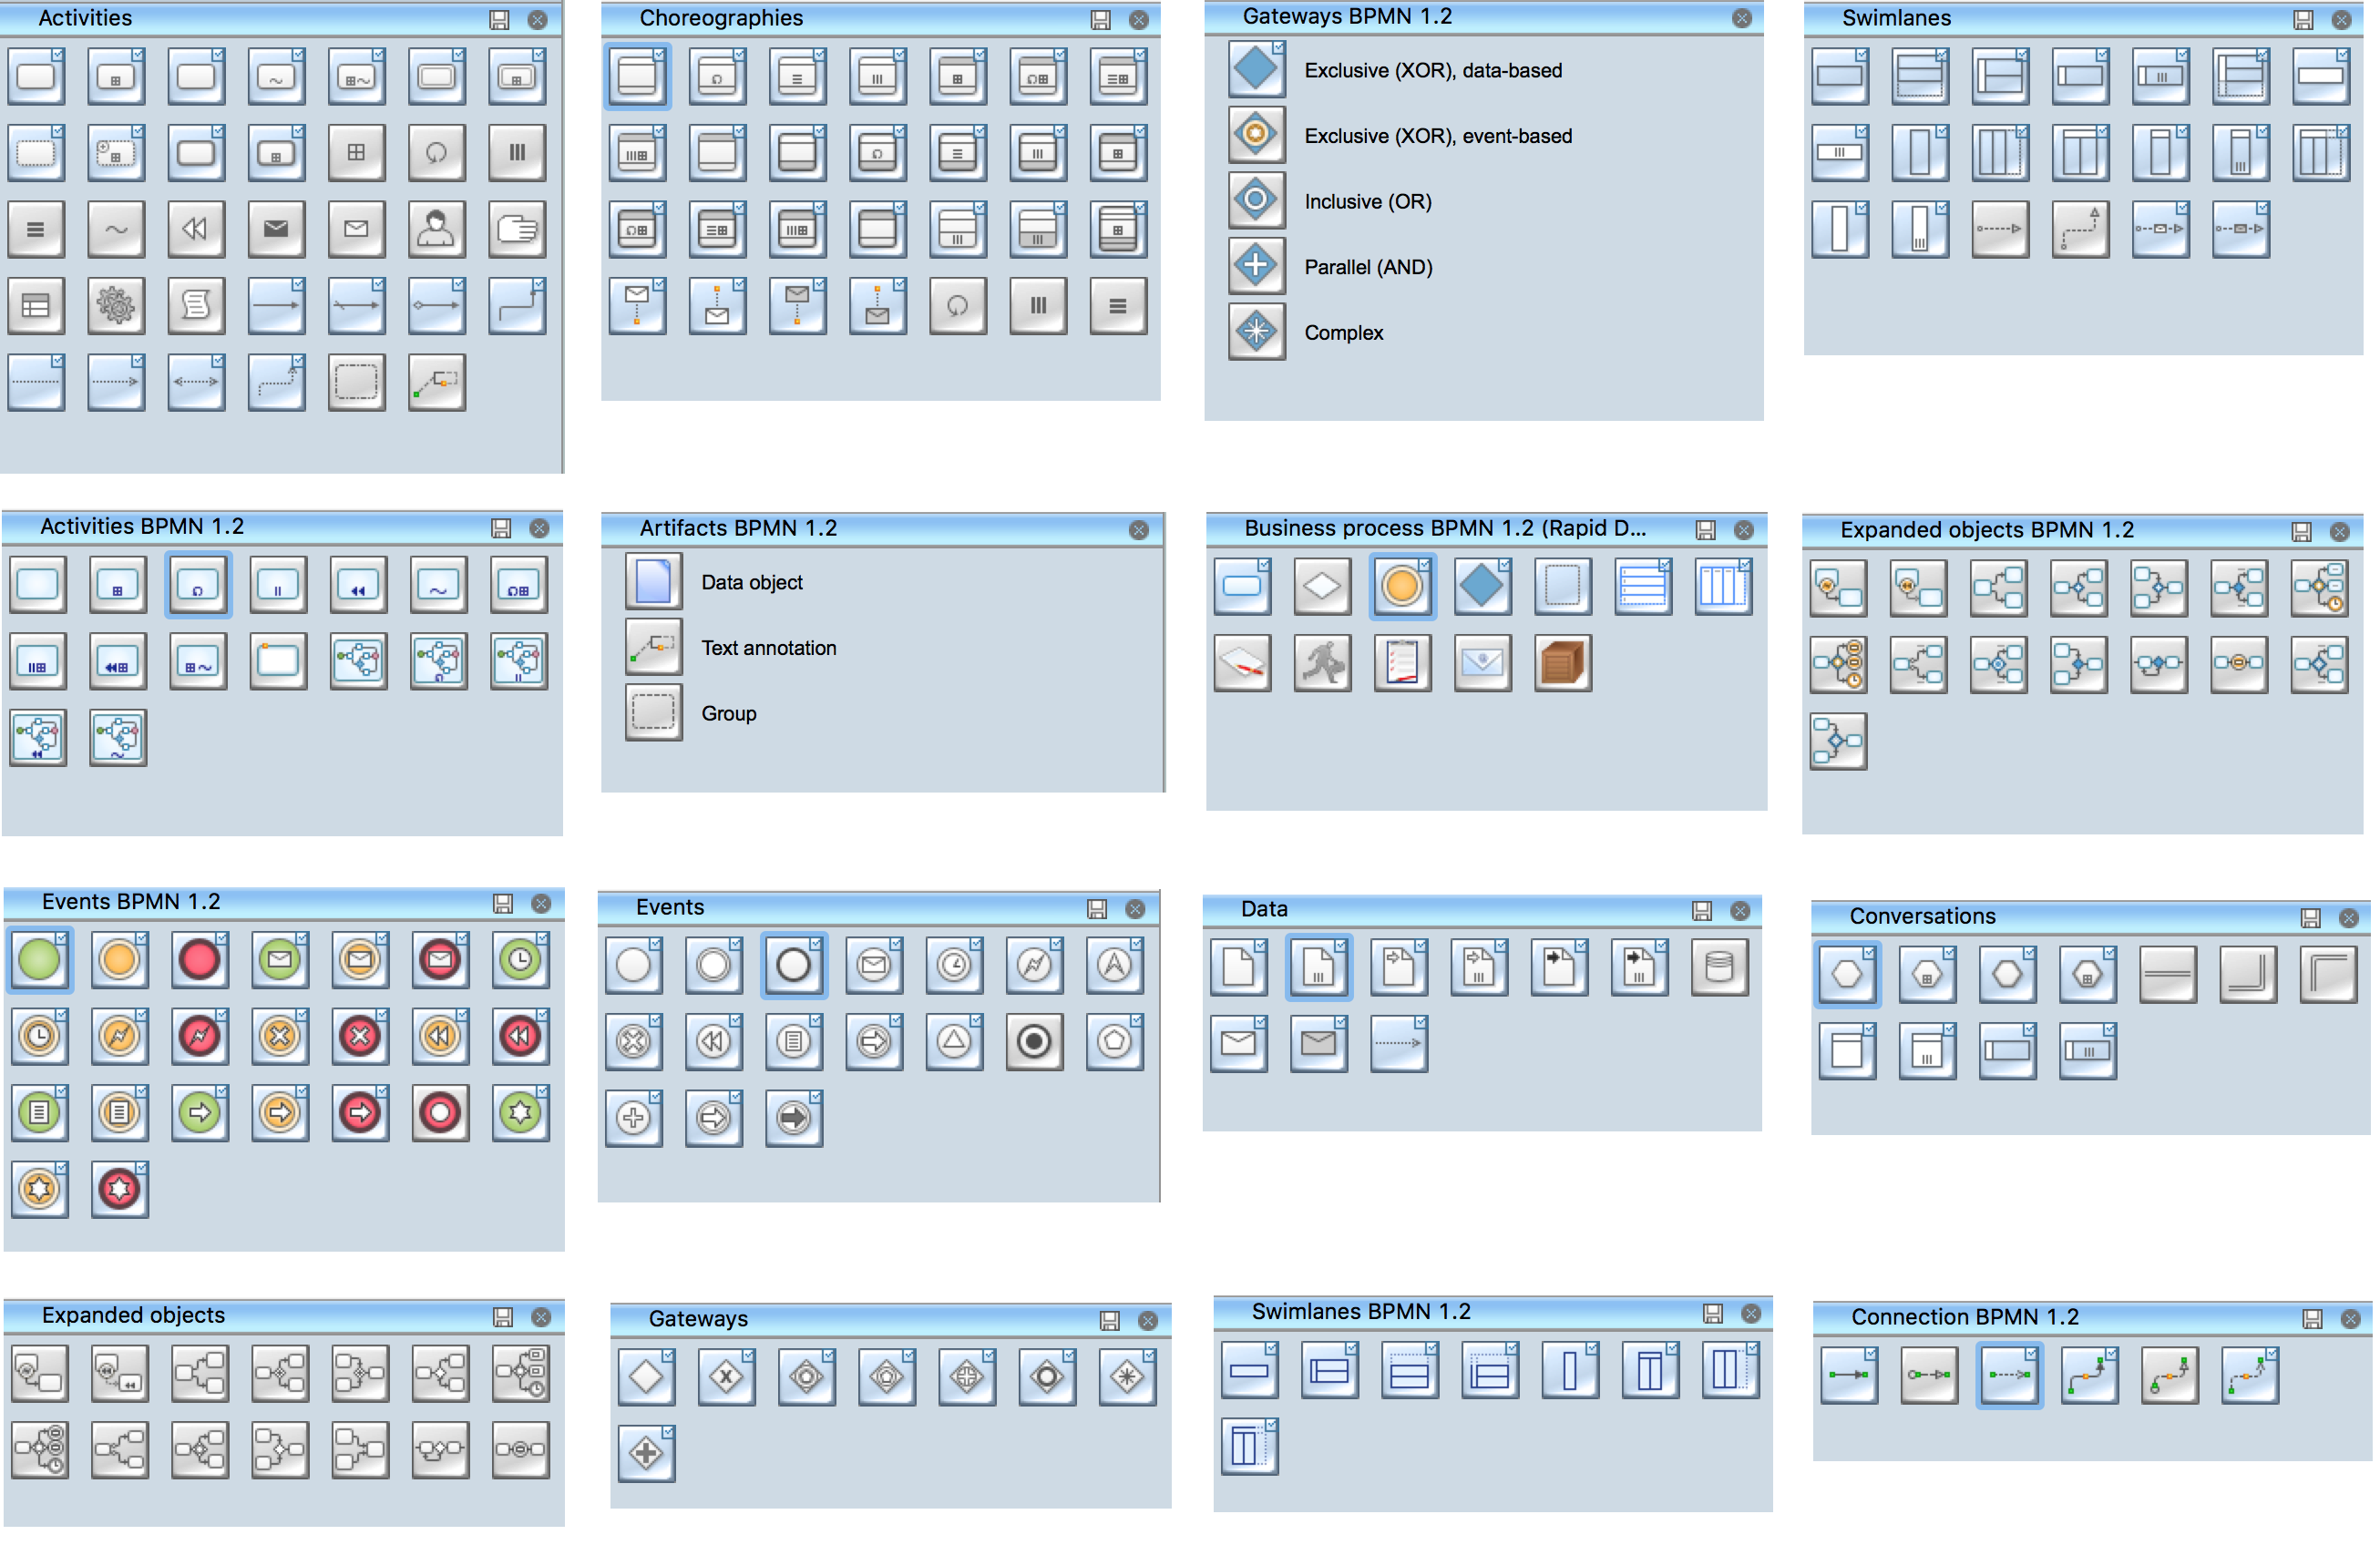
Picture: Process Flowchart Symbols
Related Solution:
This sample was created in ConceptDraw DIAGRAM drawing software using the Flowcharts solution.
Picture: Horizontal Flowchart
Related Solution:


