Circuits and Logic Diagram Software
Circuits and Logic Diagram Software
A circuit diagram is a graphical representation of an electrical circuit. Circuit diagrams show actual wire connections between devices, including power and signal connections. But they don't show the physical arrangement of components.
Circuit diagrams are widely used for design, construction and maintenance of various electrical and electronic equipment; for visualizing expressions using the Boolean Algebra in the computer science.
In electronics are used logic circuit diagrams. The logic gate is an idealized or physical device that implements a Boolean function. Logic gates can be realized using diodes, transistors, electromagnetic relays, pneumatic logic, optics, molecules, fluidic logic, various mechanical elements. Logic circuits can include more than 100 million gates.
ConceptDraw DIAGRAM provides Electrical Engineering solution from the Industrial Engineering Area of ConceptDraw Solution Park.
Electrical Engineering solution helps you create quick and easy:
- Electrical schematics
- Digital and analog logic designs
- Circuit and wiring schematics and diagrams
- Power systems diagrams
- Maintenance and repair diagrams
- Circuit board and amplifier diagrams
- Integrated circuit schematics

Pic. 1. Circuits and Logic Diagram Software
Circuits and Logic Symbols
Electrical Engineering solution from the Industrial Engineering Area of ConceptDraw Solution Park includes the following 26 libraries with near 1000 predesigned vector objects:
- Analog and Digital Logic
- Composite Assemblies
- Delay Elements
- Electrical Circuits
- Electron Tubes
- IGFET
- Inductors
- Integrated Circuit
- Lamps, Acoustics, Readouts
- Logic Gate Diagram
- Maintenance
- MOSFET
- Power Sources
- Qualifying
- Resistors
- Rotating Equipment
- Semiconductor Diodes
- Semiconductors
- Stations
- Switches and Relays
- Terminals and Connectors
- Thermo
- Transformers and Windings
- Transistors
- Transmission Paths
- VHF UHF SHF

Pic. 2. Circuits and Logic Diagram Symbols
On this picture you can see the Circuits and Logic symbols from the libraries of Electrical Engineering solution that you can use for quick, easy and effective designing professional looking Circuits and Logic Diagrams of any difficulty.
Circuits and Logic Diagram Sample
Electrical Engineering solution from the Industrial Engineering Area of ConceptDraw Solution Park contains a large number of templates and samples that you can use and change for your needs.

Pic. 3. Amplifier
This example was created in ConceptDraw DIAGRAM using the Electrical Engineering solution and shows the scheme of an amplifier.
The Circuits and Logic Diagrams produced with ConceptDraw DIAGRAM are vector graphic documents and are available for reviewing, modifying, converting to a variety of formats (image, HTML, PDF file, MS PowerPoint Presentation, Adobe Flash or MS Visio), printing and send via e-mail in one moment.
See also Samples:
NINE RELATED HOW TO's:
While creating flowcharts and process flow diagrams, you should use special objects to define different statements, so anyone aware of flowcharts can get your scheme right. There is a short and an extended list of basic flowchart symbols and their meaning. Basic flowchart symbols include terminator objects, rectangles for describing steps of a process, diamonds representing appearing conditions and questions and parallelograms to show incoming data.
This diagram gives a general review of the standard symbols that are used when creating flowcharts and process flow diagrams. The practice of using a set of standard flowchart symbols was admitted in order to make flowcharts and other process flow diagrams created by any person properly understandable by other people. The flowchart symbols depict different kinds of actions and phases in a process. The sequence of the actions, and the relationships between them are shown by special lines and arrows. There are a large number of flowchart symbols. Which of them can be used in the particular diagram depends on its type. For instance, some symbols used in data flow diagrams usually are not used in the process flowcharts. Business process system use exactly these flowchart symbols.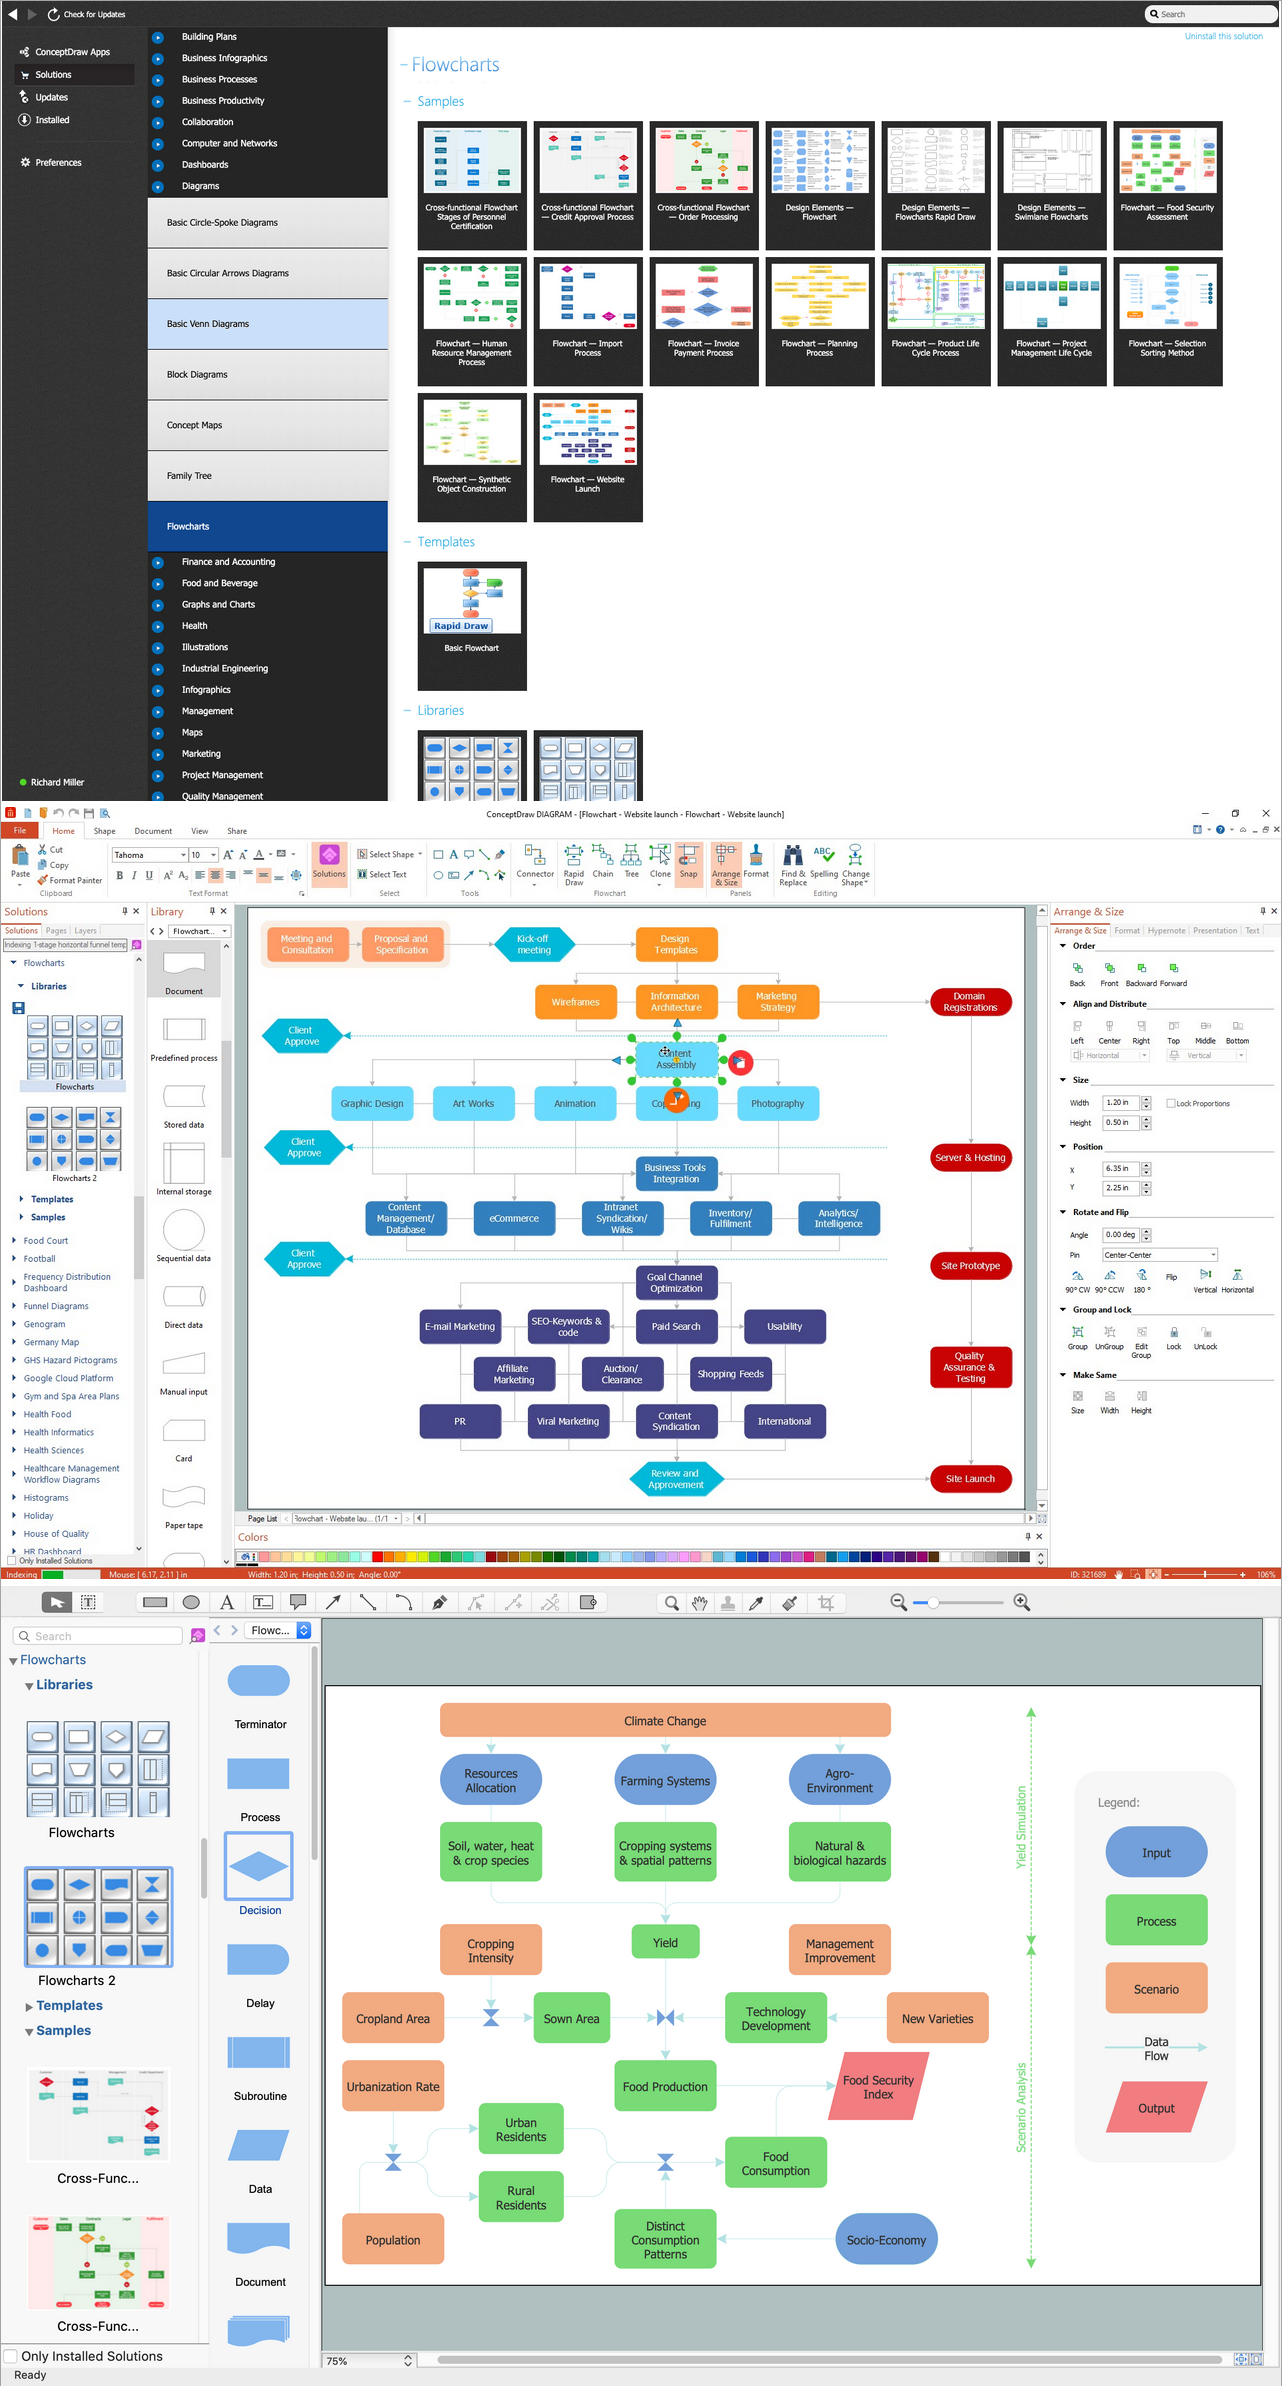
Picture: Flowchart Symbols: Meaning and Examples
Related Solution:
Nodes of any computer network are somehow organized in a hierarchy or a layout. Some of the common layouts like star network topology are more reliable and some like ring topology withstand high loads better. It is also important to distinguish logical topologies from physical.
This diagram represents a typical view of the star network topology. The star network topology is one of the most frequently used network topologies in the majority of office and home networks. It is very popular because of its low cost and the easy maintenance. The plus of the star network topology is that if one computer on the local network is downed, this means that only the failed computer can not send or receive data. The other part of the network works normally. The minus of using star network topology is that all computers are connected to a single point-switch, or hub. Thus, if this equipment goes down, the whole local network comes down.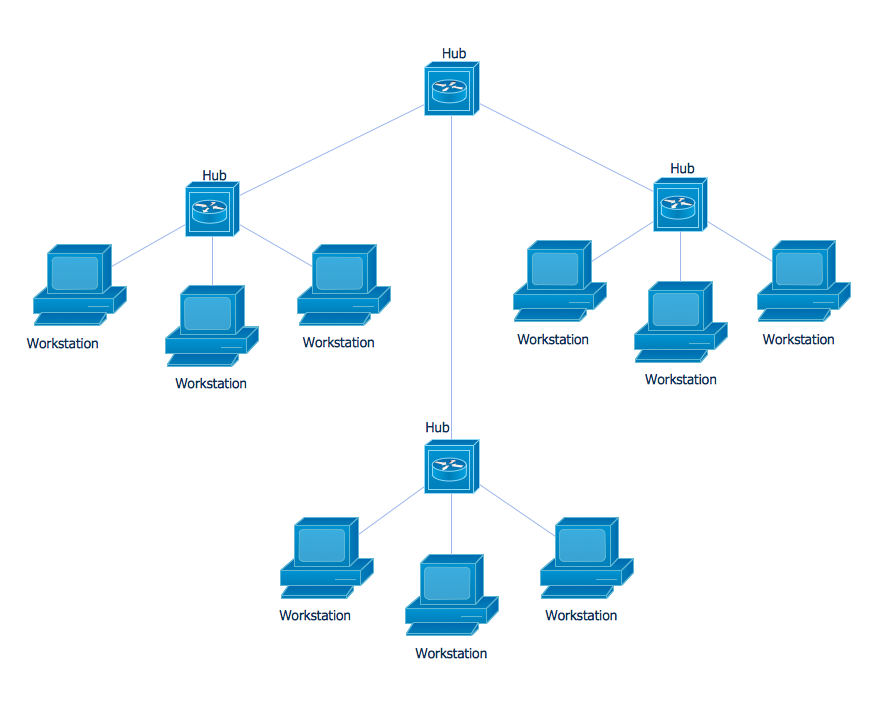
Picture: Star Network Topology
Related Solution:
A flowchart is a simple but very functional tool when it comes to understanding a workflow or to removing unnecessary stages from a process. When drawing flowcharts, keep in mind that there are four common types of flowcharts, like document flowcharts and data flowcharts that show control over a data or document flow over a system. To show controls on a physical level, use system flowcharts. In addition, to show controls in a program, you can draw a program flowchart.
This flowchart diagram represents the piece of an article editing process, that involves the author and editor. It was created using the Basic Flowchart notation that consists from the basic flowchart symbols. The start and the end of the process are indicated with "Terminator" symbols. The "Process" symbols show the action steps consisting from making edits and searching for a compromise, when the author does not agree with the suggestions of the editor. The "Process" symbol is the general symbol in process flowcharts. The "Decision" symbol indicates a branching in the process flow. There are two branches indicated by a Decision shape in the current flowchart (Yes/No, Disagree/Agree). This basic flowchart can be used as a repeating unit in the workflow diagram describing the working process of some editorial office.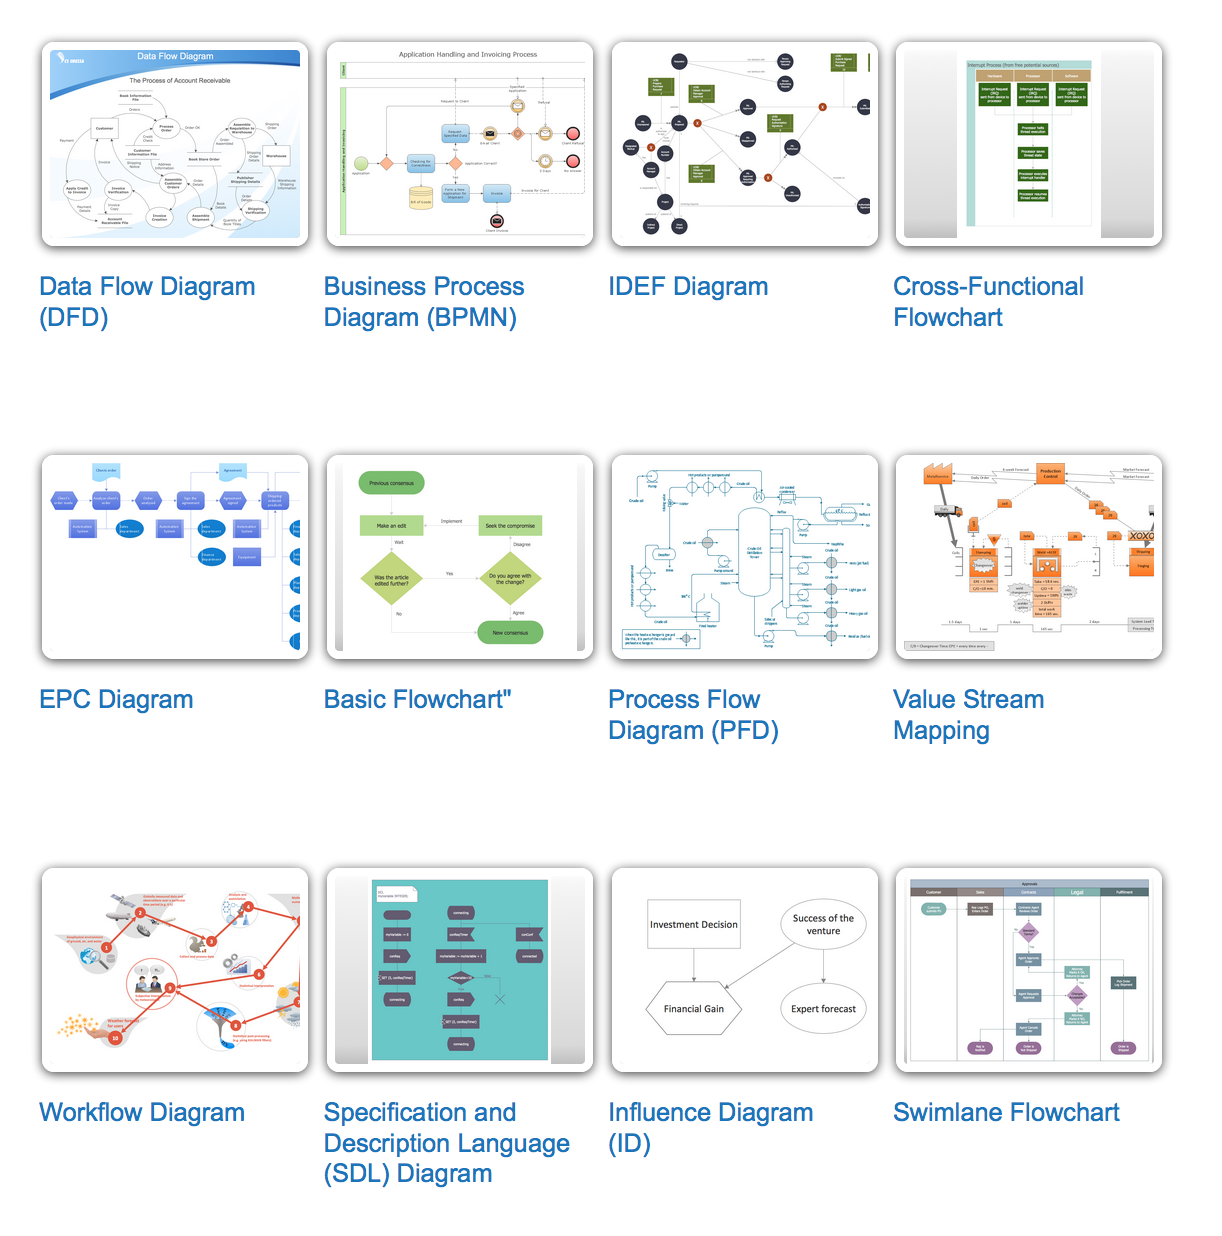
Picture: Types of Flowcharts
Related Solution:
ConceptDraw DIAGRAM diagramming and vector drawing software extended with Electrical Engineering Solution from the Industrial Engineering Area of ConceptDraw Solution Park affords you the easiest and fastest way for designing professional looking Electrical Schematics.
Picture: Electrical Schematics
Related Solution:
Variable delay elements are often used to manipulate the rising or falling edges of the clock or any other signal in integrated circuits. Delay elements are also used in delay locked loops and in defining a time reference for the movement of data within those systems.
26 libraries of the Electrical Engineering Solution of ConceptDraw DIAGRAM make your electrical diagramming simple, efficient, and effective. You can simply and quickly drop the ready-to-use objects from libraries into your document to create the electrical diagram.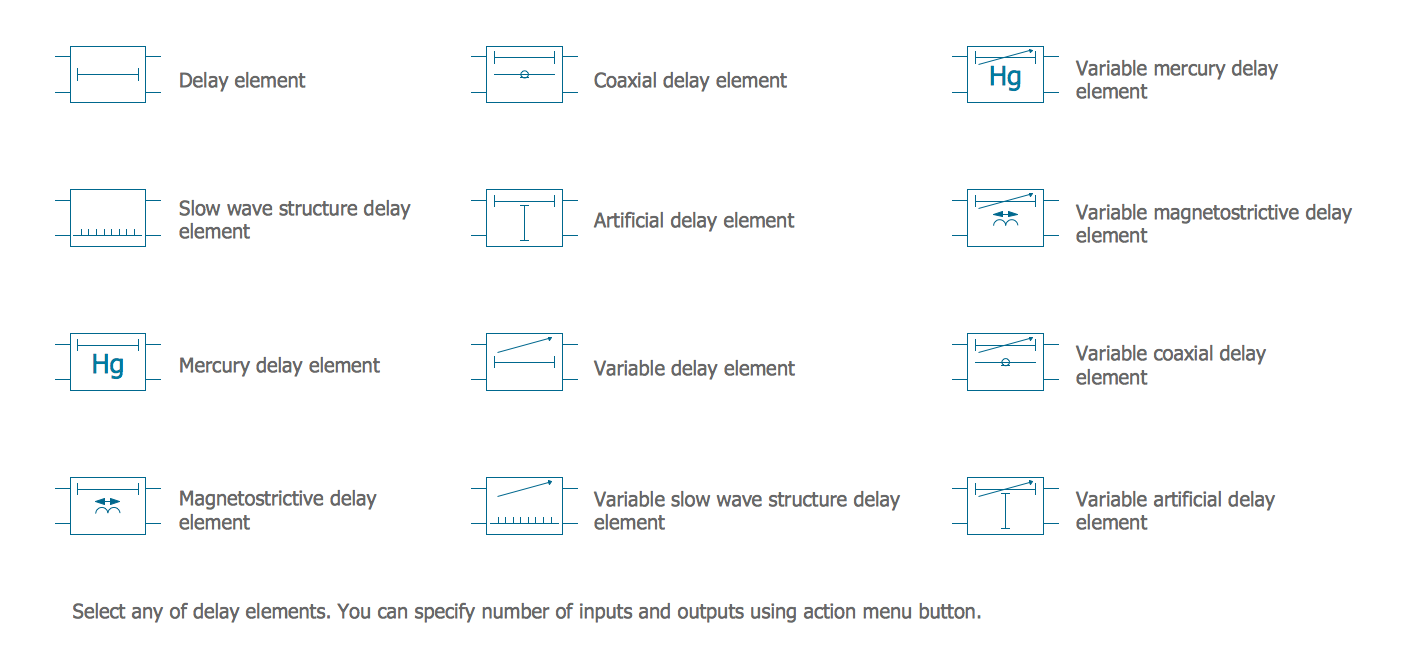
Picture: Electrical Symbols — Delay Elements
Related Solution:
Wiring and circuit diagrams use special symbols recognized by everyone who uses the drawings. The symbols on the drawings show how components like resistors, capacitors, inductors, switches, lamps, acoustic devices, measuring devices and other electrical and electronic components are connected together.
26 libraries of the Electrical Engineering Solution of ConceptDraw DIAGRAM make your electrical diagramming simple, efficient, and effective. You can simply and quickly drop the ready-to-use objects from libraries into your document to create the electrical diagram.
Picture: Electrical Symbols — Lamps, Acoustics, Readouts
Related Solution:
Ultra high frequency (UHF) is the ITU designation for radio frequencies in the range between 300 MHz and 3 GHz, also known as the decimetre band as the wavelengths range from one meter to one decimetre. Radio waves with frequencies above the UHF band fall into the SHF (super-high frequency) or microwave frequency range. Lower frequency signals fall into the VHF (very high frequency) or lower bands. UHF radio waves propagate mainly by line of sight; they are blocked by hills and large buildings although the transmission through building walls is strong enough for indoor reception. They are used for television broadcasting, cell phones, satellite communication including GPS, personal radio services including Wi-Fi and Bluetooth, walkie-talkies, cordless phones, and numerous other applications.
26 libraries of the Electrical Engineering Solution of ConceptDraw DIAGRAM make your electrical diagramming simple, efficient, and effective. You can simply and quickly drop the ready-to-use objects from libraries into your document to create the electrical diagram.
Picture: Electrical Symbols — VHF UHF SHF
Related Solution:
A causal model is an abstract concept, that describes the causal mechanisms of a system, by noting certain variables and their influence on each other, in an effort to discover the cause of a certain problem or flaw. This model is presented in diagram form by using a fishbone diagram.
ConceptDraw DIAGRAM diagramming and vector drawing software enhanced with Fishbone Diagrams solution helps you create business productivity diagrams from Fishbone diagram templates and examples, that provide to start using of the graphic method for the analysis of problem causes. Each predesigned Fishbone Diagram template is ready to use and useful for instantly drawing your own Fishbone Diagram.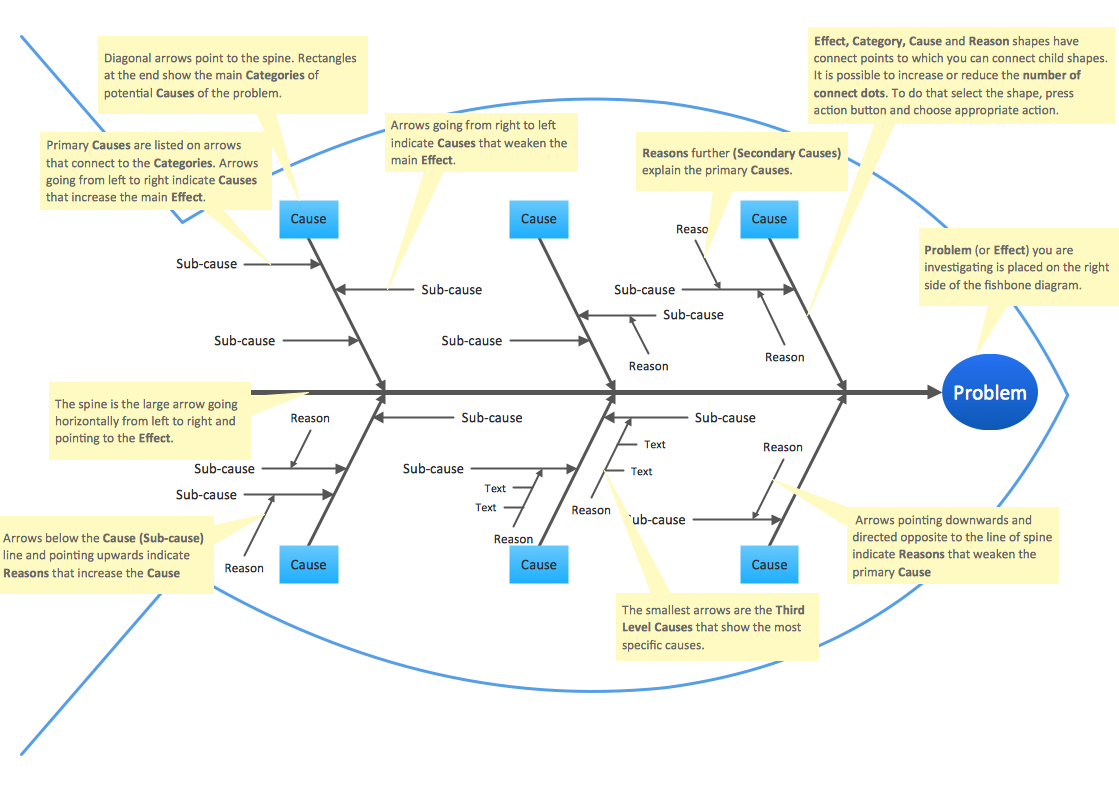
Picture: Fishbone Diagram Template
Related Solution:
Rack Diagrams visualize the rack mounting of computer and network equipment as the drawing of frontal view of the rack with equipment installed. They are used for choosing the equipment or racks to buy, and help to organize equipment on the racks virtually, without the real installation.
Network Diagramming Software - ConceptDraw DIAGRAM is perfect for software designers and software developers who need to draw Rack Diagrams._Win_Mac.png)
Picture: Network Diagramming Software for DesignRack Diagrams
Related Solution:

