Example 1. Circular Flow Diagram Template
The circular flow diagram template is included in Business Diagrams Solution for ConceptDraw Solution Park and is available from ConceptDraw STORE. You need only open it and fill to get the excellent result in a few minutes.

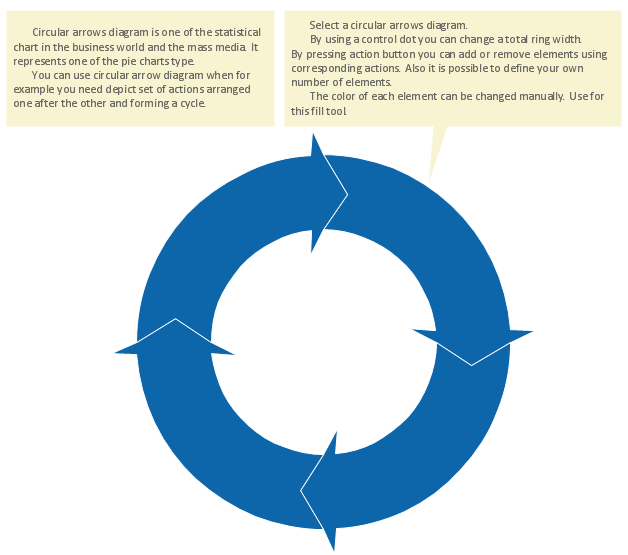
Example 2. Circular Arrows Diagram - SDLC
This sample was created in ConceptDraw DIAGRAM on the base of circular flow diagram template from the Business Diagrams solution. It shows the circular arrows diagram which illustrates the Systems Development Life Cycle (SDLC). An experienced user spent 5 minutes creating this sample.
Use the circular flow diagram template to create your own circular flow diagrams and circular arrows diagrams quick, easy and effective in ConceptDraw DIAGRAM.
All source documents are vector graphic documents. They are available for reviewing, modifying, or converting to a variety of formats (PDF file, MS PowerPoint, MS Visio, and many other graphic formats) from the ConceptDraw STORE. The Business Diagrams Solution is available for all ConceptDraw DIAGRAM or later users.
TEN RELATED HOW TO's:
Automatically create a presentation-quality diagram in one click with ConceptDraw DIAGRAM.
Picture: Visual Presentations Made Easy with Diagramming Software
Related Solution:
UML Component Diagrams are used to illustrate the structure of arbitrarily complex systems and illustrates the service consumer - service provider relationship between components.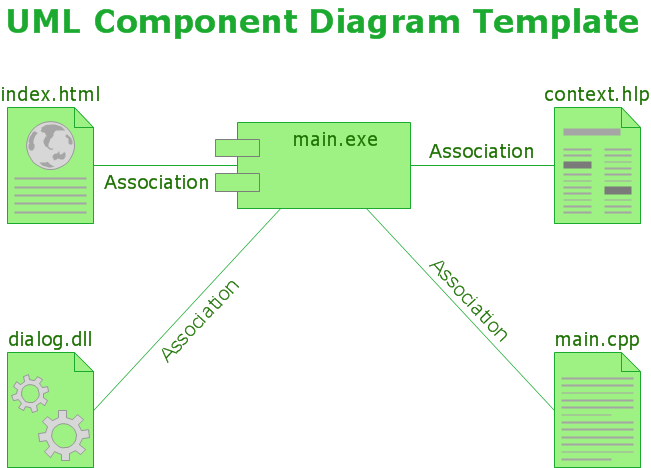
Picture: UML Component Diagram
ConceptDraw DIAGRAM is a drawings software for creating Nature scenes. Nature solution from ConceptDraw Solution Park expands this software with a new library that contains 17 vector objects and samples illustration files.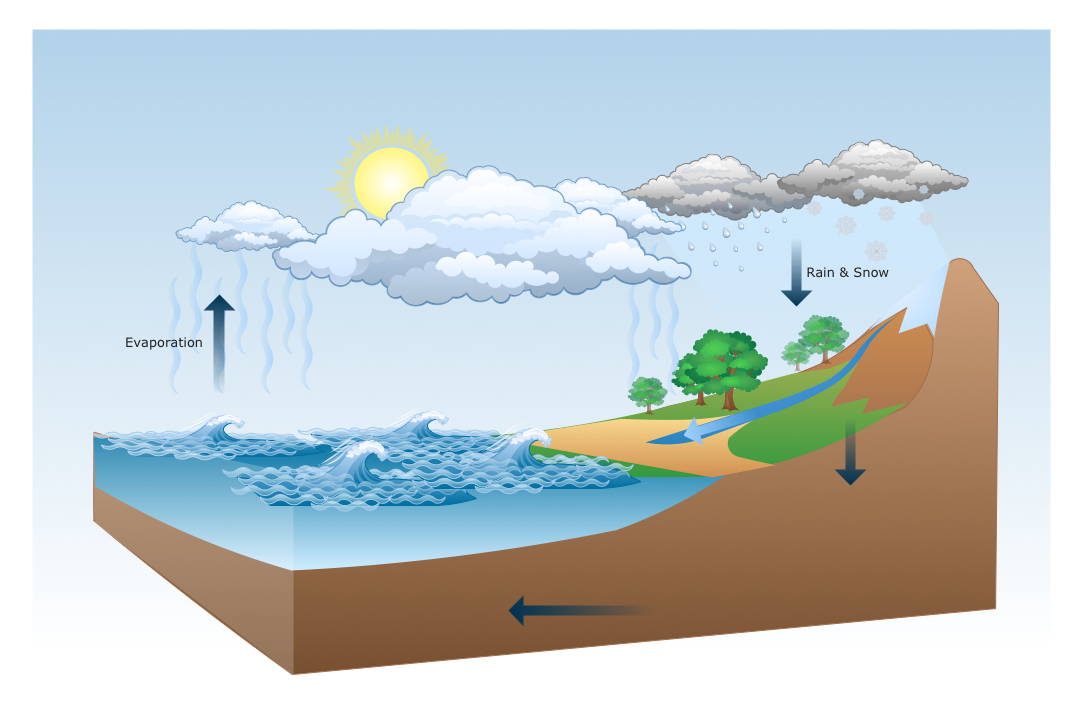
Picture: Drawing a Nature Scene
ConceptDraw PROJECT contains an extensive tool set to help project managers. The rich data visualization capability that is provided by ConceptDraw products helps you create project dashboards, one-click reports, multi-project views, Gantt charts, and resource views. Let′s learn how to get maximum value using ConceptDraw PROJECT!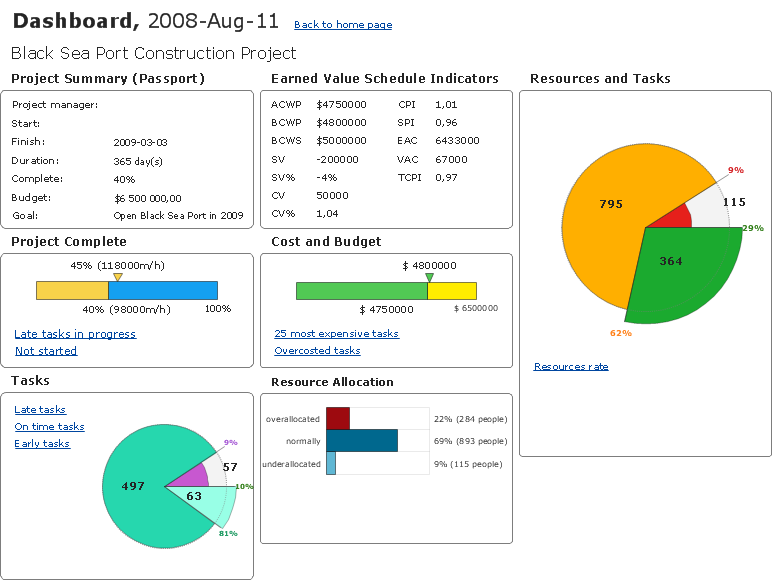
Picture: How To Create Project Report
Accounting Data Flow from the Accounting Flowcharts Solution visually describes the financial accounting process, shows the accumulated information about transactions and events for creating the balance sheet and the final income statement.
Accounting Flowcharts Solution contains also a wide variety of templates and samples that you can use as the base for your own Accounting Flowcharts of any complexity.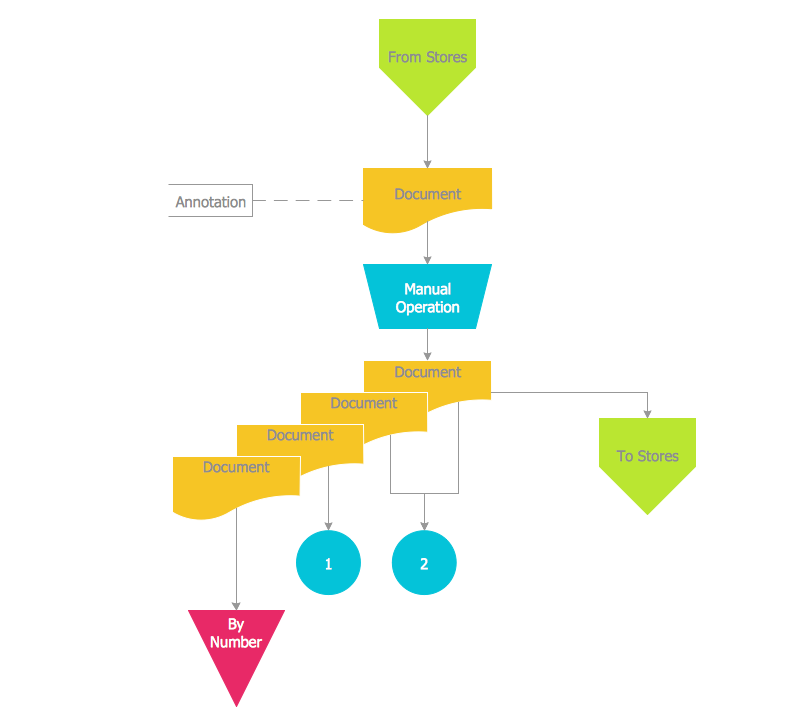
Picture: Accounting Data Flow from the Accounting Flowcharts Solution
Related Solution:
ConceptDraw MINDMAP an Alternative to MindJet MindManager - The power, economy, and versatility of ConceptDraw MINDMAP takes personnel and team productivity to another level. Discover today what this means to you.
Picture: Why People Select ConceptDraw MINDMAP
Related Solution:
Social media is a popular view of mass communication which allows people, companies and organizations create, share, discover, modify, access, comment, discuss and exchange information through the Internet. Social Media Response solution for ConceptDraw DIAGRAM provides collection of 10 libraries with diversity of predesigned vector social media flowchart symbols for fast and easy creating interactive Social Media Flowcharts, Response Charts and Action Mind Maps.
Picture: Social Media Flowchart Symbols
Related Solution:
This sample shows the Scatter Plot without missing categories. It’s very important to no miss the data, because this can have the grave negative consequences. The data on the Scatter Chart are represented as points with two values of variables in the Cartesian coordinates. This sample can be used in the engineering, business, statistics, analytics, at the creating the financial and other types of reports.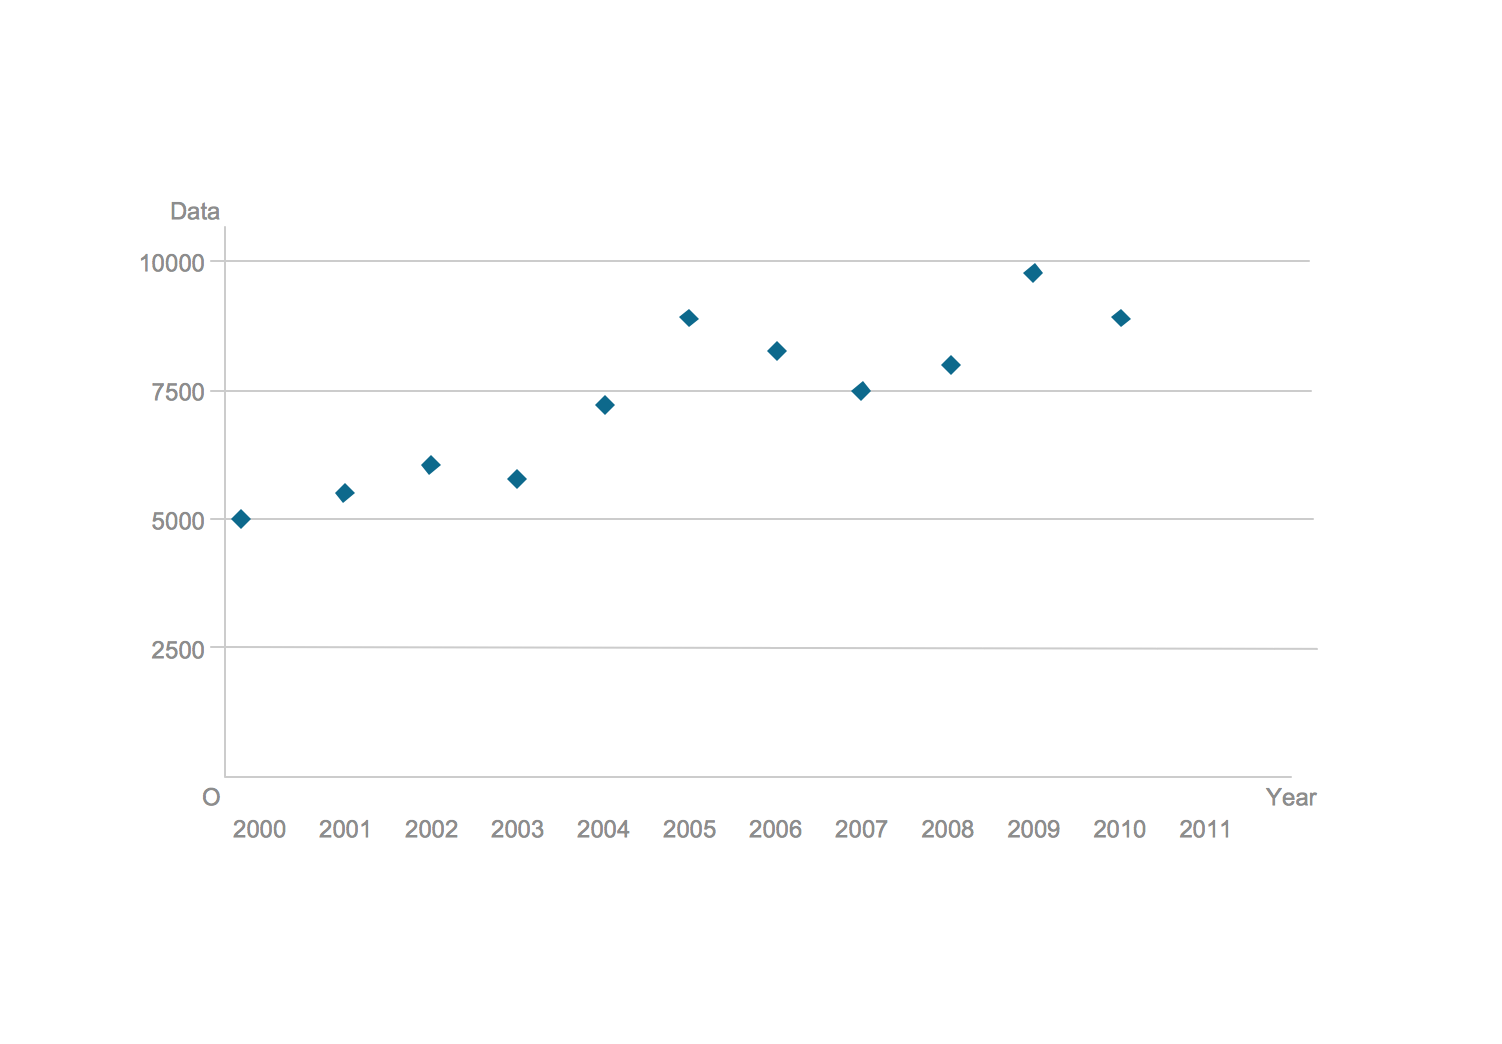
Picture: Blank Scatter Plot
Related Solution:
ConceptDraw DIAGRAM diagramming and vector drawing software enhanced with Fishbone Diagrams solution from the Management area of ConceptDraw Solution Park gives the ability to draw Fishbone diagram, which identifies many possible causes for an effect for problem solving. Fishbone Diagram procedure of creation includes the set of steps easy for execution in ConceptDraw DIAGRAM.
Picture: Fishbone Diagram Procedure
Related Solution:
This sample shows the Bar Chart of the leverage ratios for two major investment banks. The leverage ratio is the ratio of the total debt to the total equity; it is a measure of the risk taken by the bank. The higher of the leverage ratio denotes the more risk, the greater risks can lead to the subprime crisis.
Picture: Financial Comparison Chart
Related Solution:
