Column Chart Software
Making a chart from a scratch has become truly simple nowadays as the ConceptDraw DIAGRAM diagramming and drawing application has been developed by a team of the IT specialists of CS Odessa.
Making a chart or a graph, that is known to be a graphical representation of some data, including the column one can be done within only a few minutes as long as the ConceptDraw DIAGRAM and the ConceptDraw STORE applications are downloaded from this site and so the Bar Graphs solution is being used.

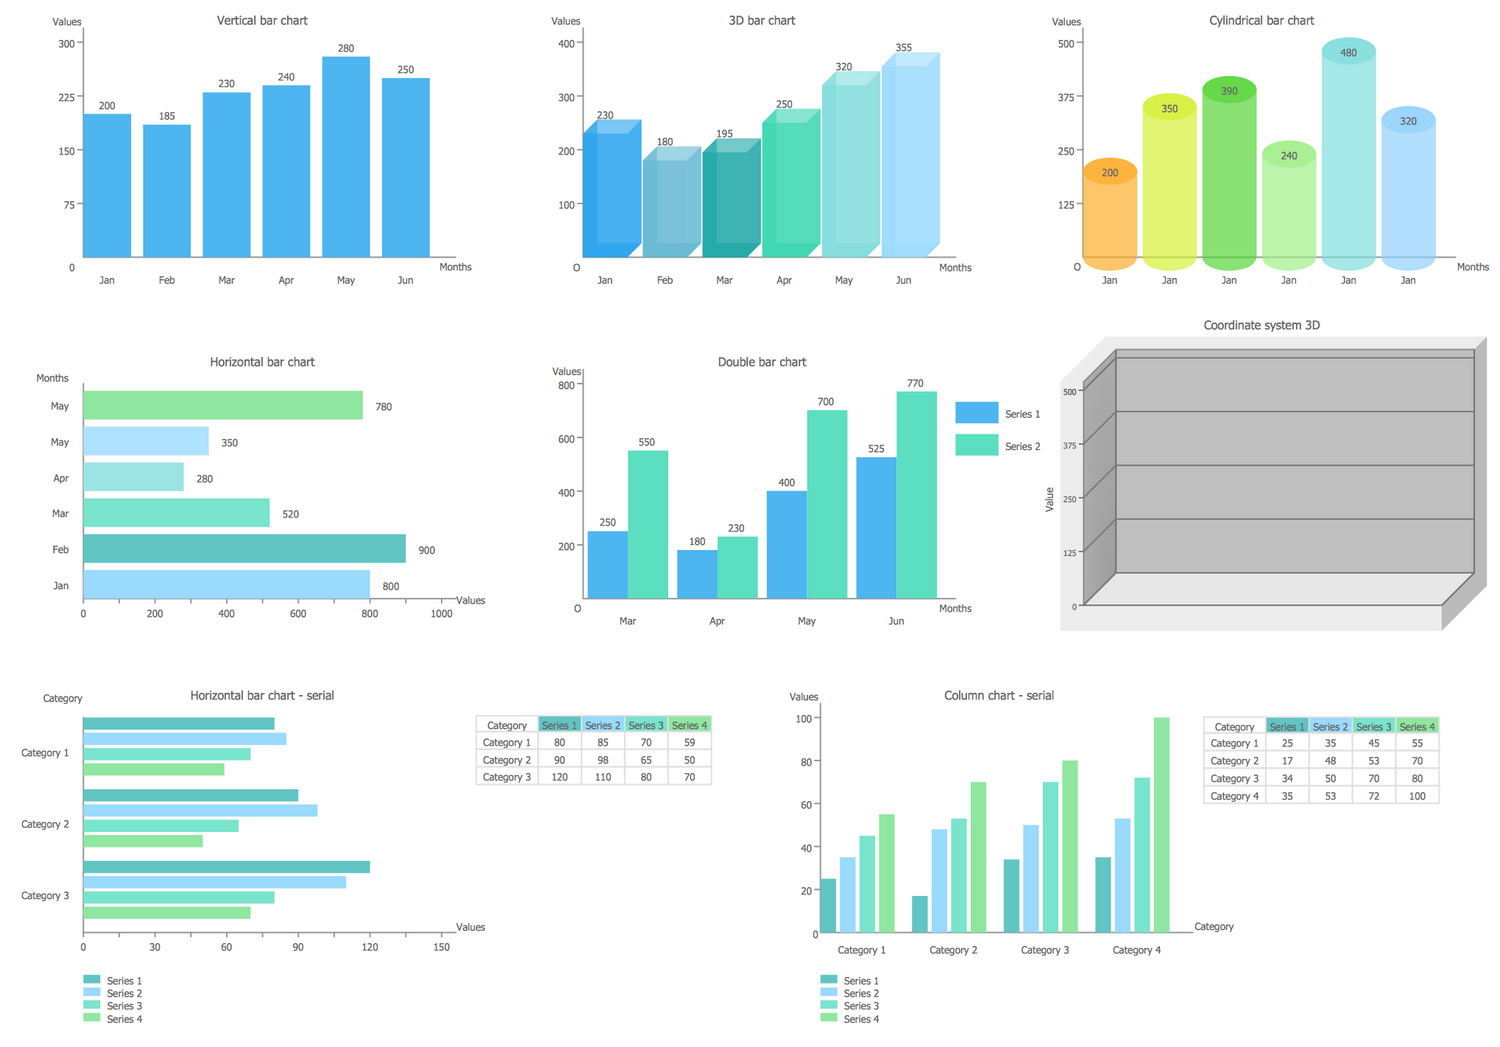
Bar charts library shapes:
The data can be represented by symbols, such as bars in a bar chart or a column chart, the lines in a line chart, or the slices in a pie chart and to make any of the mentioned drawings is always possible as long as the templates of the Bar Graphs solution are being used. Any chart can represent the functions, some kinds of qualitative structure or the tabular numeric data providing different info.

Vertical Bar Chart
The vertical bar graph is also known as column chart.
Horizontal Bar Chart
Horizontal bar graph is useful for comparison of many categories by one metric.
Double Bar Chart
Double bar graph is used for visualizing two data series.
3D Bar Chart
3D Bar graph is design variant of vertical bar graph.
Culindrical Bar Chart
Culindrical bar graph is another design variant of vertical bar graph.
Column charts
The term "chart" itself as a graphical representation of data is known to be having a few different meanings. Thus, any data chart is known to be a type of a graph or a diagram that represents and organizes some set of any qualitative or numerical data that is needed to be represented.
There may be also different maps that are adorned with some extra information being used for some specific purpose and being often known as charts. An example can be a so-called “nautical chart” or an “aeronautical chart” that is known to be usually spread over a few map sheets.
There are also some other specific constructs that can be sometimes called as charts, such as the chord one in the music notation or a record one for some album popularity. But most commonly the charts are used in order to ease an understanding of some large quantities of data.
The column charts may be created for a purpose of simplifying the understanding of the relationships between different parts of the same data mentioning them as the columns on a drawing.
Different charts can be usually read more quickly to compare to reading some raw data. Bing used in a wide variety of fields, such charts can be created either by hand or by computer using such charting application as a ConceptDraw DIAGRAM which enables its users to get the needed design elements from its stencil libraries as well as those which can be found in the Bar Graphs solution of the ConceptDraw STORE application that is known to be one of the drawing tools developed by CS Odessa.
There are certain types of charts that can be more useful in terms of presenting a given data set. Thus, that data that presents some percentages in the different groups can be displayed in a pie chart, but it can also be illustrated with the help of a horizontal bar chart that would be simpler to understand. Although, any data that represent different numbers changing over some definite period of time might be best shown with the aid of a line chart that can also be created in the ConceptDraw DIAGRAM diagramming and drawing application.

The main features of any chart include them being able to take a large variety of forms. Despite this fact, there are always some common features that can provide any chart with its ability to extract the needed meaning from data.
Any data that is contained in a chart is represented graphically and that is the reason why such drawings are that popular: the meaning of the data presented in such form of the pictures is much quicker and easier to understand to compare to reading the text. That is why the text is usually used only for annotating the data.
The data within any chart can appear in many different formats, including the textual labels that can be used for describing the datum. Such datum may be associated with the indicated position within the mentioned chart. The data may also appear as shapes or dots that are either connected or unconnected, as well as in any combination of patterns and colors, or the bars as in the bar charts also known to be called as the column ones. Points or inferences of interest can be overlaid directly on the graph in order to aid the information extraction.
Once some data appears in a chart, it contains different variables including a legend that is also known as a key. Any legend may contain a list of variables that may all appear in the chart being an example of their appearance. Such information may allow the data from each variable to be identified within the chart either it is a column or any other one.
Being column chart is a chart or graph that presents some categorical data using the rectangular bars with different heights or length that are proportional to the values that they represent, column charts are very popular and they all can be created with the help of a professional drawing as well as diagramming software — the ConceptDraw DIAGRAM one.
All the columns can be plotted either horizontally or vertically and the templates of both vertical and horizontal layouts of such column charts are available for all the ConceptDraw DIAGRAM users to be used once they are found in the Bar Graphs solution of the ConceptDraw STORE application that was developed by CS Odessa especially for simplifying work of creating different layouts for all the ConceptDraw DIAGRAM users.
Any column graph is known to be showing the comparisons among different discrete categories. One axis of the chart can show some specific categories that are being compared, and the other one may represent some measured value. Some of the column graphs may present the columns that are clustered in the groups of more than one, showing the values of more than one measured variable in this way.
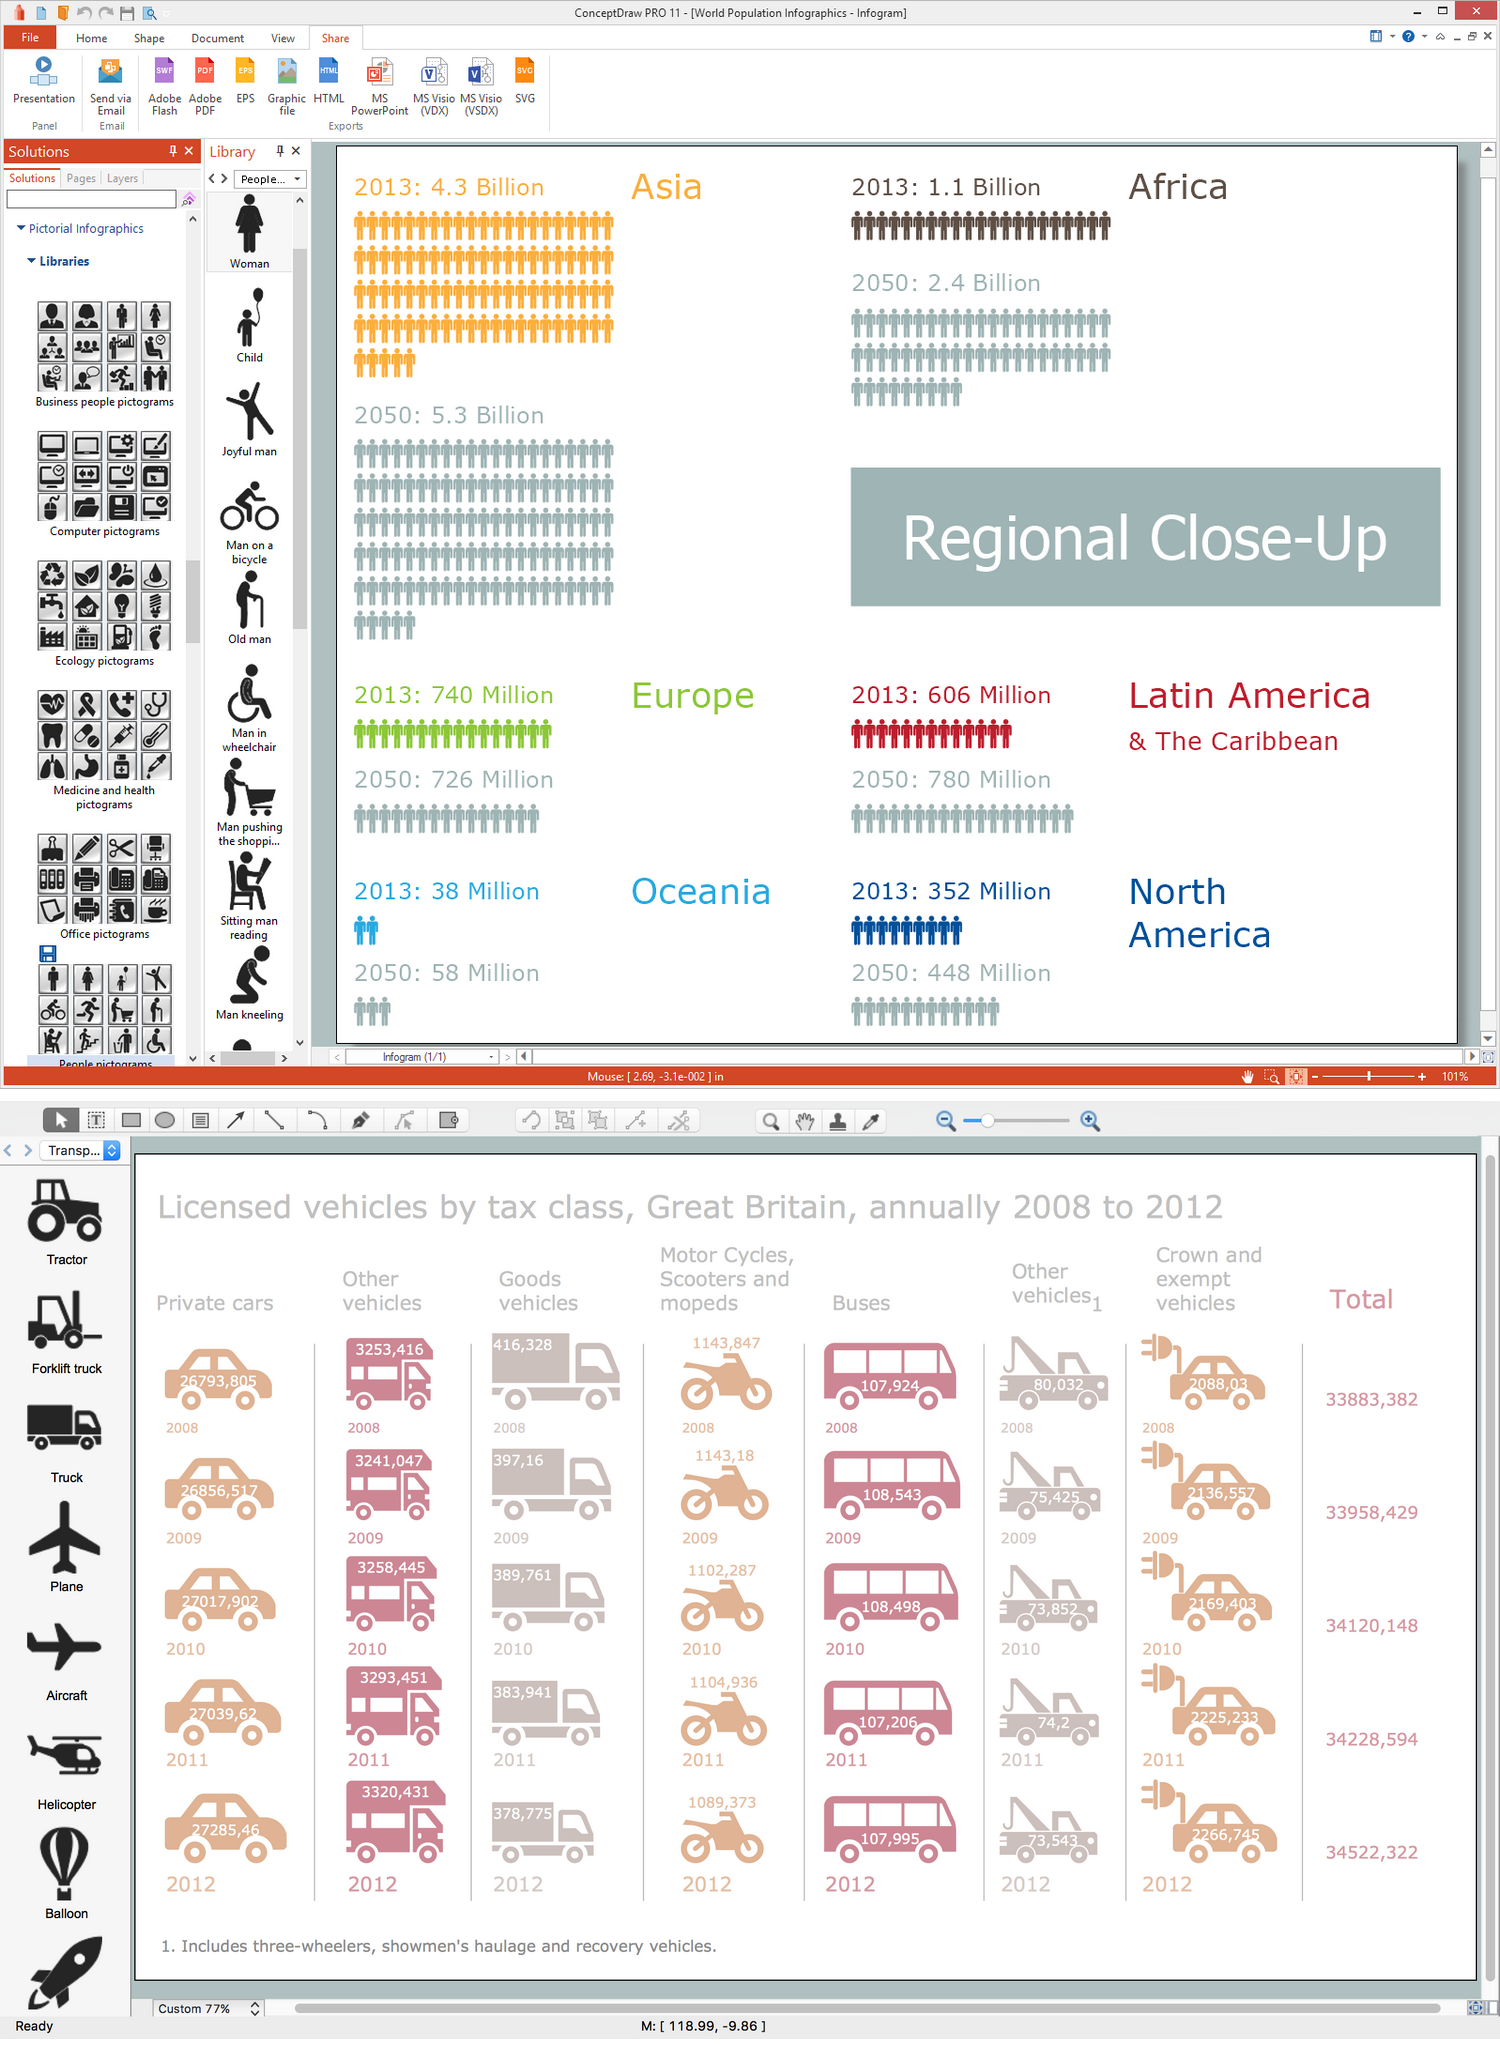
Free Download Column Chart Software and View All Examples

Example 1. Column chart example - Iran internet users per 100 person.
More Related Diagrams:
- Bar Chart Software
- Line Graph Charting Software
- Pie Chart Software
- Pyramid Diagram and Pyramid Chart
- Scatter Graph Charting Software


