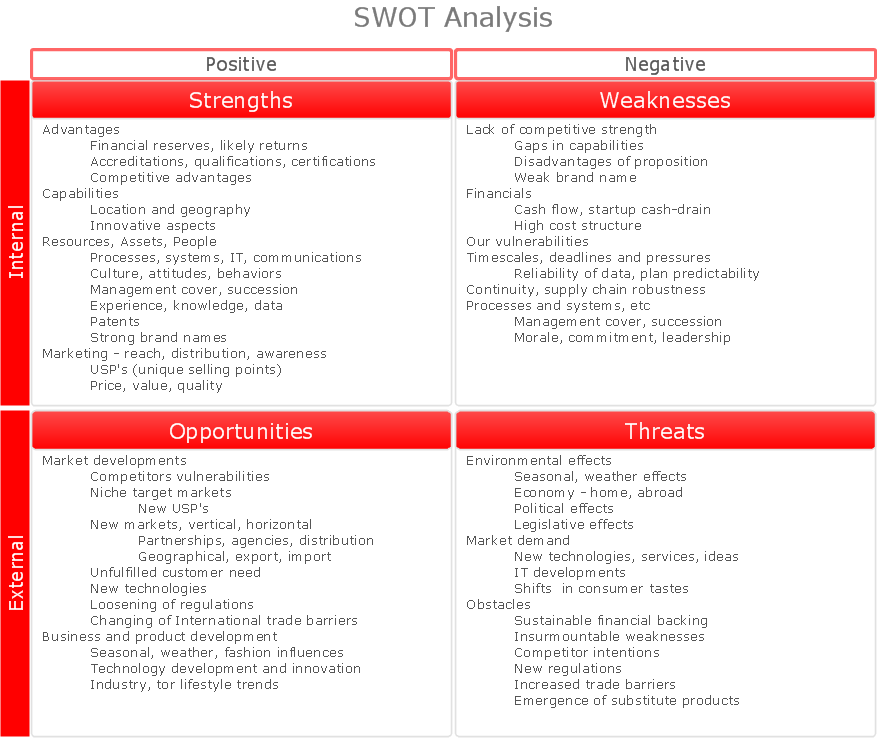
COM and OLE Diagram
OLE is an acronym for Object Linking and Embedding which is known to be simply a proprietary technology that was developed by “Microsoft Corporation” allowing both linking and embedding to all documents as well as many other objects, which are known to be implemented on top of the so called “Component Object Model” as well as OLE containers.
The mentioned objects can always implement the interfaces to export their functionality. There’s only interface that is compulsory — the “OleObject” one, when all other interfaces may also need to be implemented in case the functionality exported by such interfaces is required at all.
Some of the terminology may have to be explained for the purpose of easing the understanding of what follows. The “view status” of any object means the status clarifying if this object is transparent or opaque. It also may help to represent if it supports any drawing with a definite aspect. The site of an object is a representing an object the location of the object in its container that supports a site object for every single object that is contained.
“DataObject” is known to be one of the main objects within the Object Linking and Embedding processes. After its implementation, it enables data’s transfer as well as notifies about any changes made in data. DataObject must be implemented by those objects that are there to support the “drag-and-drop”, that are pasted from or copied to the clipboard. The last mentioned objects are known to be embedded or linked in a containing document, while another object named the “ObjectWithSite” allows the caller to inform the “OLE object” of its site. The very same functionality can be also provided by another object — “OleObject”.
“OleCache” object allows different visual presentations from a so called “DataObject” to be cached, allowing an embedded object for store its representation, the visual one. It can be done by enabling it to be displayed without needing of starting the application which was previously used for creating the object. At the same time a later version of previously mentioned object — OleCache2 — provides more fine-grained control over the process of caching.
“OleCacheControl” is an interface not called by the container, but by the object for allowing it to receive the needed notifications of when its other object — a “DataObject” one is running, allowing it to subscribe to the different notifications of the data changes of that object. In the described way it allows to update the cached presentation in a proper way.
The “OleDocument” object allows the Object Linking and Embedding object to support many different views of its data and a few related functions, while an “OleDocumentView” is a document object implementing this interface for every view and so allowing the caller to set the site of the query, object as well as to set the size of that particular object, showing and activating it and some of the related functions. “OleInPlaceActiveObject” was called by the outermost container of an object for interacting with it while it's active. For example, there’s a need of processing the so called “accelerator keys” in the container's message queue which are meant for the contained object.
Another object used within the Object Linking and Embedding processes is a windowless one named as a “IOleInPlaceObjectWindowless” one. It is an object which does not have its own window. Instead, it is displayed in its own container's window, being used by the container for relaying all the messages received by the “container's window”. All the mentioned messages are known to be intended for the contained object. “OleLink” allows any object to support the linking and “OleObject” is arguably the most important interface for any other object within the Object Linking and Embedding activities.
At the same time, another сonstituent of the Object Linking and Embedding process is a “ViewObject”. It allows any object to draw itself directly. Thus, there’s no more need left to passs a “DataObject” to the container. For all the objects supporting both DataObject and DataObject interface, the underlying implementation is known to be usually shared. “ViewObject2” allows the caller to query the size of the object and “ViewObjectEx” adds the needed support for any flicker-free drawing of the transparent objects.
There are many other objects which are used within the processes of Object Linking and Embedding and those who know enough to be able to create their own Object Linking and Embedding diagram must know all of them, although to be able to make such diagram quick and so to spend your time more efficiently, you can always use simply a professional software that was developed especially for such purposes — to make it much simpler to create any needed diagram, including the OLE one. This software is a ConceptDraw DIAGRAM diagramming and drawing one available for being downloaded from this site as well as another application as an extension to the mentioned one — ConceptDraw STORE. Getting ConceptDraw STORE means ensuring yourself in making it possible to draw any OLE diagram within only a few hours or even minutes, depending how good (familiar) you are with the mentioned tools already.
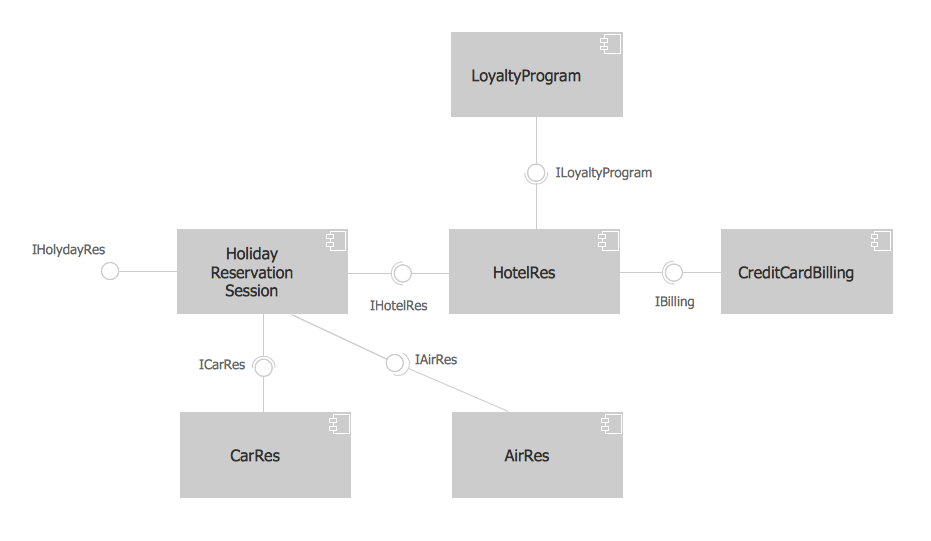
You can also, apart from making any OLE diagram, create a COM one using the solution from ConceptDraw STORE named as a “Software Engineering” one. Having all fifteen design symbols of both the COM and the OLE objects from the mentioned solution will enable you to create any needed Object Linking and Embedding diagram as well as any needed COM diagram, including the conceptual diagram of COM aggregation presented on this page as an example of what it is possible to make in ConceptDraw DIAGRAM software.
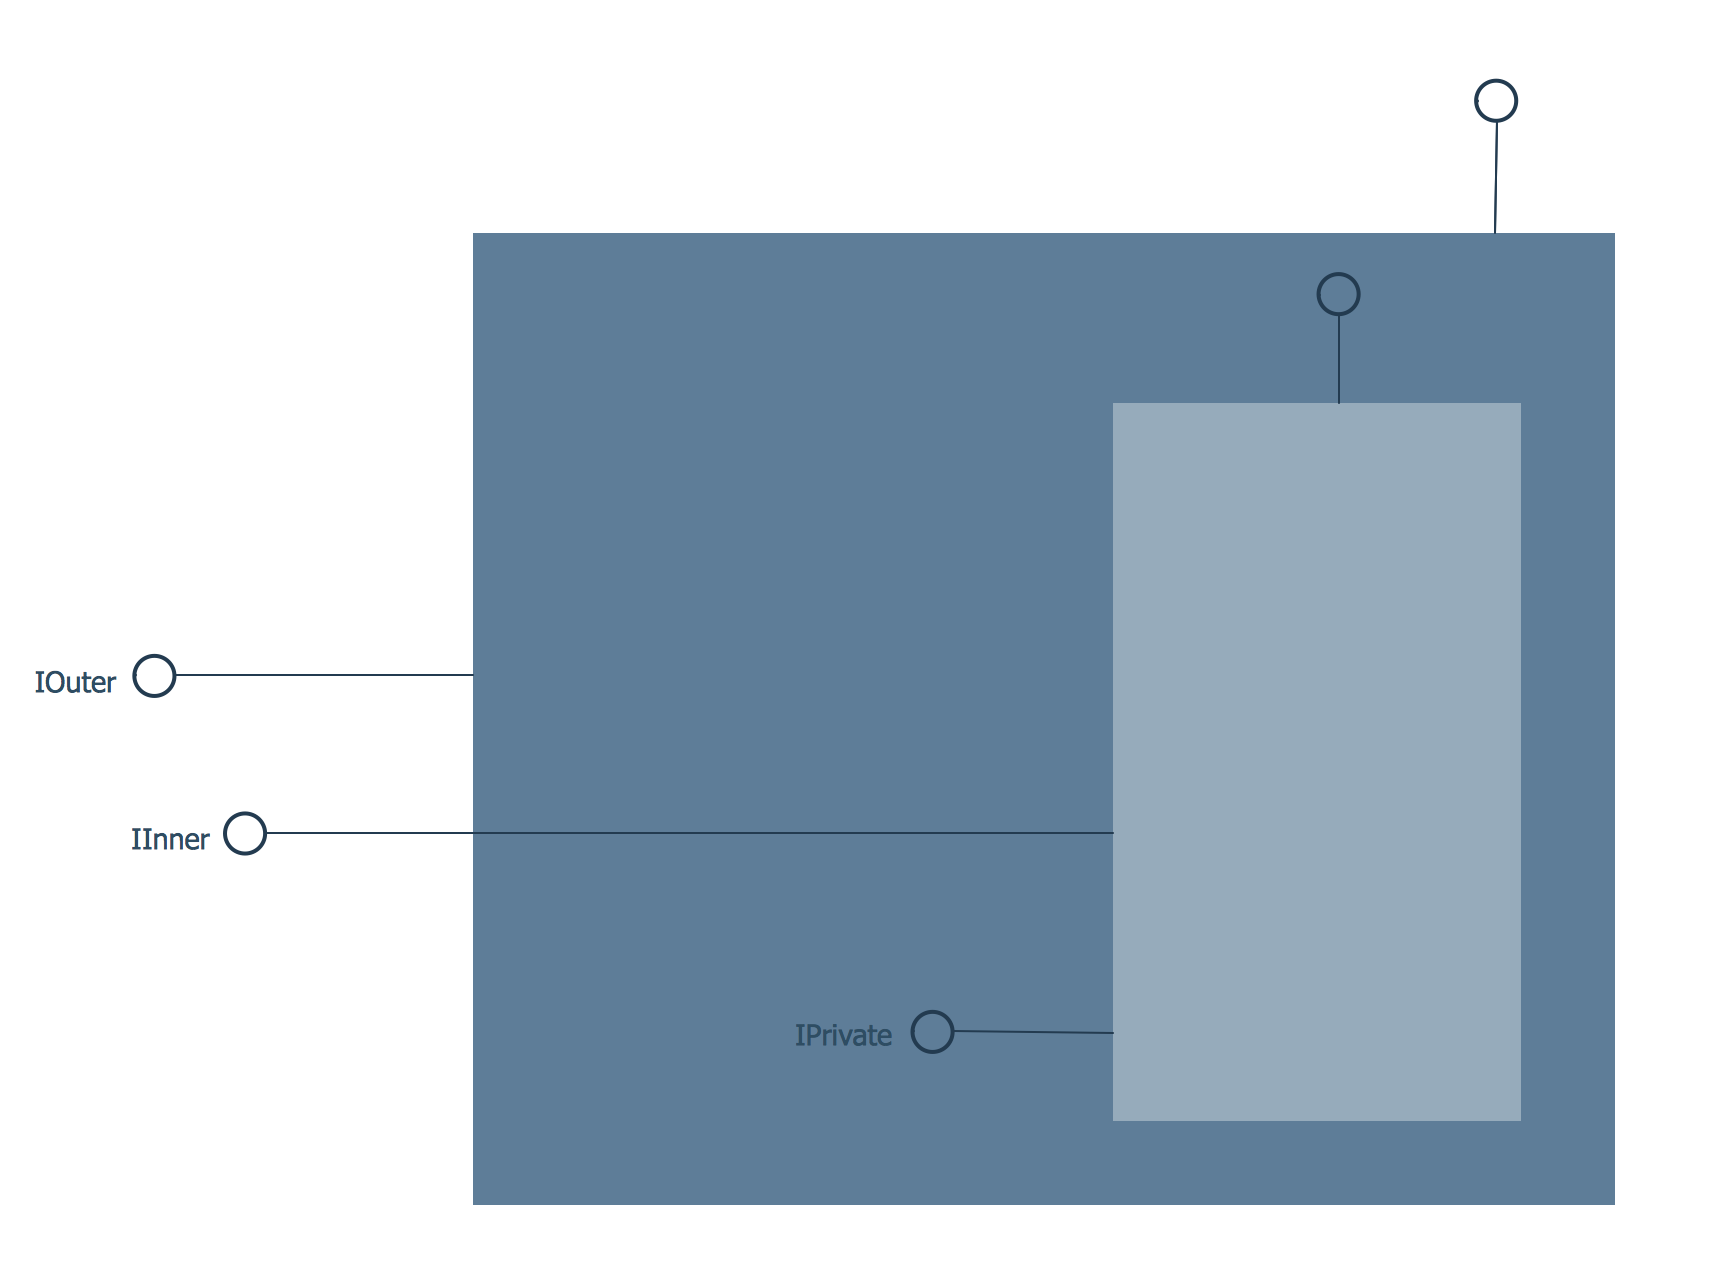
Example 1. Command OLE Aggregation Diagram (COM OLE)
The example above shows a conceptual diagram of COM aggregation. "The outer object exports an interface of the inner object called IInner, and an interface of its own, called IOuter, but it doesn't export IPrivate. The little interfaces on the top right of the objects represent the IUnknown interfaces of the objects. Since calling IUnknown methods on any interface of the inner object returns either an interface of the outer object, or an interface whose IUnknown methods call the IUnknown methods of the outer object, the outer object is the only object that has access to the IUnknown interface of the inner object."
[Unified Modeling Language. Wikimedia.Commons]
ConceptDraw DIAGRAM is a perfect tool for:
- Designing and planning tasks such as:
- Jacobson Use Cases Diagram
- SSADMN Diagram
- Yourdon and Coad Diagram
- Block Diagrams
- Data Modeling Diagram
- SysML Diagram
- Chen RED Diagram
- Martin RED Diagram
- IDEF0 Diagram
- Booch OOD Diagram
- Gane Sarson Diagram
- Memory Object Diagram
- Data Flow Diagram
- FlowCharts
- Graphic User Interface (GUI)
- UML Diagram
- Program Structure Diagrams
- ORM Diagram
- Developing Visualization Solutions
- Project Planning (Gantt Charts, Timelines, Project Schedules)