When you prepare professional-looking presentation, you need to use ConceptDraw MINDMAP software for the amazing result. It is the advanced tool for representing data gives you ability to effectively generate, change, and update your presentation. In ConceptDraw MINDMAP there are different demonstration capabilities for viewing and sharing your presentation.
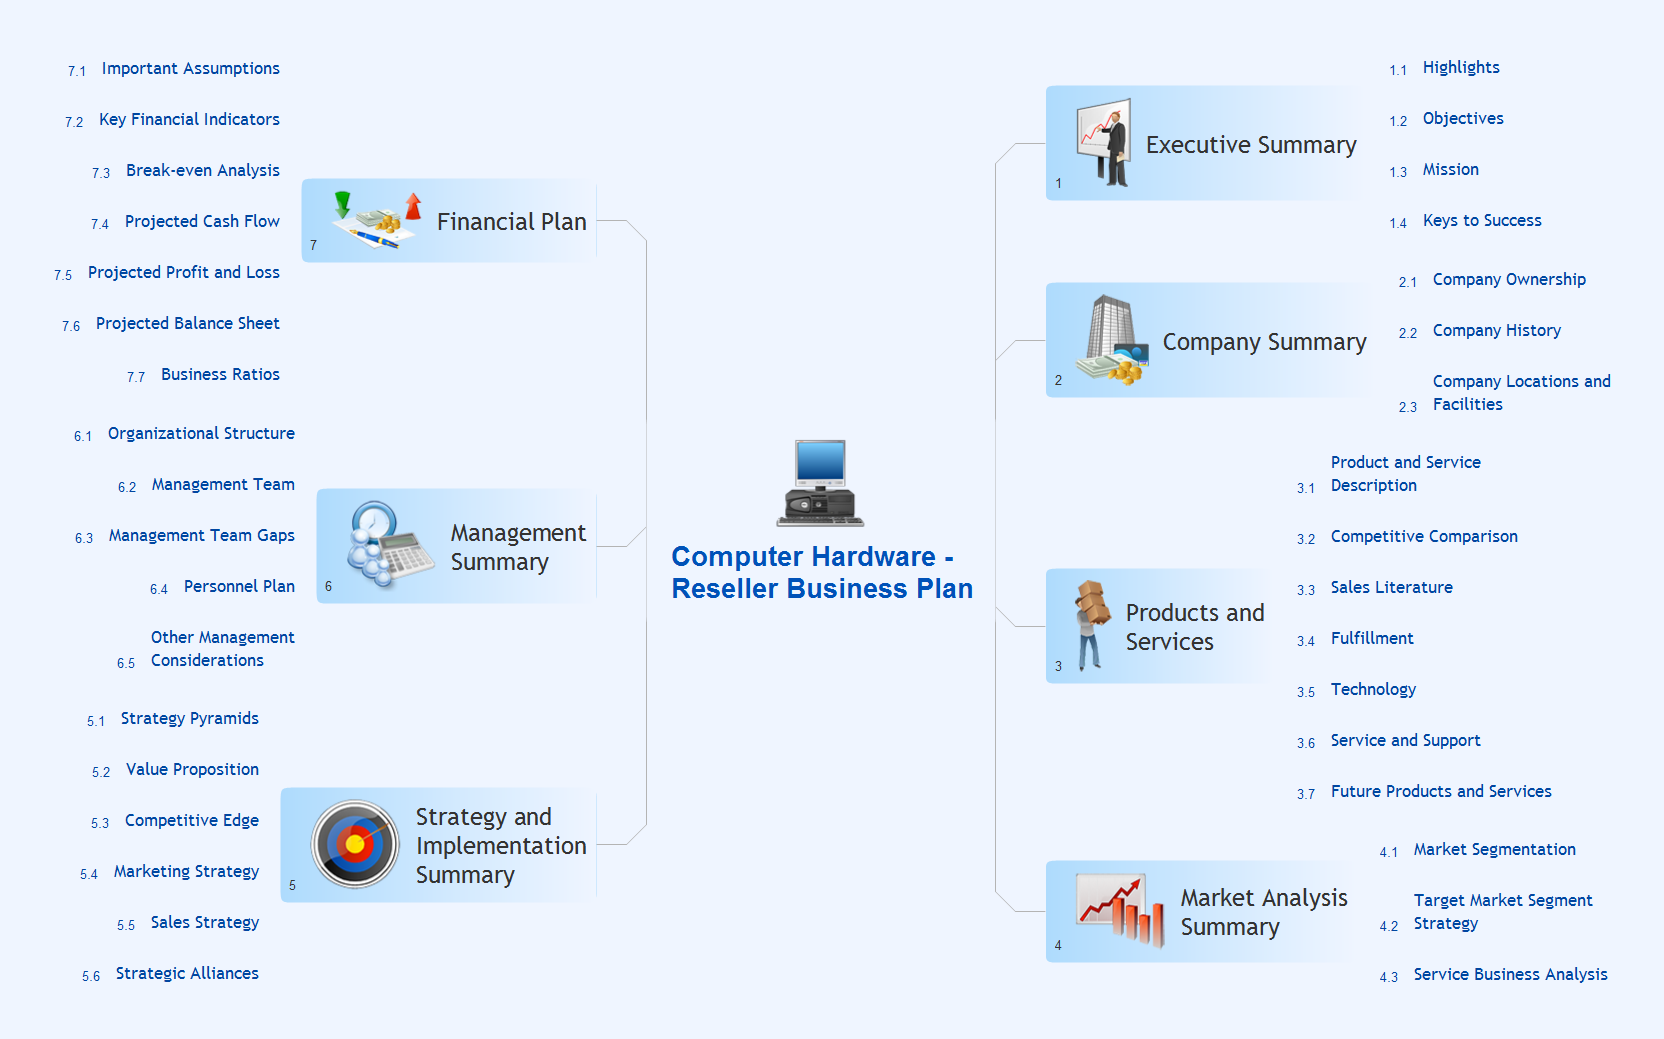
Sample 1. Mindmap presentation — Computer reseller business plan.
Presentation Exchange solution extends ConceptDraw MINDMAP software with the ability to import presentations from Microsoft PowerPoint, as well as enhancing its existing presentation capabilities.
With the Presentation Exchange solution you can easily extract the content from a PowerPoint presentation to see how it all fits together in a single view. You can review slide content, see how the slides support one another, and refine the story.
ConceptDraw DIAGRAM - business process modeling software for mac offers the Business Process Diagram Solution with powerful tools to help you easy represent the business processes and create the business process diagrams based on BPMN 1.2 and BPMN 2.0 standards that allows to create of both simple and complex (nested) models of processes.
There are 16 BPMN 1.2 and BPMN 2.0 stencil libraries containing 230 vector objects: Rapid Draw library, Connections library, Gateways and Artifacts libraries, Data library, Gateways library, Choreographies library, Conversations library, Activities libraries, Events libraries, Expanded Objects libraries, Swim lanes libraries.
Picture: Business Process Modeling Software for Mac
The SWOT Analysis solution from the Management area of ConceptDraw Solution Park contains set of examples, templates and vector design elements of SWOT and TOWS matrices. It helps you to quickly draw SWOT and TOWS analysis matrix diagrams using the best SWOT matrix software ConceptDraw DIAGRAM.
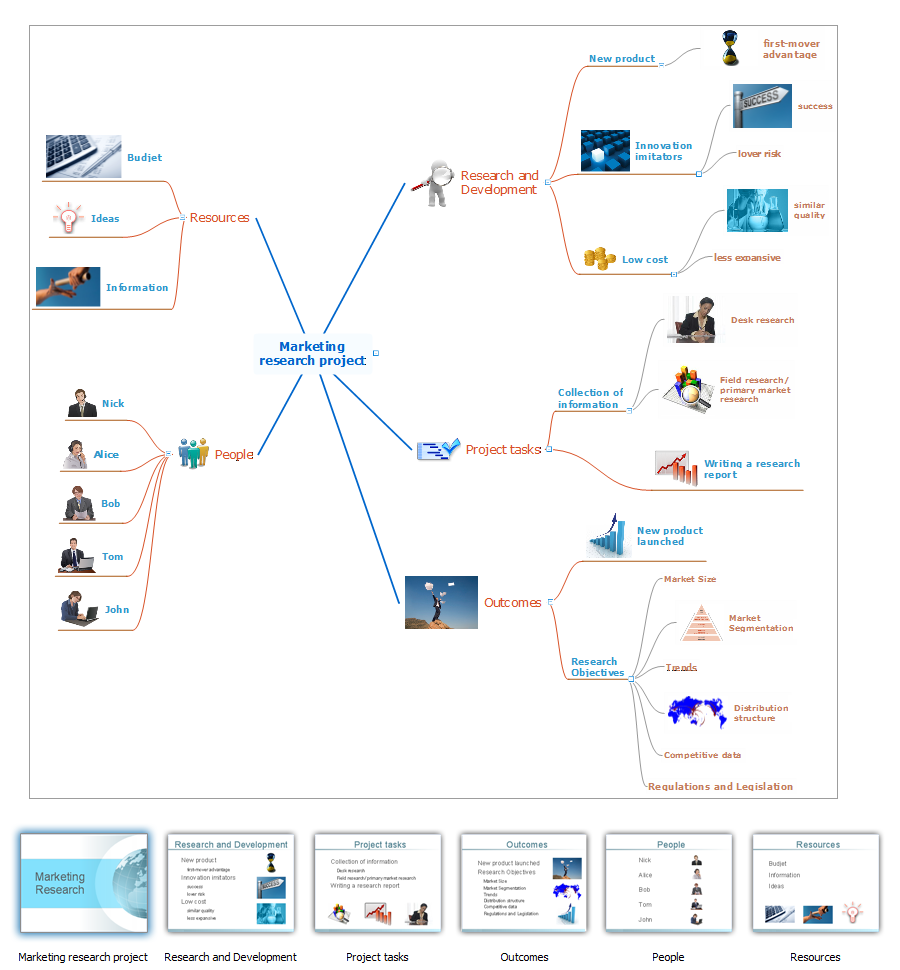
Get a creative look at a quality procedures with mindmaping software ConceptDraw MINDMAP. Mind maps can be of great value in depicting and describing a problem in detail, then structure it, and find the right decision.
A pie chart or a circle graph is a circular chart divided into sectors, illustrating numerical proportion. In a pie chart, the arc length of each sector and consequently its central angle and area, is proportional to the quantity it represents.
Pie chart examples and templates created using ConceptDraw DIAGRAM software helps you get closer with pie charts and find pie chart examples suite your needs.
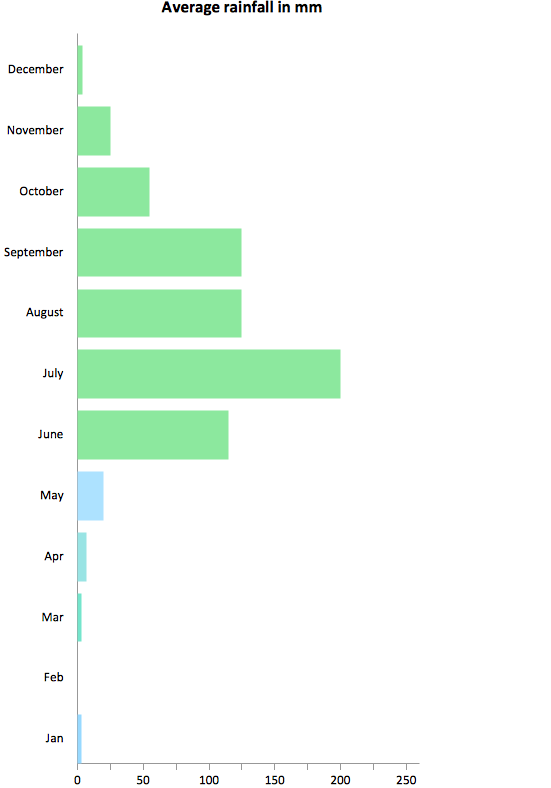
This sample shows the Horizontal Bar Chart of the average monthly rainfalls.
This sample was created in ConceptDraw DIAGRAM diagramming and vector drawing software using the Bar Graphs Solution from the Graphs and Charts area of ConceptDraw Solution Park.