How to Create Presentation
of Your Project Gantt Chart
|
During the planning, discussing and execution of a project you may need to prepare a presentation using project views such as the Gantt Chart, Multiproject Dashboard or Resource Usage View. It’s easy do with !
Pic. 1. window with Slide Preview panel. You can then switch to another view and capture a new slide. Manage your slides in the Slide Preview panel using the context menu. Once you have all slides you need, you can output them into a PowerPoint Presentation. |

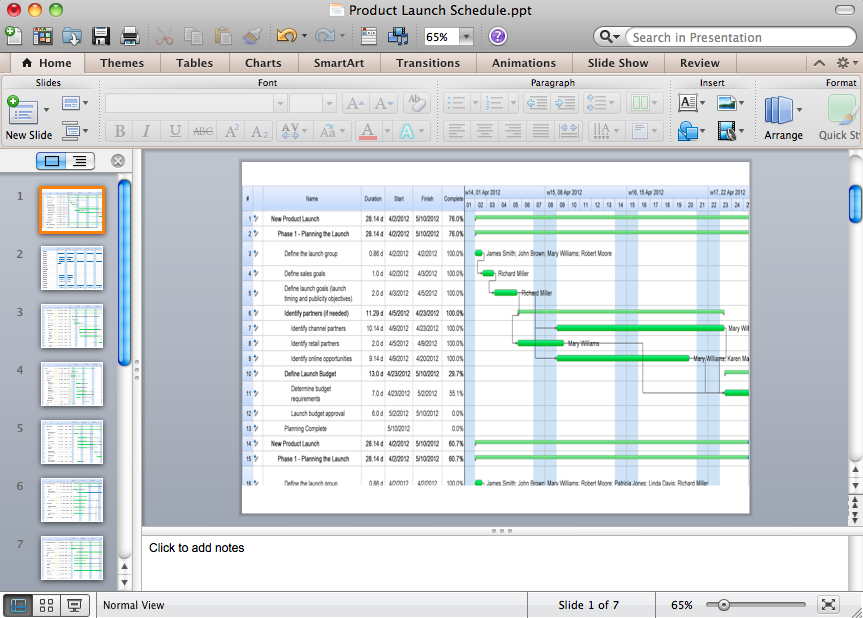
Pic. 2. PowerPoint presentation of a Gantt chart.
Should you want to use images instead of the presentation software, use the PNG button. You’ll get a set of images as a result.
TEN RELATED HOW TO's:
Venn Diagrams visualize all possible logical intersections between several sets and are widely used in mathematics, logic, statistics, marketing, sociology, philosophy, etc.
Using the ConceptDraw DIAGRAM you can create your own professional looking Venn Diagrams quick and easy.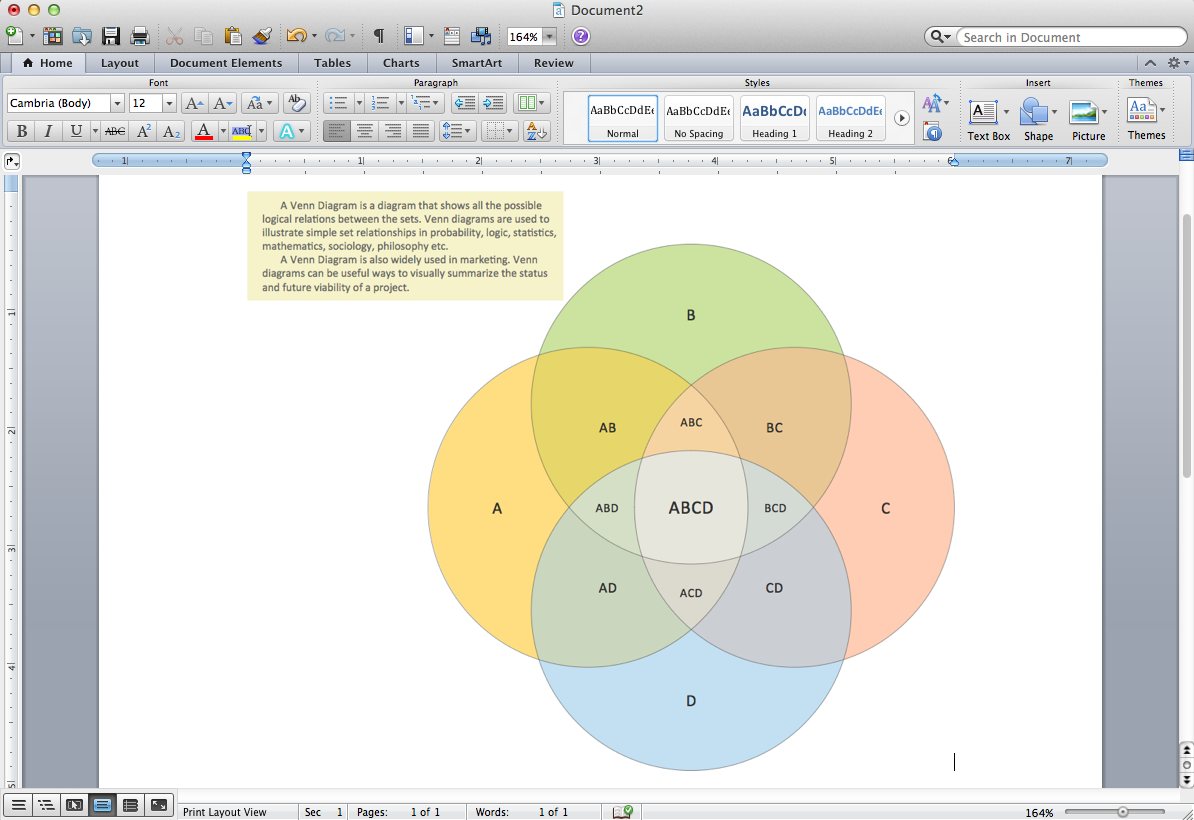
Picture: Venn Diagram Template for Word
Related Solution:
A lot of business process techniques are able to be applied in regular life. Although this tool is considered to be used for business purposes, you can make a SWOT template for yourself. In fact, any obstacle might become a subject for SWOT analysis.
ConceptDraw solution for SWOT analysis solution provides a power visual maintenance of a SWOT analysis. It is a procedure of strategic planning made to discover the Strengths, Weaknesses, Opportunities, and Threats business meet. This mind map template for ConceptDraw MINDMAP isually maintains investigation of good and bad factors. For example, factors that provides an advantage over others are strength; factors that brings a disadvantage are factors of weakness. After the analysis is finished, transfer your data to create a SWOT matrix in ConceptDraw DIAGRAM.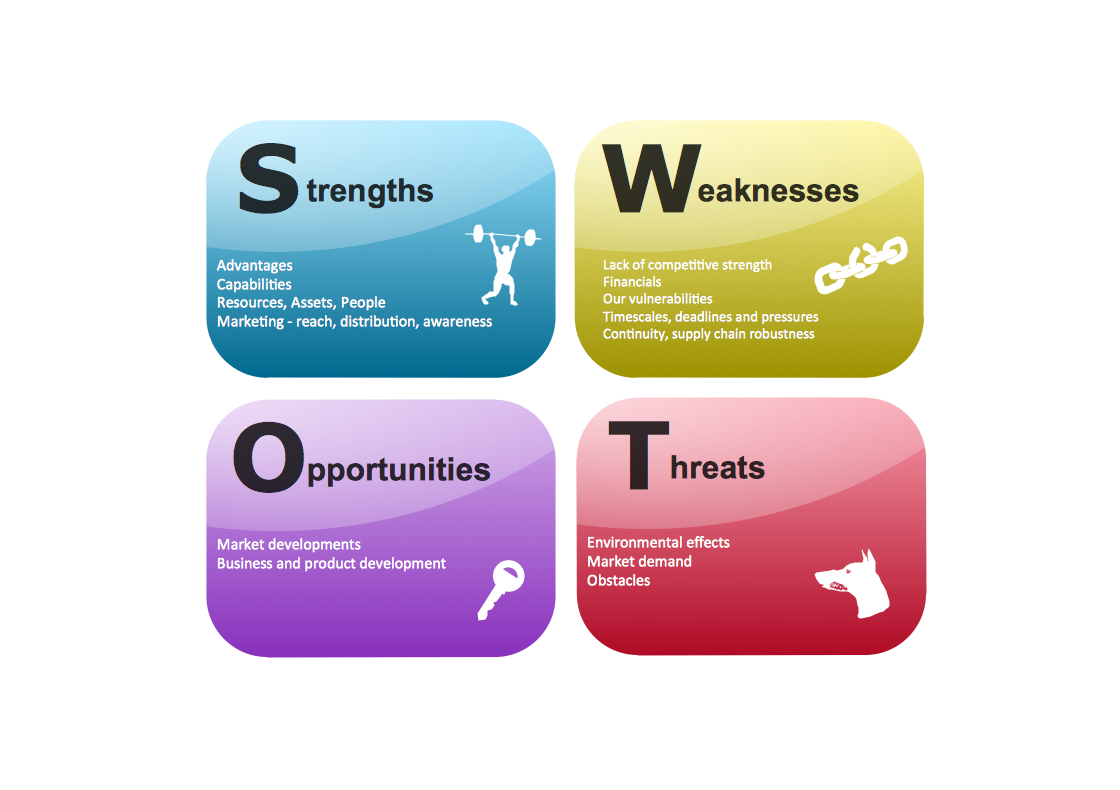
Picture: SWOT Template
ConceptDraw DIAGRAM diagramming and vector drawing software extended with tools of Flowcharts Solution from the Diagrams Area of ConceptDraw Solution Park ideally suits for fast and easy Online Flow Chart designing. We propose to verify this right now.
Picture: Online Flow Chart
Related Solution:
Any hierarchical structure of any company can be represented as a triangle or a pyramid. You can create a pyramid diagram and pyramid chart of any complexity using special libraries included in ConceptDraw DIAGRAM. Actually, any knowledge or chain of facts can also be depicted as a pyramid.
A wide range of graph and chart are utilized in marketing to maintain documentation and various visual issues, that deal with marketing information and data. The marketing value pyramid can be created to illustrate how the value of company, or product is based on its competitiveness. To design this diagram we used ConceptDraw DIAGRAM drawing tools in conjunction with Pyramid solution for Solution Park.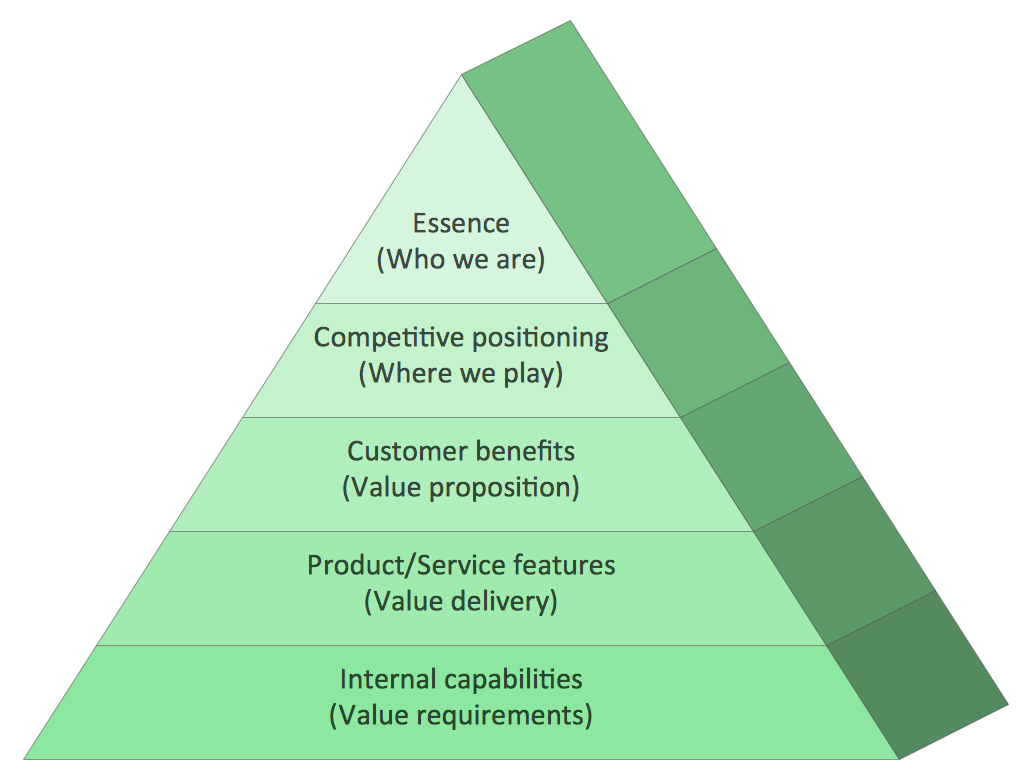
Picture: Pyramid Diagram and Pyramid Chart
Related Solutions:
ConceptDraw - Organigram software allows quickly create Organigrams and much more. ConceptDraw DIAGRAM is an ideal tool for Administrative staff to clearly demonstrate the company orgchart professional.
Picture: Organigrams with ConceptDraw DIAGRAM
Related Solution:
Use Case Diagram Taxi Service UML. This sample was created in ConceptDraw DIAGRAM diagramming and vector drawing software using the UML Use Case Diagram library of the Rapid UML Solution from the Software Development area of ConceptDraw Solution Park.
This sample shows the work of the taxi service and is used by taxi stations, by airports, in the tourism field and delivery service.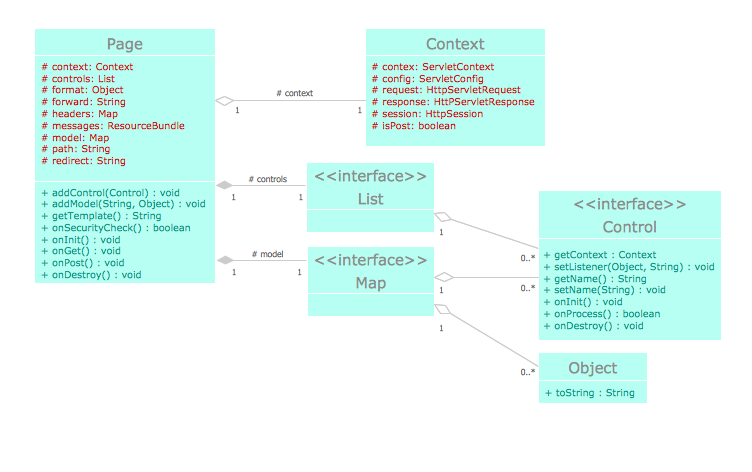
Picture: UML Block Diagram
Related Solution:
Create flowcharts, flow charts, and more with ConceptDraw flowchart software.
Picture: Basic Diagramming. Flowchart Software
Related Solution:
ConceptDraw DIAGRAM diagramming and vector drawing software aspires to help its users in the hiring process and offers a powerful HR Flowcharts Solution from the Management Area of ConceptDraw Solution Park.
Picture: Hiring Process
Related Solution:
Every engineering project starts from a terms of reference document. The next stage of developing is a technical drawing, which requires using appropriate software. However, revisions and discussions about requirements are possible at any stage of development.
This technical drawing demonstrates a schematic flow diagram of pulp reclaiming. This diagram of magnetite pulp reclaiming is created using ConceptDraw Chemical and Process engineering solution, The solution delivers more than 460 vector graphic icons and connectors. Generally, it is intended for designing process and instrumentation diagrams (P&ID) for chemical and process engineering. block flow diagrams (BFD), process flow diagrams (PFD) for chemical industry.
Picture: Technical Drawing Software
Related Solution:
The Line Graphs solution from Graphs and Charts area of ConceptDraw Solution Park contains a set of examples, templates and design elements library of scatter charts.
Use it to draw scatter graphs using ConceptDraw DIAGRAM diagramming and vector drawing software for illustrating your documents, presentations and websites.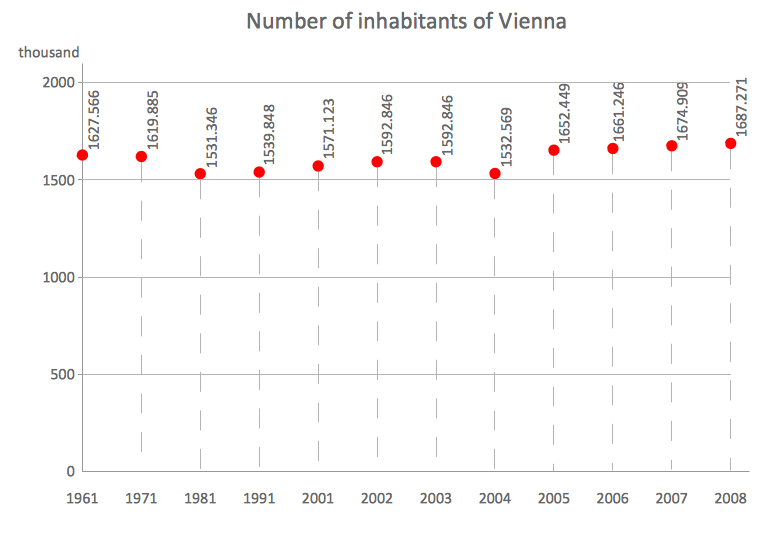
Picture: Scatter Chart Examples
Related Solution:
ConceptDraw
PROJECT 15