Create TQM Flowcharts for Mac
The Total Quality Management Diagrams solution in ConceptDraw Solution Park extends ConceptDraw DIAGRAM diagramming and vector graphics software with samples, templates, and a library of vector stencils for drawing TQM flowcharts on Mac and PC.

Pic.1 Template - TQM diagram.
This TQM diagram template is included in the "Total Quality Management (TQM) Diagrams" solution from the ConceptDraw Solution Park. It helps you to draw TQM flowcharts using ConceptDraw DIAGRAM diagramming software quickly and easily.
This TQM flow chart template explains the meanings of the TQM design elements.
See also Samples:
NINE RELATED HOW TO's:
ConceptDraw DIAGRAM software is the best Mac software for drawing workflow diagrams. Its rich set of samples and templates, and specific features to draw diagrams faster make this software as comfortable as possible for drawing workflow diagrams.
Use the ConceptDraw DIAGRAM professional Mac OS X software for drawing workflow diagram. The Workflow Diagrams solution with its libraries and templates set make the possibility to identify resources that are required for work goal implementation. The process flow diagram identify flow which occurs as network of process dependencies, organizational decisions and interactions between departments. Usually workflow diagrams show business participants actions that carry product or service to the final destination, the consumer.
Picture: Workflow Diagram Software Mac
Related Solution:
Drawing workflow diagrams combines both creative and analytic practice. To be the most effective in this process you should find a software that suites this kind of practice. Using ConceptDraw DIAGRAM software for drawing workflow diagrams you get support of features, libraries, templates and samples boosts you creativity and keep you focus on analytic practice, not drawing specifics.
Picture: Drawing Workflow Diagrams
Related Solution:
The Total Quality Management Diagram solution helps you and your organization visualize business and industrial processes. Create Total Quality Management diagrams for business process with ConceptDraw software.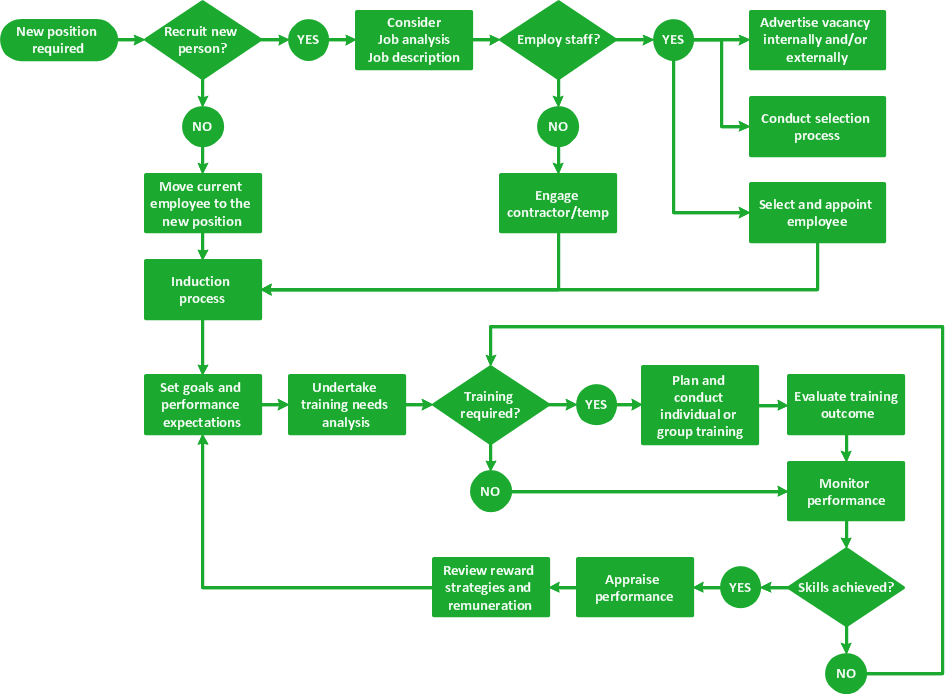
Picture: TQM Software — Build Professional TQM Diagrams
Related Solution:
The Total Quality Management Diagram solution helps you and your organization visualize business and industrial processes. Create Total Quality Management diagrams for business process with ConceptDraw software.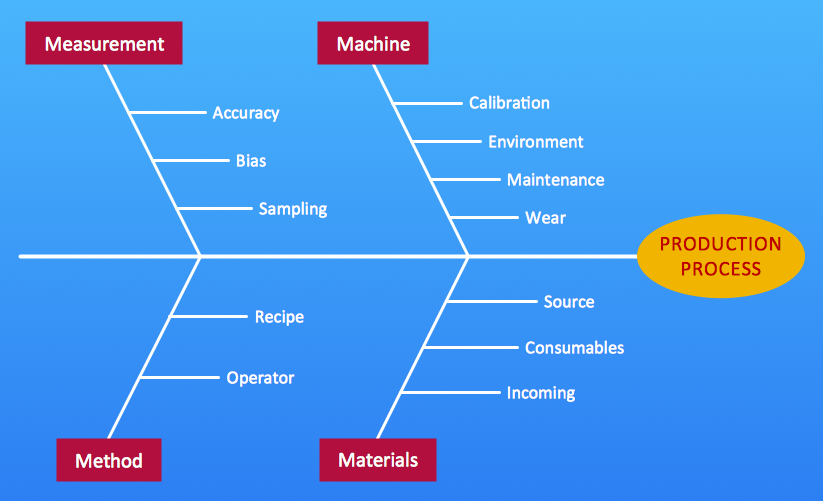
Picture: Total Quality Management Value
Related Solution:
The Total Quality Management Diagram solution helps your organization visualize business and industrial processes. Create Total Quality Management diagrams for business process with ConceptDraw software.
Picture: The Fifty Two Elements of TQM
Related Solution:
The Total Quality Management Diagram solution helps your organization visualize business and industrial processes. Create Total Quality Management diagrams for business process with ConceptDraw software.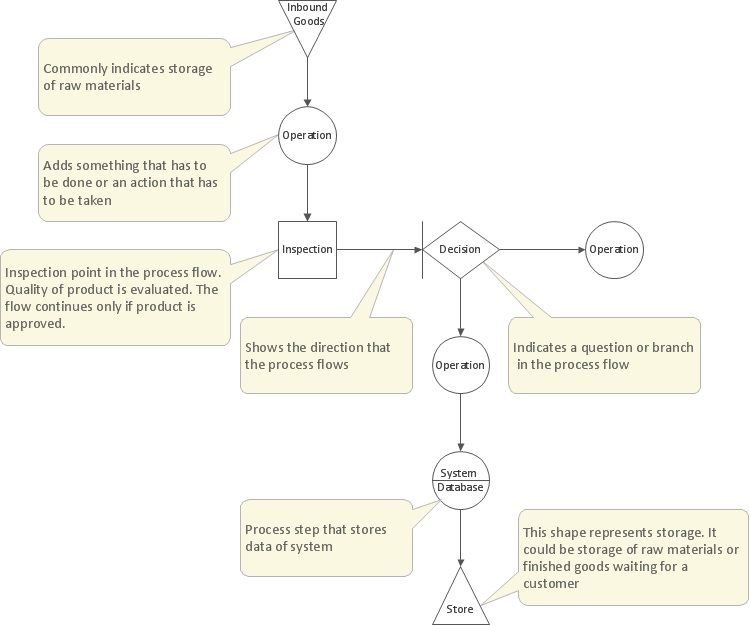
Picture: Management Tools — Total Quality Management
Related Solution:
ConceptDraw DIAGRAM compatible Mac OS X software extended with powerful Entity-Relationship Diagram (ERD) Solution from the Software Development Area for ConceptDraw Solution Park is one of the famous ER Diagram Programs for Mac. It gives the perfect ability to draw ER diagrams for visually describing databases with Chen's and Crow's Foot notation icons.
Picture: ER Diagram Programs for Mac
Related Solution:
Astronomy solution contains 4 libraries with vector objects of all variety of constellations: Constellations Except Zodiac Northern and Southern, Northern Constellations, Southern Constellations and Zodiac Constellations.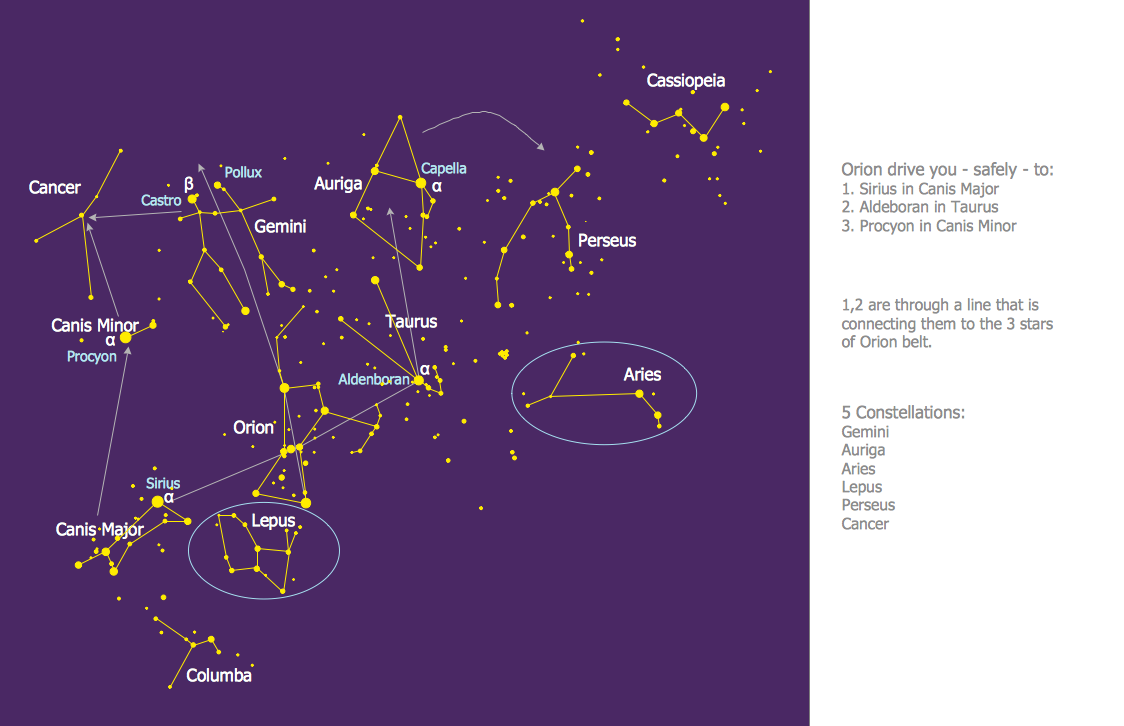
Picture: Constellation Chart
Related Solution:
Data storage is a fundamental aspect of the cloud platform. Microsoft offers scalable, durable and elastic cloud Azure Storage which can be available from any type of application whether it’s running in the cloud and anywhere in the world.
ConceptDraw DIAGRAM diagramming and vector drawing software extended with Azure Architecture Solution from the Computer and Networks area of ConceptDraw Solution Park provides a lot of useful tools which give you the possibility effectively illustrate Microsoft Azure cloud system, Azure services, Azure storage and its components.
Picture: Azure Storage
Related Solution:
ConceptDraw
DIAGRAM 18