Cross Functional Flowchart Symbols
The humble flowchart is one of the more ubiquitous diagrams used when constructing or analyzing business processes. Their simple nature makes them an ideal candidate for use as a solution model to a given problem; possible subject matter is practically limitless, and they can be utilized and understood by all levels of employee throughout a company.
The basic building blocks of a flowchart are always the same — the starting and (sometimes multiple) ending points of the process flow are called 'terminals', and are shown as circles, ovals, stadiums or rounded rectangles. Decisions are described within diamond shapes, and all are connected with arrowed lines that represent the flow of control throughout the process.
The excellent possibility to create attractive Cross Functional Flowcharts for step-by-step visualization the operations of a business process flow of any degree of detailing is offered by ConceptDraw’s Cross-Functional Flowcharts solution. The extensive selection of commonly used vector stencils libraries allow you to demonstrate the document flow in organization, to represent each team member’s responsibilities and how processes get shared or transferred between different teams and departments.
This solution includes the Cross-Functional Flowcharts library with 42 vector cross functional flowchart symbols.

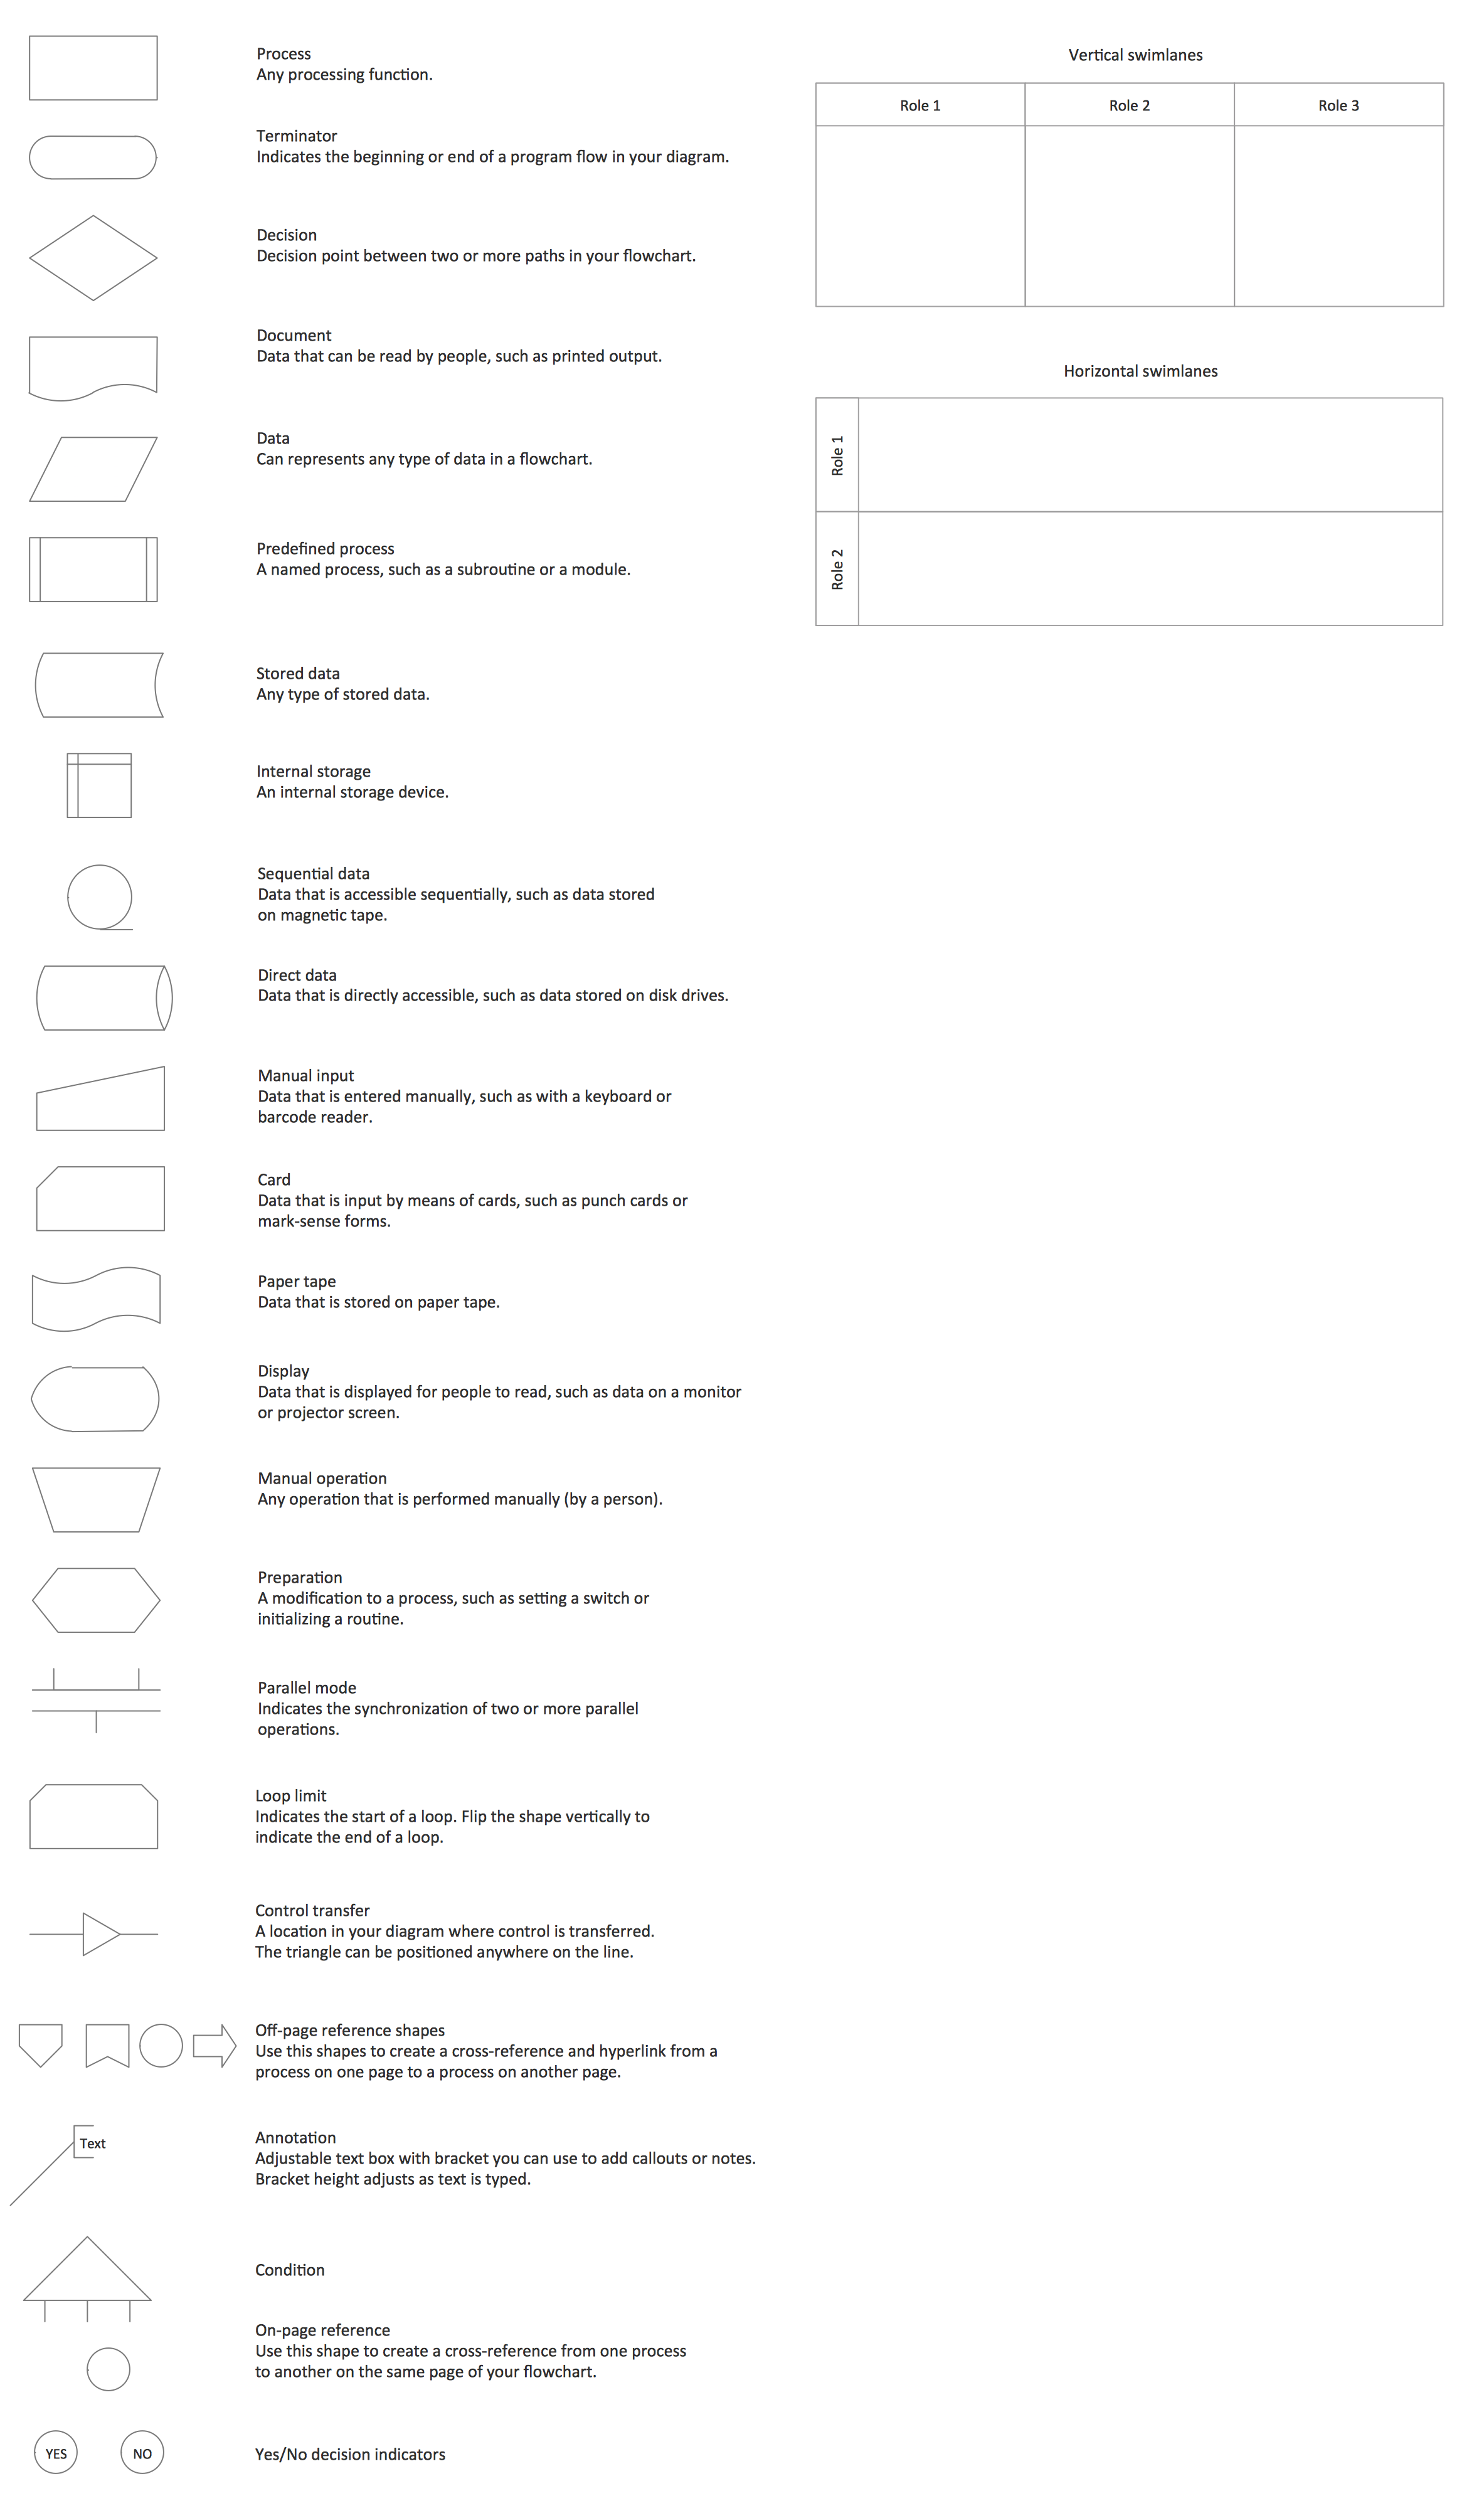
Example 1. Cross Functional Flowchart Symbols Library
All predesigned cross functional flowchart symbols are commonly used and standardized, so your flowcharts created in ConceptDraw DIAGRAM will be comprehensive for all your colleagues and business associates. They include the objects of:
- Vertical and Horizontal Swimlanes - for easy start drawing accordingly vertical or horizontal Cross-Functional Flowchart;
- Process - represents series of steps or actions taken to achieve a definite end;
- Terminator - indicates the beggining or end of a program flow;
- Decision - the decision point before two or more paths in your flowchart;
- Data - represents any type of data in flowchart;
- Document - data that can be read by people, such as printed output;
and wide variety of other cross functional flowchart symbols and objects.
Example 2. Cross Functional Flowchart Symbols
Cross functional flowcharts use swim lanes to provide an extra dimension by assigning each process step to a category. Most often the category is a stakeholder (person, role, or department), but it can also be a machine, a project phase, a resource, or some other attribute.

Example 3. Cross Functional Flowchart Template - Vertical Swim Lanes
We try to make the drawing process in ConceptDraw DIAGRAM as many as possible easier for you, for this purpose were also developed collection of templates which you can find inside the solution.

Example 4. Cross Functional Flowchart Template - Horizontal Swim Lanes
Using the Cross-Functional Flowcharts solution, you can create professional looking flowcharts in an instant. Before designing any Cross Functional Flowchart, activate the Chain connection mode by using the Chain Mode button on the Home toolbar and follow the next steps for design:
- Drag the Swimlanes vertical or Swimlanes horizontal object from the Cross-Functional Flowchart library to the document’s page. When releasing the mouse button, the object automatically resizes according to the page size.

Example 5. Adding Swimlanes Vertical Object
- The object's Action button allows you easily add additional lanes and then equalize them, and also delete lanes, if needed.

Example 6. Swimlanes Object's Action Menu
- Add the process steps to the appropriate lanes on the diagram using the suitable objects from the Cross-Functional Flowchart library. The added objects appear on the flowchart as connected objects. At this is important to avoid a lot of criss-crossing of flow lines.

Example 7. Adding Cross Functional Flowchart Symbols
- Add text to the diagram and format the objects.

Example 8. Cross Functional Flowchart - Approval Process
All Cross Functional Flowchart examples are available from ConceptDraw STORE in Cross-Functional Flowcharts Solution section. They were developed in ConceptDraw DIAGRAM specially to help you in your own Cross Functional Flowcharts designing.

Example 9. Cross Functional Flowchart Solutions
The Cross-Functional Flowcharts solution is a professional and powerful tool for those who need to represent the transferring of data, documents, and tasks during performance of a work process in organization in a visual manner using the Cross-Functional Flowcharts.
TEN RELATED HOW TO's:
If you need to describe some process, diagramming is a perfect tool for almost any imaginable purpose. The set of the most commonly used flow charts symbols is quite wide and includes symbols for operations, processes, data inputs and outputs. You can see the full list of all the symbols used for flowcharting in Flowcharts solution from Diagrams area in ConceptDraw Solution Park.
A flow chart is often used for visual representation of a sequential process flow. The flowchart approach to any process is to divide it into some sequential actions. What makes a flow chart so popular and clear to make out is the set of standard flowchart symbols that has the same reading independently from processes described with their applying. The current drawing represents the vector library containing the pack of standard flowchart symbols. This library is supplied with ConceptDraw Flowcharts solution.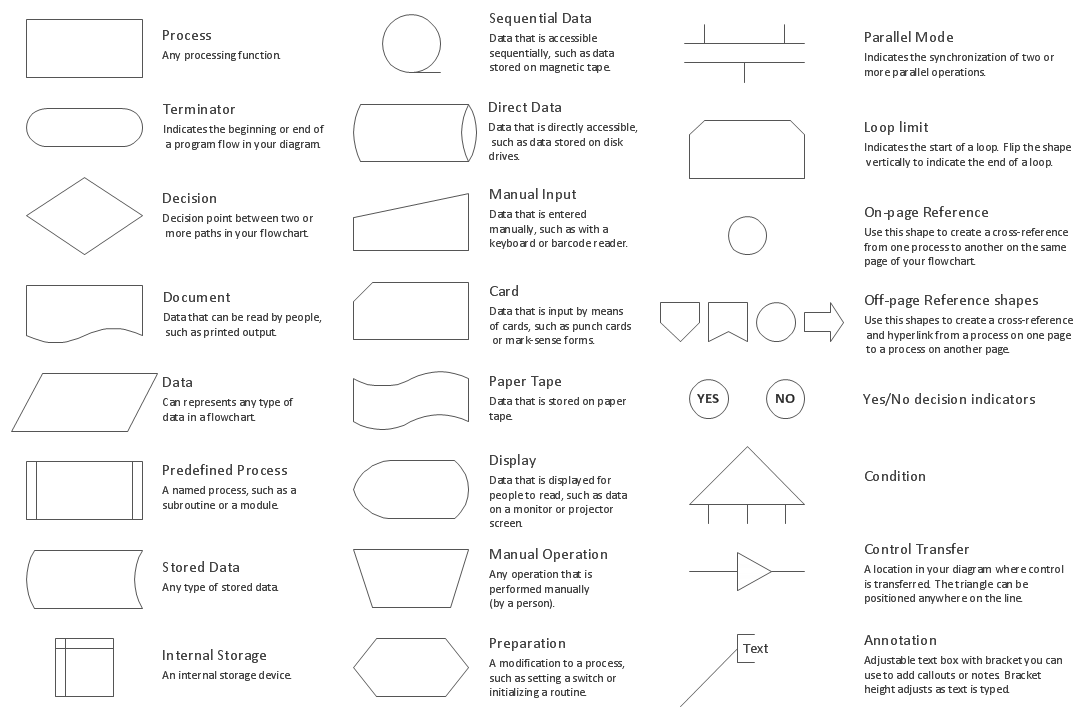
Picture: Flow Chart Symbols
Related Solution:
Also included are standardized hr flowchart symbols, meaning your diagrams will be relevant and understood by all business associates.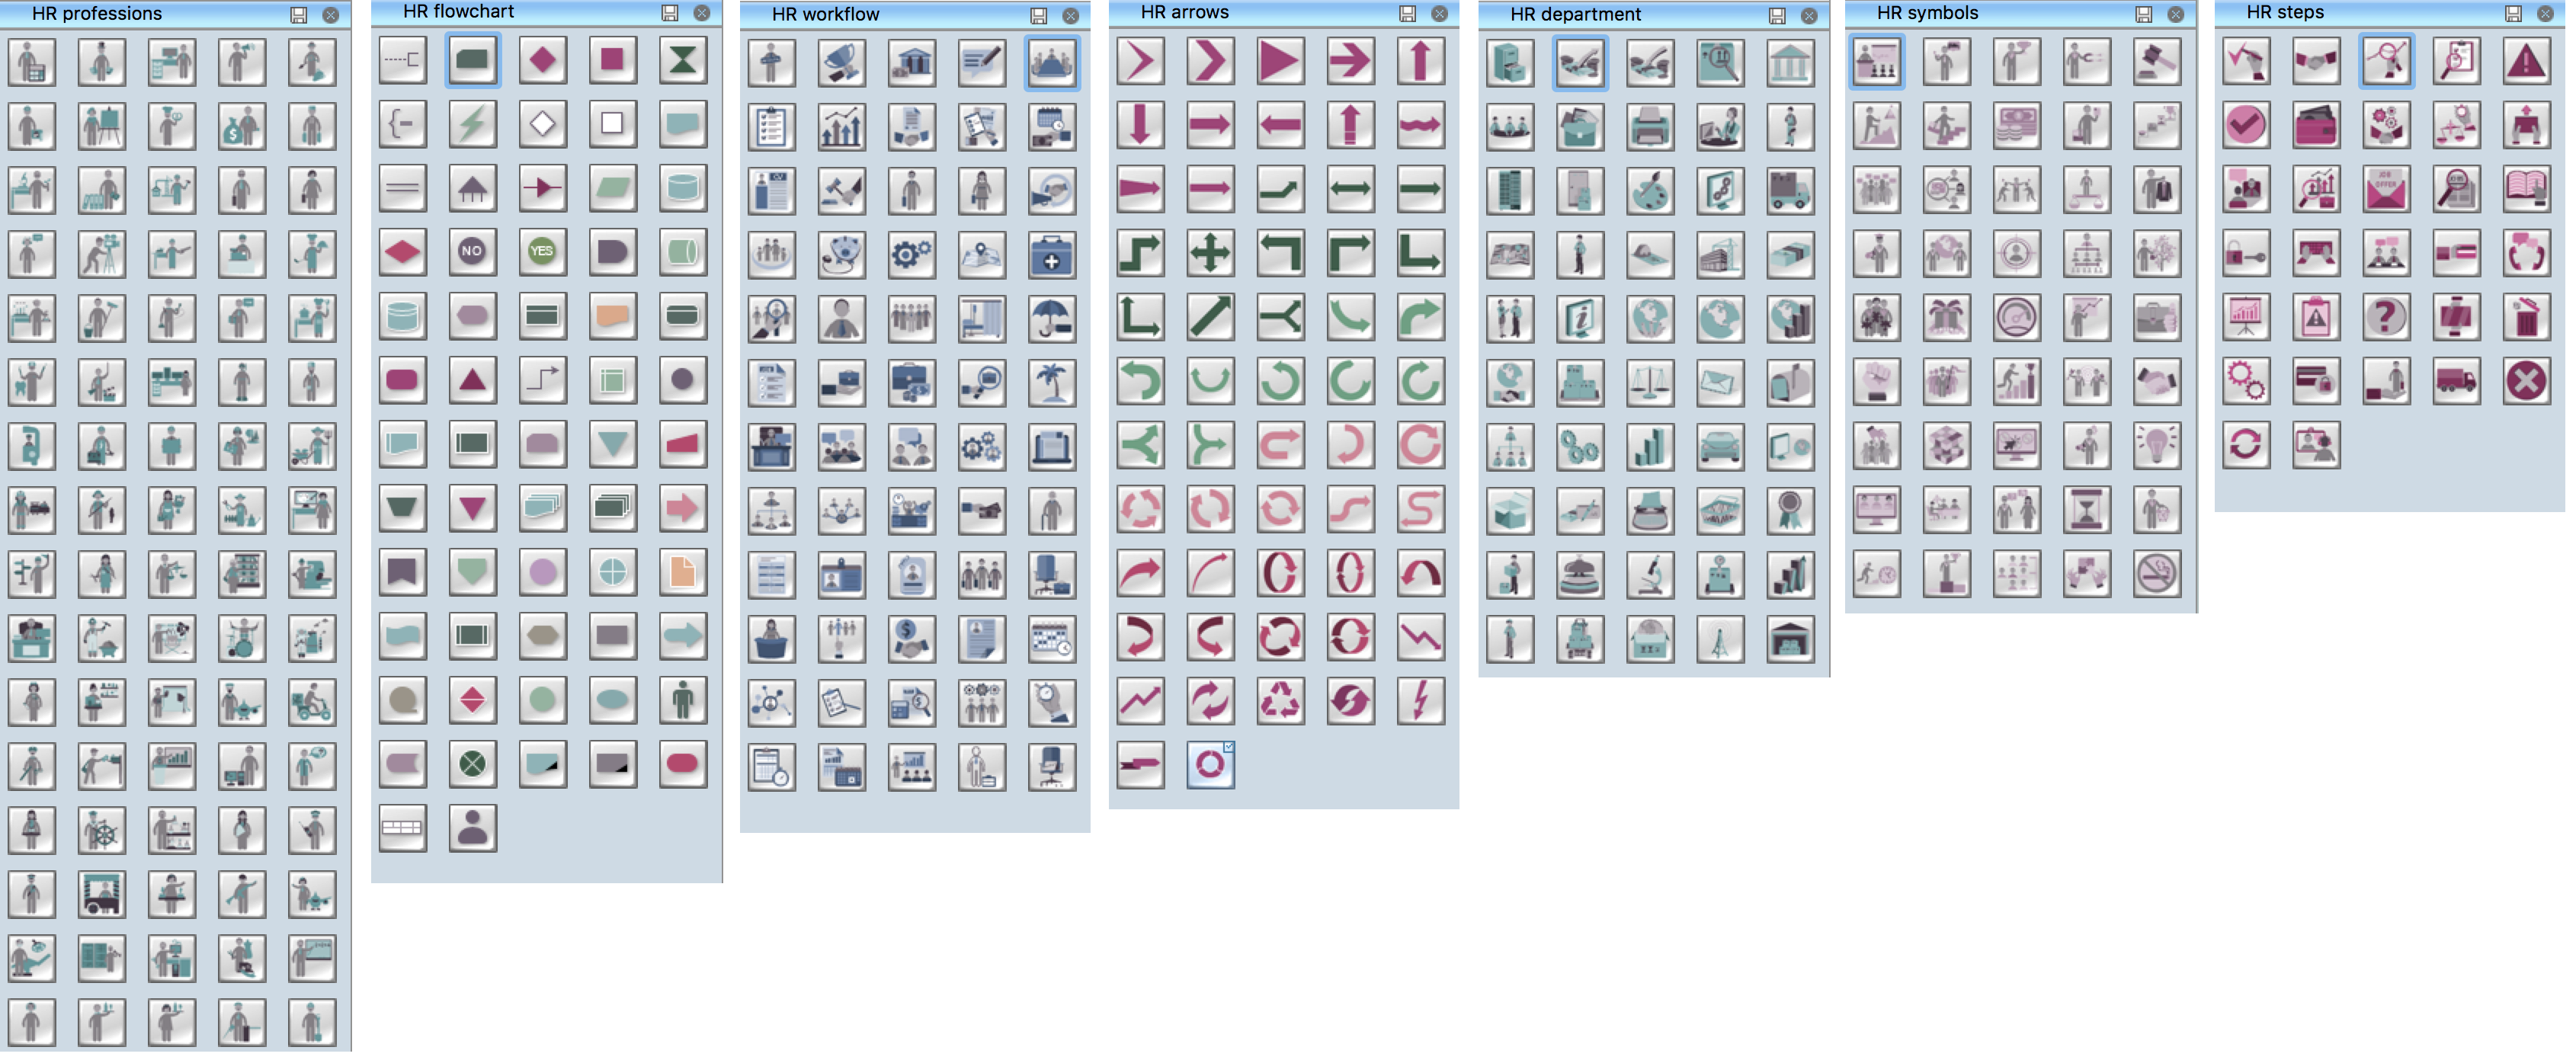
Picture: HR Flowchart Symbols
Related Solution:
If you want to find a way to understand complex things in minutes, you should try to visualize data. One of the most useful tool for this is creating a flowchart, which is a diagram representing stages of some process in sequential order. There are so many possible uses of flowcharts and you can find tons of flow charts examples and predesigned templates on the Internet. Warehouse flowchart is often used for describing workflow and business process mapping. Using your imagination, you can simplify your job or daily routine with flowcharts.
Warehouse flowcharts are used to document product and information flow between sources of supply and consumers. The flowchart provides the staged guidance on how to manage each aspect of warehousing and describes such aspects as receiving of supplies; control of quality; shipment and storage and corresponding document flow. Warehouse flowchart, being actual is a good source of information. It indicates the stepwise way to complete the warehouse and inventory management process flow. Also it can be very useful for an inventory and audit procedures.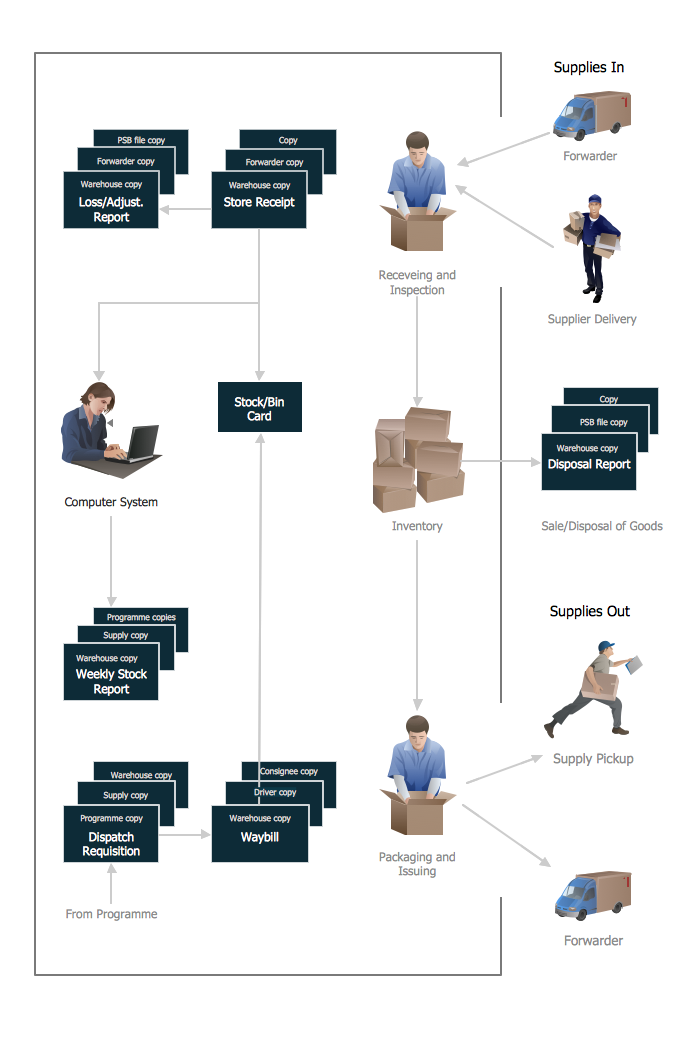
Picture:
Flow chart Example
Warehouse Flowchart
Related Solution:
In ConceptDraw DIAGRAM it really is sp simple to draw even the most complex cross-functional flowcharts. Use the RapidDraw technology and Cross-Functional libraries in ConceptDraw DIAGRAM for the best results.
Picture: How to Simplify Flow Charting — Cross-functional Flowchart
Related Solution:
ConceptDraw DIAGRAM extended with Cross-Functional Flowcharts Solution from the Business Processes Area is the best software for quick and easy designing Cross Functional Flowchart of any complexity. Make sure in it right now!
Picture: Cross Functional Flowchart
Related Solution:
ConceptDraw DIAGRAM extended with Cross-Functional Flowcharts Solution from the Business Processes Area is a powerful software which offers a variety of Cross Functional Flowchart examples. The use of predesigned examples as the base for your own Cross Functional Flowchart Diagrams is a timesaving and useful way.
Picture: Cross Functional Flowchart Examples
Related Solution:
Describing a workflow or approval process can take hours and be too complicated, especially since there are options to do it quickly and vividly. Diagrams called flowcharts replace long paragraphs of boring text and represent information in a graphic way. You can draw one on paper or you can use flowchart software to do it quickly and scalable. This kind of software is easy to use and you don’t need any special skills to start using it. In addition, there are a lot examples and predesigned templates on the Internet.
Flowcharts are a best tool for staking out a huge and complex process into some small readable parts. Surely, flowcharts can be drawn manually but the use of standard symbols that make it clear for a wide audience makes a software tool preferred for this task. The core for a successful flowchart is its simplicity. That is why often before beginning making flowchart through software, people draw the sketch on a piece of paper. Designing an effective flowchart means the combination of the data needed to be shown and the simplicity with which you depict it.
Picture: Flowchart Software
Related Solution:
A flowchart is a simple but very functional tool when it comes to understanding a workflow or to removing unnecessary stages from a process. When drawing flowcharts, keep in mind that there are four common types of flowcharts, like document flowcharts and data flowcharts that show control over a data or document flow over a system. To show controls on a physical level, use system flowcharts. In addition, to show controls in a program, you can draw a program flowchart.
This flowchart diagram represents the piece of an article editing process, that involves the author and editor. It was created using the Basic Flowchart notation that consists from the basic flowchart symbols. The start and the end of the process are indicated with "Terminator" symbols. The "Process" symbols show the action steps consisting from making edits and searching for a compromise, when the author does not agree with the suggestions of the editor. The "Process" symbol is the general symbol in process flowcharts. The "Decision" symbol indicates a branching in the process flow. There are two branches indicated by a Decision shape in the current flowchart (Yes/No, Disagree/Agree). This basic flowchart can be used as a repeating unit in the workflow diagram describing the working process of some editorial office.
Picture: Types of Flowcharts
Related Solution:
Accounting is a cornerstone of any business, it’s basement. If you want to have a visual representation of your finance management, use audit flowchart symbols to document the money flow. Although some would say that accounting is boring, it is very a responsible duty.
The audit flowchart symbols is supplied with ConceptDraw Audit Flowcharts solution as a vector objects library. Together with Conceptdraw Drawing capabilities it forms the helpful tool for audit process planning and setting the steps of audit by designing audit flow charts. Audit Flow charts are used to organize fiscal information tracking process as well as in accounting, finance and investment management.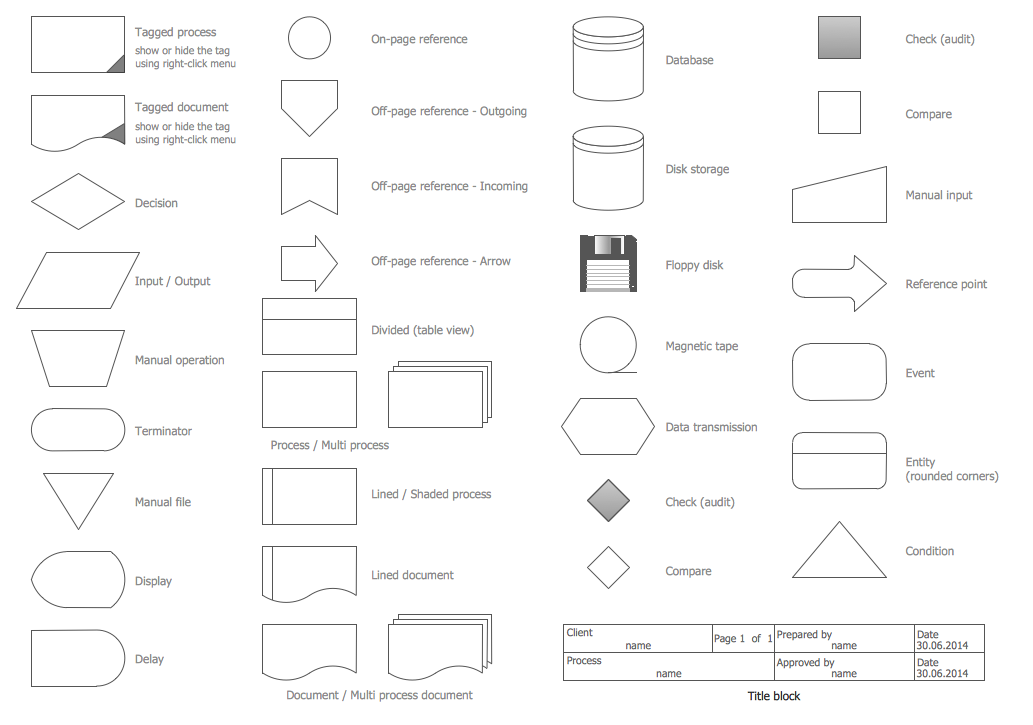
Picture: Audit Flowchart Symbols
Related Solution:


